Bottom-building stage, waiting for riseYesterday, Bitcoin experienced a minor rebound after testing the support level near $112,000. However, during the early trading session, it fluctuated and declined, erasing yesterday's gains. As shown on the hourly chart, the $112,000 level has proven to be a strong support, having withstood three tests under pressure. Currently, Bitcoin is in a consolidation phase, and once this phase is completed, we can expect a significant upward movement. For those who are bullish on Bitcoin, it is recommended to consider entering long positions around $113,000, with a stop-loss set near $112,000.
BTCETH.P trade ideas

Bitcoin to 80,937$ within 45 days!How much more specific can I get.
Hey, I'm back, you can probably tell by my writing style after 4 years.
Eventually, bitcoin will go to 32,026$ to find support within the next 1.5 years before bitcoin sees another meteoric ascend to 300,000$

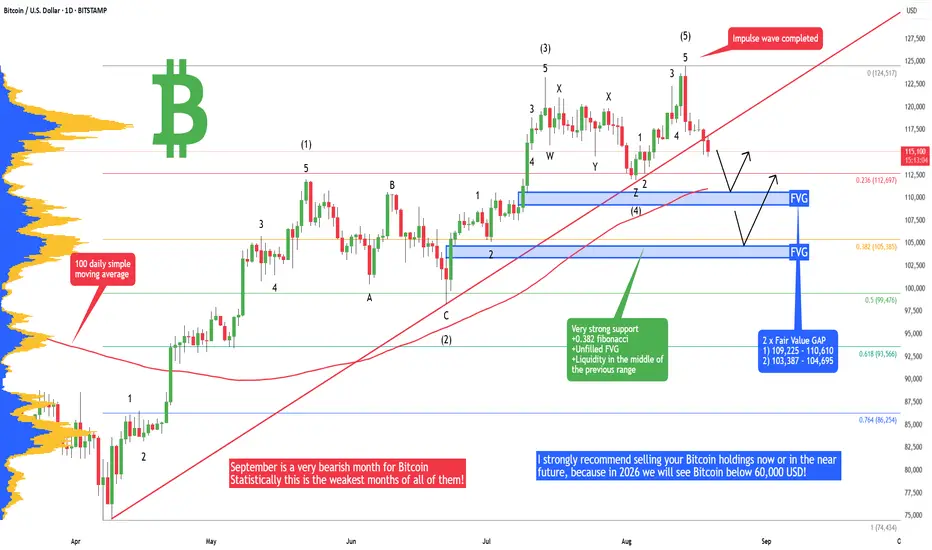
Bitcoin - Avoid BTC at all cost! What is coming will blow you.I strongly recommend selling your Bitcoin holdings now or in the near future, because in 2026 we will see Bitcoin below 60,000 USD! I will tell you why in this analysis.
But first let's look at the local price action on the daily chart and what is going to happen with Bitcoin in the short term. I expect Bitcoin to fall to 110,600 in the immediate short term; this is my first profit target for the intraday position. Why is 110,600 a strong support? We have the first FVG on the daily chart that has never been tested, and also we have a 100-day moving average. This is a pretty good support for intraday trades.
Later in September we will probably see Bitcoin at 104,800. Why is 104,800 a strong support? We have to look at the previous price action from May to July, because we have a range/bull flag, and there is also an unfilled FVG. The previous major swing low of 105,130 is something where people put a lot of stop losses below it. That's a magnet for whales; they probably want to buy here. Also, there is the 0.382 Fibonacci retracement level of the previous impulse wave.
Why is Bitcoin so bearish now? Well, we have completed an impulse wave 12345, and also the red trendline is breaking down! That's in general a bearish price action. Early in the article I was talking about 60k BTC - for this, you need to look at my previous analysis to understand the full picture.
Write a comment with your altcoin + hit the like button, and I will make an analysis for you in response. Trading is not hard if you have a good coach! This is not a trade setup, as there is no stop-loss or profit target. I share my trades privately. Thank you, and I wish you successful trades!
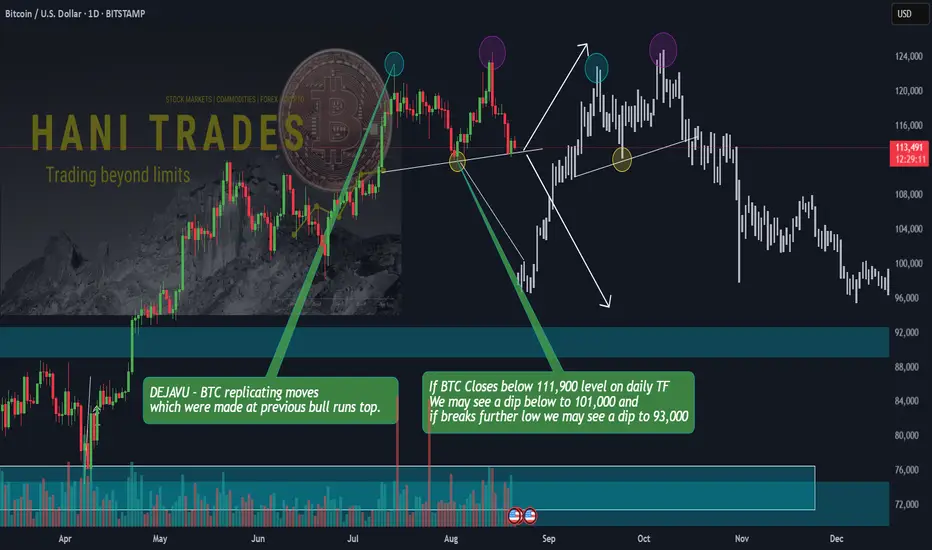
BTC – DEJAVU Pattern: Top Formation or Next Leg Higher?BTC – DEJAVU Pattern: Top Formation or Next Leg Higher?
Idea Description
Bitcoin is showing a DEJAVU pattern similar to previous bull run tops, with price structure replicating past cycle behavior. The critical level to watch is 111,900 on the daily timeframe.
A close below 111,900 could open the door for a dip toward 101,000 and possibly 93,000 if weakness continues.
However, if BTC defends this level and reclaims 116,500–118,000, the bearish outlook is invalidated, and we may see a push back toward 124,000+.
BTC is at a make-or-break zone, and upcoming daily closes will decide whether this is a distribution top or a continuation setup. Traders should stay flexible and manage risk accordingly.
What do you think?
Is BTC forming a cycle top here, or is this just a healthy correction before another leg up?
Share your thoughts and let’s see which side the community is leaning toward
📊 Quick Poll:
Do you think BTC is at a Top or setting up for Continuation?
✅ Top
🚀 Continuation
Vote with your emoji
#BTC #Bitcoin #Crypto #CryptoTrading #BTCUSD #TradingView #CryptoAnalysis #BitcoinUpdate #PriceAction #CryptoMarket
BITCOIN BULLS ARE GAINING STRENGTH|LONG
BITCOIN SIGNAL
Trade Direction: long
Entry Level: 113,384.53
Target Level: 119,504.33
Stop Loss: 109,334.66
RISK PROFILE
Risk level: medium
Suggested risk: 1%
Timeframe: 1D
Disclosure: I am part of Trade Nation's Influencer program and receive a monthly fee for using their TradingView charts in my analysis.
✅LIKE AND COMMENT MY IDEAS✅

BTC NEAR RANGE LOWSBitcoin has pulled back after failing to break cleanly above resistance at 123,231. That rejection, marked by the long wick on the recent candle, signaled strong selling pressure near the highs. Since then, price has retraced sharply and is now testing the key support zone around 112,000.
The 50-day moving average (blue line) was lost during the decline, showing weakening short-term momentum. If bulls cannot defend the 112k level, the next clear support lies closer to 100,703, which also aligns with the longer-term volume and trend structure.
On the upside, buyers need to reclaim 114k–116k to re-establish momentum and challenge the highs again. For now, the market remains in a range between 112k support and 123k resistance, with no clear breakout direction.
Until price resolves this consolidation, expect continued choppiness and failed moves in either direction to set the tone.

HAS THE WAVE 5 STUCTURE PLAYED OUT? OR ONE LAST PUSH FOR BTC??
✅ Elliott Wave Count (Impulse: 1 to 5, then ABC Correction)
It seems to me that Bitcoin completed a 5-wave impulse from the 2018 bottom to the 2025 peak:
• Wave 1: 2018–2019 rally.
• Wave 2: 2019–2020 correction.
• Wave 3: Massive rally into late 2021 (this looks extended).
• Wave 4: Correction into 2022–2023.
• Wave 5: Final rally ending in 2025 (~$130K area).
This count looks valid under standard Elliott Wave rules:
• Wave 3 is not the shortest (it's extended).
• Wave 4 doesn’t overlap Wave 1 territory.
• Clear alternation between Wave 2 and Wave 4.
________________________________________
📉 ABC Correction Outlook (Bearish Bias After Wave 5)
I mapped an (A)-(B)-(C) correction scenario:
• Wave A possibly back to the ~$55-62K region.
• Wave B retrace back to ~$80–90K.
• Wave C targeting the $30K–$35K zone — which aligns with the previous accumulation zone and Fibonacci cluster.
That’s a trading flat or expanded flat correction—realistic and supported by the chart structure.
________________________________________
🔢 Fibonacci Extensions & Retracement Levels
I noted two key levels:
• Level 4.236 (Black): ~$120K — aligns almost perfectly with Wave 5 peak → This is a strong confluence zone.
• Level 11 (Blue): ~$122K — Fibonacci extension from a larger degree → Possibly indicating macro top.
Yes, both levels seem valid and reinforce the end of Wave 5.
Other supportive confluences:
• The Fibonacci clusters in the $35K area line up with historical support and projected Wave C bottom.
• $55K–$69K area (Wave A target) overlaps with the previous ATH range from 2021, a critical support/resistance flip zone.
________________________________________
🟠 Other Observations
• The red triangle breakout in Wave 5 suggests a terminal pattern (ending diagonal).
• The bearish divergence (not shown but likely present based on wave structure) could support the top.
• High-volume node around $30K–$35K supports it as a potential Wave C bottom.
________________________________________
🔚 Summary
My analysis is:
• Technically using both Elliott Wave and Fibonacci tools.
• Well-structured with a realistic ABC correction forecast.
• Accurate in identifying major confluence zones ($120K–$122K top, $55K, and $35K retracement zones).
🔮 What to Watch
• Confirmation of Wave 5 top (break below ~$100K).
• Behavior around $69K–$55K zone (Wave A potential completion).
• Any early accumulation signals near $30K–$35K if Wave C plays out.

Bitcoin Holds the Line – $112.2K Is Key SupportAccording to on-chain data, BTC’s move to $125K was driven by short liquidations, not new capital inflow, therefore a rejection of highs into further consolidation was expected, after confirming by technical analysis reversal pattern. When rallies aren’t backed by real inflows, the downside tends to be ruthless. After rally printed a new all-time high, then tactical traders triggered a chain of long liquidations.
So the question now is—was this just a flush before a fresh leg up? Or is this market still unwinding?
I remain bullish from current levels. The recent drop looks more like a healthy correction than a trend reversal.
Key Risk:
The bullish scenario breaks if $112,200 support fails and we see a confirmed reversal structure (not just one wick/ short-term candle, but several days of follow-through).
Support Levels to Watch (Buy-the-Dip Zones):
$112,500
$101,400
$92,600
Macro View:
Liquidity signals continue to improve, profit-taking is largely complete, and we don’t see a cycle top yet. Long-term structure remains bullish, and this pullback should be seen as an accumulation opportunity.
Disclaimer:
Markets are subject to unpredictable events and the randomness of markets, please use appropriate risk management. DYOR
Bitcoin – Silence at the 0.618, Fate Awaits Beyond the Citadel.⊣
⟁ BTC/USD - BINANCE - (CHART: 1D) - (Aug 21, 2025).
◇ Analysis Price: $113,851.76.
⊣
⨀ I. Temporal Axis - Strategic Interval - (1D):
▦ EMA9 - $115,774.47:
∴ Price currently trades below EMA9, confirming short-term bearish control;
∴ Recent candles show rejection at EMA9 with no sustained recovery;
∴ EMA9 is now acting as immediate dynamic resistance.
✴️ Conclusion: Short-term bias remains bearish.
⊢
▦ EMA21 - $116,406.15:
∴ EMA21 overlaps with Bollinger midline, reinforcing resistance;
∴ Market has repeatedly failed to reclaim this level;
∴ Confirms mid-range structural weakness.
✴️ Conclusion: EMA21 = critical rejection zone.
⊢
▦ EMA50 - $114,864.59:
∴ Price hovering around this level in confluence with Fib 0.618;
∴ Sustained breakdown may unlock deeper retracements;
∴ Acts as battlefield between bulls and bears.
✴️ Conclusion: EMA50 = structural pivot under pressure.
⊢
▦ EMA200 - $103,250.81:
∴ Long-term trend support, still untouched;
∴ Represents final defense line for macro-bullish structure;
∴ Bears will target it if Fib 0.5 and 0.382 fail.
✴️ Conclusion: EMA200 = macro fortress below.
⊢
▦ Bollinger Bands (21, 2, base EMA9) - $121,471.73 / $116,406.15 / $111,340.57:
∴ Price moving towards lower band after rejection at midline;
∴ Bands widening, signaling volatility expansion;
∴ Downward trajectory consistent with bearish volatility regime.
✴️ Conclusion: Bands confirm ongoing bearish expansion.
⊢
▦ RSI (21, 9) - 46.86 / 50.67:
∴ RSI trending below neutral 50;
∴ No bullish divergence spotted;
∴ Momentum favors sellers.
✴️ Conclusion: RSI validates bearish control.
⊢
▦ MACD (9, 21, 9) - Line: –766.13 / Signal: –631.35 / Histogram: –134.78:
∴ Bearish crossover intact, histogram negative;
∴ Acceleration of bearish momentum confirmed;
∴ No signal of reversal yet.
✴️ Conclusion: MACD reinforces bearish regime.
⊢
▦ ADX (21, 9) - 25.31:
∴ Above 25 = trend gaining strength;
∴ Directional bias negative;
∴ Confirms transition from range into downtrend.
✴️ Conclusion: Bearish trend strengthening.
⊢
▦ MFI (21) - 40.14:
∴ Below 50 = capital outflows dominate;
∴ No oversold conditions yet;
∴ Space for further selling pressure.
✴️ Conclusion: Flow aligned with bearish market.
⊢
▦ OBV (21, BB2) - (–86.16K):
∴ Downward OBV shows distribution phase;
∴ Confirms sellers in control of volume dynamics;
∴ Bears dominate liquidity.
✴️ Conclusion: OBV confirms distribution bias.
⊢
▦ StochRSI (3, 3, 21, 9) - K: 8.01 / D: 7.62:
∴ Oversold condition;
∴ May allow short-term relief bounces;
∴ But no confirmed bullish reversal yet.
✴️ Conclusion: Short-term oversold, but within bearish context.
⊢
▦ Fibonacci Retracement (0.000 / 1.000):
0.618 -> $114,049.13 - (current battlefield, price at edge);
0.500 -> $111,058.33 - (next target if broken);
0.382 -> $108,067.53 - (deeper continuation);
0.236 -> $104,367.05 - (bear extension);
EMA200 confluence near 0.236 zone = macro defense.
✴️ Conclusion: 0.618 = last defense before accelerated bearish continuation.
⊢
⨀ II. Derivatives Sentiment – Skew, 180D Deribit - (Source: Amberdata & Coindesk):
▦ Call-Put Skew (180D / –0.42) - (Aug 21, 2025):
∴ Most negative since Jun/2023;
∴ Reflects strong demand for puts vs calls = hedging / defensive positioning;
∴ Institutional sentiment aligned with technical bearish regime.
✴️ Conclusion: Skew confirms institutional bearish caution.
⊢
🜎 Strategic Insight - Technical Oracle:
∴ The 1D chart reveals a bearish regime shift. Price rejected EMA21 + Bollinger midline, failing to regain momentum;
∴ EMA50 + Fib 0.618 ($114K) is under siege, and breakdown would expose $111K and $108K zones;
∴ Momentum indicators (MACD, RSI, ADX) align with bears, while OBV + MFI confirm capital outflows and distribution;
∴ The only counterpoint is StochRSI oversold, which may fuel minor relief rallies, but not structural reversal.
⊢
⚚ Coupled with the (Deribit 180D) Skew plunging to (–0.42 = most negative in 2 years), the institutional derivative market validates the caution: Risk aversion dominates ahead of Jackson Hole, with Powell’s speech poised as catalyst for either breakdown or miraculous reclaim above EMA21 - ($116.4K).
∴ The battlefield is set:
Above ($116.4K) = reclaim & neutralization;
Below ($114K) = bear continuation -> ($111K / $108K);
If EMA200 breaks ($103K) -> full structural collapse.
⊢
𓂀 Stoic-Structural Interpretation:
✴️The BTC/USD daily structure now embodies the essence of stoic fate: inevitable compression leading to directional release.
∴ Structure of Trend: EMA's (9, 21, 50) breached, with price now clinging to the (Fib 0.618 - $114K) - the last bastion before surrender to deeper retracement ($111K / $108K). EMA200 ($103K) stands as the final citadel of macro structure;
∴ Momentum of Will: RSI below neutrality, MACD in decisive bearish cross, ADX strengthening - the market’s will bends toward decline. Only the StochRSI whispers of oversold respite, a fleeting breath amid descent, not yet salvation;
∴ Flow of Capital: MFI and OBV confirm distribution, liquidity escaping upward promise into the void. Volume contracts, yet each rejection seals the bearish dominion further;
∴ Derivative Oracle: The 180D Deribit Skew (–0.42), most negative since 2023, signals that institutions cloak themselves in protection. Demand for puts over calls mirrors stoic prudence: fortify the self, expect the storm.
✦ Structure Thus:
The market is bound by fatum;
Only a reclaim above $116.4K reopens the gates of neutrality;
Failure below $114K drags the structure into its stoic descent, step by step, until the macro fortress at $103K is tested.
✴️ Conclusion: Bitcoin stands in compression before expansion. The silence of charts echoes the discipline of Stoicism: prepare for loss, endure the storm, and only act when the structure allows.
⊢
· Cryptorvm Dominvs · MAGISTER ARCANVM · Vox Primordialis ·
· Dominivm Cardo Gyratio Omnivm · Silence precedes the next force. Structure is sacred ·
⊢

Bitcoin Maintains Bearish MomentumFenzoFx—Bitcoin stayed bearish, trading around $113,500.0 in today’s session. During the Asian hours, it swept liquidity above the previous day’s high and quickly dipped below $114,627.00.
The next buy-side liquidity zone lies at $111,903.00. The bearish outlook remains intact unless this level is swept.

BTC usdif its broke 110k it can go to 98k.
above 115k we can see to touch again 123k.
just make the same chart and lines on your chart.
you will get perfect resistance and support
whenever its comes on support lines buy
sell on resistance lines.
Stop loss under support lines
easy to understand
take action according these lines.
No need more signals
Keep is simple to understand the move.
Spot Trade only.

BTC 108-110K Vital area is TestingMorning folks,
Not many things to say for now, as major problem stands in fundamental area - US liquidity drought. S. Bessent grabs everything that he could and even more. He already finished RRP source totally and now US Treasury intends to put his hands in Banking Reserves. They still need ~ 350 Bln for their TGA Fed account and another 250Bln of net debt borrowing.
The major question whether BTC will able to hold this? So we do not want to take part in this adventure, especially with Jackson Hole meeting right around the corner.
We suggest to watch for market reaction on this support area and rely on clear patterns. If somehow this area will be broken, BTC could return back into 80-100K trading range. Many things will depend on close price of this week.
So, stay aside for now.

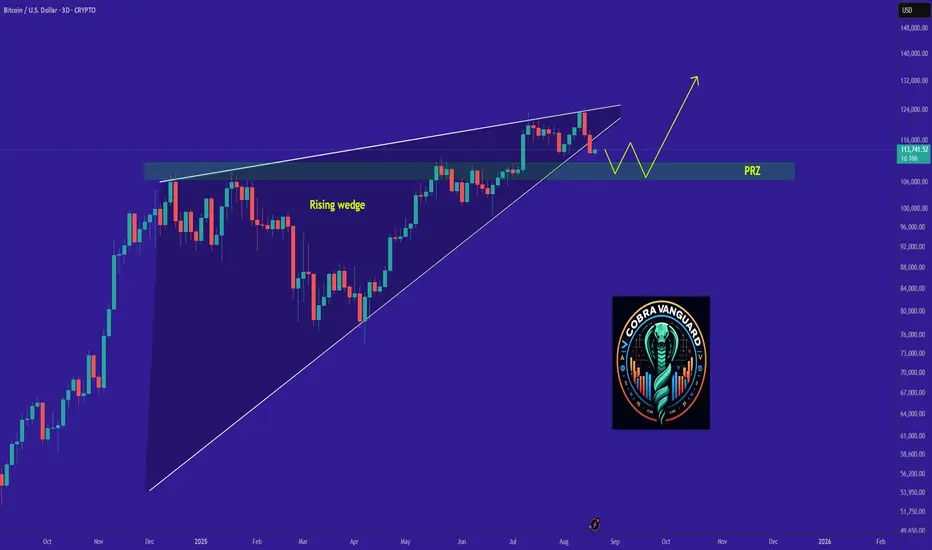
bitcoin's Situation, A Comprehensive Analysis !!!The price has broken the descending wedge and could now drop to 109K. It seems the PRZ (Potential Reversal Zone) is a stable range for Bitcoin.
Potential bearish reversal?The Bitcoin (BTC/USD) is rising towards the pivot which acts as a pullback resistance and could reverse to the 1st support, which is a multi swing low support.
Pivot: 116,456.65
1st Support: 112,346.982
1st Resistance: 118,969.64
Risk Warning:
Trading Forex and CFDs carries a high level of risk to your capital and you should only trade with money you can afford to lose. Trading Forex and CFDs may not be suitable for all investors, so please ensure that you fully understand the risks involved and seek independent advice if necessary.
Disclaimer:
The above opinions given constitute general market commentary, and do not constitute the opinion or advice of IC Markets or any form of personal or investment advice.
Any opinions, news, research, analyses, prices, other information, or links to third-party sites contained on this website are provided on an "as-is" basis, are intended only to be informative, is not an advice nor a recommendation, nor research, or a record of our trading prices, or an offer of, or solicitation for a transaction in any financial instrument and thus should not be treated as such. The information provided does not involve any specific investment objectives, financial situation and needs of any specific person who may receive it. Please be aware, that past performance is not a reliable indicator of future performance and/or results. Past Performance or Forward-looking scenarios based upon the reasonable beliefs of the third-party provider are not a guarantee of future performance. Actual results may differ materially from those anticipated in forward-looking or past performance statements. IC Markets makes no representation or warranty and assumes no liability as to the accuracy or completeness of the information provided, nor any loss arising from any investment based on a recommendation, forecast or any information supplied by any third-party.

SELL BTCUSD for bullish divergence trend reversal STOP LOSS: 118SELL BTCUSD for bullish divergence trend reversal STOP LOSS: 118,068
Regular Bearish Divergence
In case of Regular Bearish Divergence:
* The Indicator shows Lower Highs
* Actual Market Price shows Higher Highs
We can see a strong divergence on the MACD already and There is a strong trend reversal on the daily time frame chart.....
The daily time frame is showing strength of trend reversal from this level resistance so we are looking for the trend reversal and correction push from here .....
TAKE PROFIT: take profit will be when the trend comes to an end, feel from to send me a direct DM if you have any question about take profit or anything
Remember to risk only what you are comfortable with........

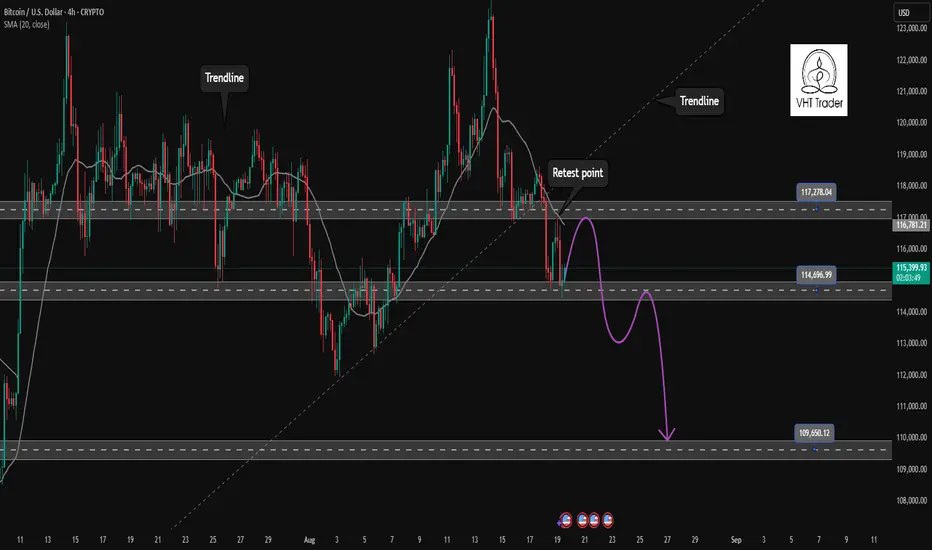
BTC Trendline Broken: 110k Support Is the Last Stand1. Recent Context
In my previous BTC analysis, I wrote that as long as the ascending trendline held, bulls had nothing to fear. But on Monday, that line was broken to the downside. After a few hesitations, I decided to close my long positions around 116k.
________________________________________
2. The Key Question
Can bulls defend 110–111k, or are we heading for a deeper correction?
________________________________________
3. Why the Chart Looks Weak Short-Term
• The trendline break changes the bullish structure.
• Bulls must defend 110–111k; if this zone cracks, the damage could be significant.
• To regain momentum, BTC must break back above 120k. Without that, upside looks limited.
________________________________________
4. Trading Plan
At this point, I’m out of the market.
• I won’t buy into 111k support even if a rebound is probable.
• Instead, I’ll treat that rebound as a chance to sell short at better prices.
• 120k zone is the ideal level for a short setup, both technically and from a risk/reward perspective.

Wait for confirmation and execute SELL BTCUSD signal✏️BTCUSD is trading in a narrow range of 117000 and 114500. It is quite difficult to have a trading strategy in this range. The best is to wait for the sellers to be strong enough to break 114500 to find SELL signals to a stronger support zone. Or wait for the buyers to react around the upper resistance zone of 117000. Because this is a breakout zone in the past with retests.
📉 Key Levels
SELL Rejection 117000
SELL DCA Trigger Break of Support Zone 114500
Target 110000
Leave your comments on the idea. I am happy to read your views.
Double Top & Inverse Bearish Exotic PatternUpdated to a potential double top pattern within an inverse exotic dragon pattern with short term potential targets.

Potential BITCOIN HUGE BEARISH PATTERN PRINTING OUT It certainly fits from my perspective. A nice overdue correction that fits its approximate prior trough corrective range level. As above so below. In Nov 2022 the classical TA bottom pattern was an inverted head & shoulders.

Bitcoin – Still Tracking the Bearish ChannelBitcoin – Still Tracking the Bearish Channel
Bitcoin continues to respect the bearish outlook, with price retesting the 115,000 zone before extending lower. The descending channel remains firmly in play, and the next key target sits around the 110,000 level.
To reach this objective, BTC may establish another leg down within the Dow structure, moving in line with the descending trendline. However, traders should remain cautious: MACD is showing increasing volume and its moving averages are beginning to turn upward — early signs that could challenge the short-side momentum.
In trading, the dominant trend should always take priority. Counter-trend opportunities are best reserved for clear liquidity zones or when market psychology shifts at critical levels. Otherwise, trading with the prevailing direction offers more consistency and less risk.
For now, BTC’s strategy remains focused on the descending channel. Scalping opportunities may appear around 112,600 and 111,800 as price reacts to the trendlines. The medium-term short entered near 115,000 remains valid, with a target towards 110,000. This area will also serve as a potential accumulation zone, where traders can reassess whether to build long-term positions.
This is my current outlook for BTC. Stay patient, trade with structure, and let the market confirm your entries.
#BTCUSD #Bitcoin #CryptoAnalysis #TechnicalAnalysis #PriceAction #Trendline #DowTheory #MACD #CryptoTrading #SwingTrading

Bitcoin Moves Cautiously Below $118K📊 Market Overview:
Bitcoin is trading around $115,800, slightly lower as investors await the Jackson Hole Symposium, where the Fed may signal rate policy shifts. A stronger USD is adding short-term pressure on BTC.
📉 Technical Analysis:
• Key resistance: $118,500 – $119,000
• Next resistance: $120,000 – $121,500
• Nearest support: $115,000 – $114,500
• Stronger support: $112,500 – $113,000
• EMA: Price is still just below the EMA-09 → short-term bias remains corrective.
• Momentum: Lower volume, narrow candles → market in consolidation.
📌 Outlook:
Bitcoin is likely to consolidate between $115K – $118K, with a clear breakout above or below this range needed to define the next trend.
💡 Suggested Trading Strategy:
• SELL BTC/USD near $118,000
🎯 TP: $116,000
❌ SL: $119,500
• BUY BTC/USD near $115,000
🎯 TP: $117,000
❌ SL: $113,500

BTC # Bitcoin (BTC/USD) 1-hour price chart with key technical.The chart shared is a 1-hour Bitcoin (BTC/USD) price chart with key technical annotations. Here's a short note summarizing the analysis:
📉 Bitcoin Price Analysis – Short Note
Timeframe: 1-Hour
Structure:
Two accumulation/consolidation zones (blue boxes) are highlighted, each lasting ~54 bars (≈2 days 6 hours).
A rounded top pattern (curved gray line) suggests a distribution phase, followed by a sell-off.
Key Zones:
Resistance zone: ~118,500–119,000 USD (gray box at top)
Support zone: ~112,500–113,000 USD (gray box at bottom)
Fib Level: The green horizontal line (~0.5 level) indicates a key retracement zone.
Breakout: Price broke out of the descending structure (dashed line) and is now rallying (highlighted in red).
Projection: The red price path suggests a bullish reversal, possibly targeting the upper resistance zone.
thank you

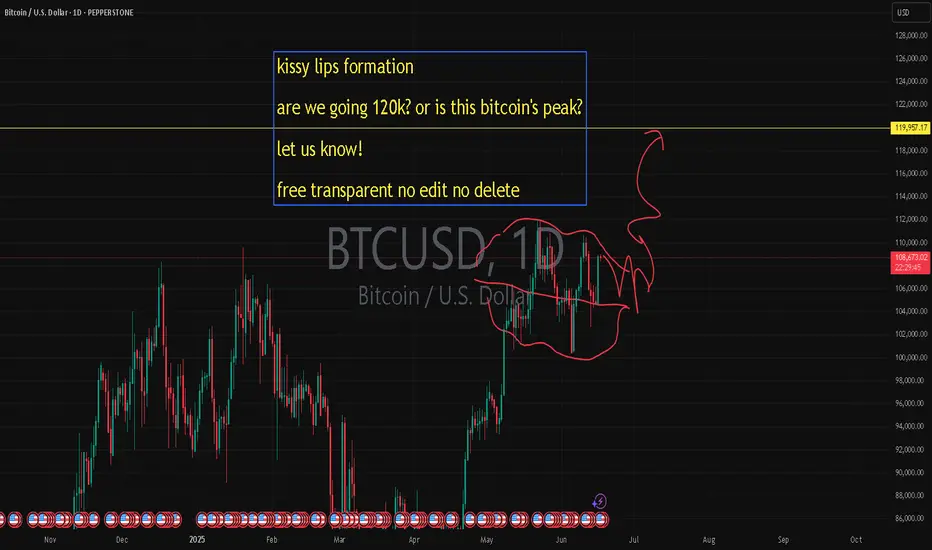
kissy lips formation are we going 120k? or is this btc's peak?kissy lips formation
are we going 120k? or is this bitcoin's peak?
let us know!
free transparent no edit no delete
🐉We value full transparency. All wins and fails fully publicized, zero edit, zero delete, zero fakes.🐉
🐉Check out our socials for some nice insights.🐉
information created and published doesn't constitute investment advice!
NOT financial advice