Bitcoin is painfully weakBitcoin ATH break at was the first sign of weakness, now relative strength index is at levels bitcoin hasn't been at since early 2023 - big difference in price $96k 3 years in a bull market vs $22k after the horrible painful 2022 bear market. I think 2026 will be bearish for bitcoin. Mid term elections will offer uncertainty and if you look at bitcoin's performance in 2025 under the "pro crypto" administration it has been painfully weak only up around 1% YTD. I think around $75k is a good area to watch. Full global economic meltdown like 2022 and Im looking at $48k region. COINBASE:BTCUSD
Trade ideas

Bitcoin at $94,000 — or lower?The Bitcoin drop is still continuing, and we need to see how far this decline goes.
Either way, as traders it doesn’t matter to us whether Bitcoin becomes **one dollar or one million dollars** — we’re not investors to be worried about long-term price.
Our job as traders is to follow our strategy, manage risk properly, and take the actions our system requires based on market behavior.

Bitcoin chart support pointsThe following areas are the end zones of wave 3 and wave 5 on Bitcoin charts.
2025 Bitcoin cycle over, prepare for 2029. Phase A — “Early Downtrend”
Nov 2025 → Apr 2026
Bitcoin drifts down from $100K–$95K
Enters $80Ks
Weekly momentum failing
Phase B — “Cycle Breakdown → Panic Flush”
Jun 2026 → Nov 2026
Macro liquidity tight
Miner stress increases
ETF inflows slow or briefly reverse
Price cascades into $60Ks and $50Ks
Monthly oscillators bottom out
You BUYS HERE: ($68–$55K)
This is your PRIME accumulation zone.
Rinse, repeat. This is how true Bitcoiners do it.
UP FOREVER: Bitcoin Doesn't Care About Your Opinion
@upforevermovie

BTCUSD forecastBTC Update — Watching Key Levels + Weekly POC Reaction for the previous weeks
Bitcoin is still trading inside a broader down-channel, and price continues to respect the lower trendline. We just tapped the low-range area again, showing sellers are still in control.
Both the daily and 15-minute charts show price sitting below the Point of Control (POC) from last week , meaning most of last week’s trading activity happened above us. Until we reclaim that area, momentum stays bearish.
On the 15-minute chart, price dipped into the low range and is now pulling back toward the mid-range / fair value gap . This is the zone I’m watching closely. If price can’t break above this area, we may see another move back toward the lows.
Things I’m watching:
1. Reclaiming last week’s POC → bullish shift if successful
2. Fair Value Gap / Mid-Range → potential rejection zone
3. Lower trendline → still acting as support inside the down-channel

History Repeats?Bitcoin tends to reach its macro cycle peak somewhere around 500–550 days after a halving.
After that peak, a major correction or “dump” usually follows.


My Bitcoin ScenarioWe should either hunt the low of 72k$ or find support on the volume cluster above before we can see some long momentum.
Both possible supports at 92k and 88k are weak supports so i don't think they have a lot of significance.

Bitcoin analysis during the Forex holiday.Even during the Forex market closure, Bitcoin continues to show weakness. Volume is lower than usual, but sellers are still in control, pushing the price downward.
Price has now reached a major and decisive support zone.
📌 If this support fails, the next potential target is around $85,000.
I’ll reassess the chart during the week and look for short-entry triggers if the breakdown confirms.
Stay cautious — this level is crucial.
#Pouyanfa 🚀📊

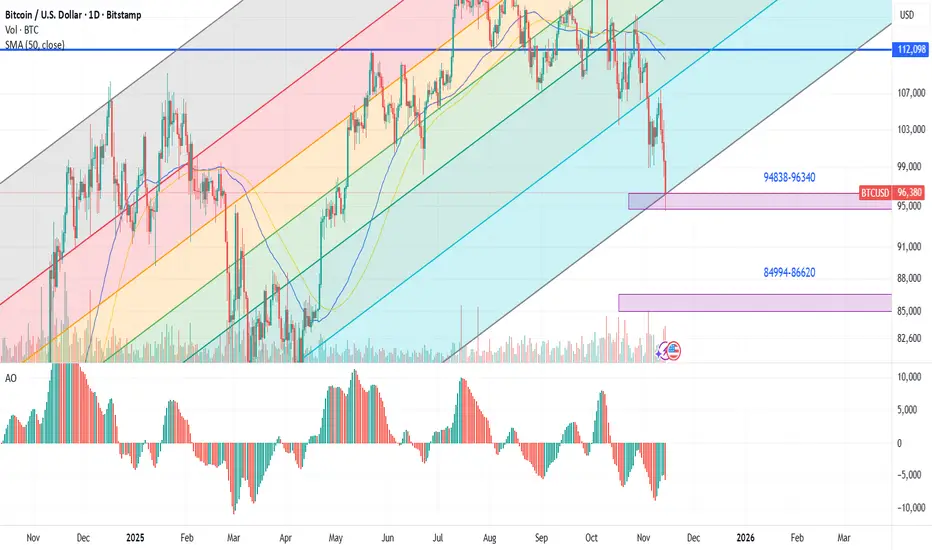
BTC DAILY OUTLOOKBased on the Andrews' Pitchfork applied to the BTC/USD daily chart, Bitcoin is in a clear uptrend channel. After a pullback to the lower boundary near 88.5k (testing support with a -36% correction), I expect a very boring consolidation for some days around 100k and 88k and then the bull target first will be 108.500k the median line and next targeting for bulls will be the upper channel at 142K.
Volume and liquidity suggest potential for a breakout if it holds above 96k.

BITCOIN - WILL the crash show or will the bulls hold strong if the crash happens/retracement phase we can see a 75 to 80% retracement busting the bitcoin bubble. one thing i do think we shouldnt be buying over 100k a share.
let it find a lower support.
final exit- the crash of bitcoin -20415.80
bitcoin has no value it only has value thru the hype
that we can sell it to someone else for more
as long as that hype last so will bitcoin. crypto will
and is the next digital currencies we will
use but it produces nothing it is just numbers. block chains
is where the money is. peep game. companies that use
block chains will have great growth. the cryptos is a different exposure always
remember that. you cant make more bitcoin. and it havles each cycle the last one
was 2024. so the bull run happens after each halving. we dont know
when but screen shot this for the future. we will not buy at 100k
we will wait for the retracement if anything we will not have fomo.
and the clues are in the charts

BTC possible short worst scenarioJust a possibility which can be seen with a special settings of EMA. Time was calculated with Fibo. Considering that fact that a lot of people are waiting 99-85k levels, it could be smart to touch lower levels.

#bitcoin short term log postion without Stoploss#btc #forex #etf #option #money #earning #dollars #bitcoin,#btc,#spy,#forex,#bitcoin,#supportlevel,#RESISTANCELEVEL,#TESLA,#S&P500,#NVDIA,#APPLE,#AMAZON,#NIFTY,#META,#RSI,#STOCKMARKET,#SHAREMARKET,#GOLD,#OIL,#SILVER,#INTRADAY,#SWINGTRADE,#LONGTERM,#INVESTMENT,#SELL,#BUY,#BID,#ASK,#MARKET,#INVESTORS,#IWM,#OPTION,#FUTURES,#US,#ALIBABA,#CASH,#CASHFLOW
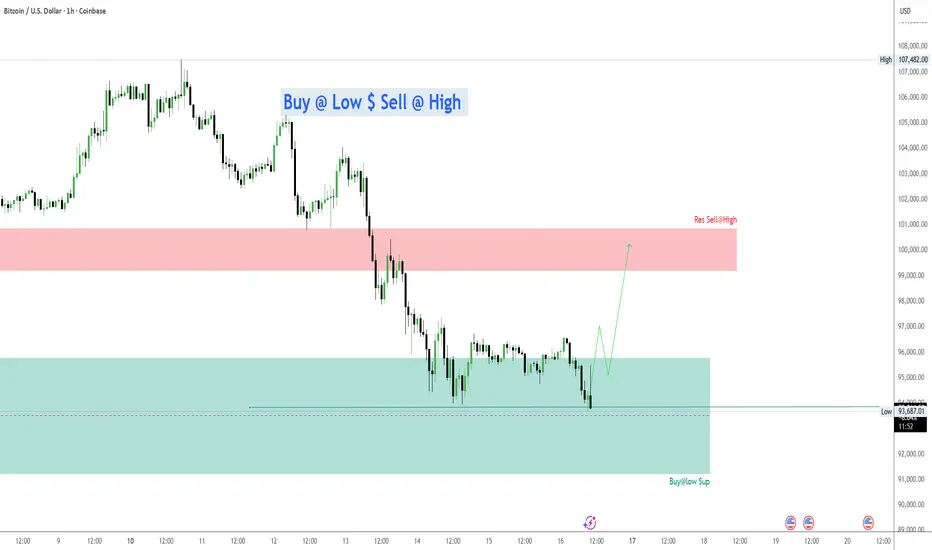
#BTC STILL IN #BUYlow Level #BTCUSD
Check my previous post where it started
#buylow #sellHigh
Simple trading strategy support & resistance
All trading methods will give only 49% or 51% - #money Management is the key
Your money management only decides your profit
#BTC #forex #supportortandresistance #tradinging #swingtradingstrategies #buy #sellll #EURUSD #goldd #niftyy #s&p #etf #qqq #iwm #future #options #longterm#buyy
low #sellHigh
Any trade money management is a tool to help you grow your portfolio.
Simple trading strategy support & resistance
All trading methods will give only 49% or 51% - #moneyManagement is the key
Your money management only decides your profit
#BTC #forex #supportortandresistance #tradinging #swingtradingstrategies #buy #sell #EURUSD #Gold #niftyy #s&p500 #etf #QQQ #IWM #future #options #longterm #XAUUSD #silver #USDCAD #btcusd
RetracementMarket is in a downtrend however we have a chance of a retracement before continuing moving down. looking to buy and then sell later at the supply zone.

How does $BTC reclaim $100KFor everyone asking how hard it would be for Bitcoin to reclaim $100K…
Here’s every 8%+ move this year.
Single-day pops. 3-day surges.
Spoiler: CRYPTOCAP:BTC does this all the time.

Bear Cycle Beginning(On the Daily Chart)
2-3 days ago, Bitcoin officially broke down and out below the upward channel it has been in for over 1050 days. It broke down from the channel, retested the bottom of it, and now is continuing downward to make a lower low today.
THAT IS BAD. Muy malo.
Sehr schlecht. Molto male.
The RSI is also confirming a break to the downside.
This time frames match with prior cycles.
Potential correlation to halving cycles is noted.
Note: The 2 year expansion and contraction cycles are exponential in growth while if you look at them is totality, the upward trend shows a logarithmic curvature when you connect the highs from the last 12 years.
IF,
This is a normal bear cycle pullback like the last few, we'll see 30k.
(Yellow Path)
We can't really know for sure, so it's silly to anticipate for this, but as an alternate case,
IF,
This is the end of the larger cycle, meaning the end of Act 1, where crypto doesn't bottom until it is announced dead in the newspapers, then just set a reminder in 5 years to check back unless you want to swing trade the thing with massive volatility.
(Red Path)

BITCOIN: Deadlines and CommitmentsPRIMARY LONG-TERM SELL SIGNAL PENDING: (upper panel)
According to my primary long-term trading signal, BITCOIN has a two week deadline to stage a rocket launch rally to negate a long-term SELL confirmation at the close of November trade.
EARLY RSI BUY SIGNAL for 2026? (lower panel)
My custom weekly RSI is rapidly heading toward the oversold 30 level. The good news going forward, insofar as this RSI is concerned, is that in the past, upon closing beneath 30 on a monthly basis, and then closing back above 30 in similar fashion, it has produced sustainable long-term rallies of significance.
WEEKLY MOMENTUM: (bottom panel)
Long-term momentum has moved into bearish territory with readings below zero. If the big cycle top is in with the November 126,272 print high, it is then likely that momentum will continue to test its lower bound before consolidating and registering some bullish momentum divergences as it did in the last move down to the 15,479 print low.
ELLIOTT WAVE COUNT:
Despite the growing possibility that the big cycle top is already in place, I am giving BITCOIN bulls the benefit of the doubt in labeling the current move down as that of a 4th wave of primary degree, with another move higher to fresh all time highs to mark the larger Cycle Degree 3 wave terminal.
In this most bullish case, it is essential that Bitcoin maintain trade above the 69,000 Cycle Degree wave 1 high. Any print beneath that level going forward, and it might be lights out for Bitcoin, at least in terms of Elliott Wave Tenets.
If you are sitting on substantial profits and do not want to see them wither away any further, it may be wise to get a lot smaller on any rallies going forward.

Bear Market Starting for BTC?Unless November turns around we are going to $55-65k levels... buy more during the dip and start scaling out at levels $120k- $155k-$190k( probably $200k peak).

Oil Wars and Their Impact on the World Trade Market1. The Strategic Importance of Oil
Oil is the most traded commodity in the world. It accounts for a large share of global trade value and is a key determinant of national security and economic strength. Countries that possess abundant oil reserves—like Saudi Arabia, Russia, the United States, and Iran—often wield considerable influence over the global market. Conversely, oil-importing nations, such as India, Japan, and many European countries, are highly dependent on global oil supply stability and pricing.
Oil prices directly affect inflation, transportation costs, and industrial production. Therefore, any disruption—be it due to war, sanctions, or political instability—ripples through the world economy, impacting global trade flows, currency exchange rates, and stock markets.
2. Historical Background of Oil Wars
The link between oil and conflict dates back to the early 20th century. During both World Wars, control over oil supplies was critical for military success. Germany’s lack of oil access in World War II, for example, significantly weakened its war machine.
Later, the Arab-Israeli conflicts and the 1973 Arab Oil Embargo marked the first major energy crisis in modern history. In retaliation for Western support of Israel, OPEC nations reduced oil production, causing prices to quadruple and triggering global economic turmoil. The incident demonstrated how oil could be used as a political weapon in international trade.
In the late 20th century, the Gulf Wars—especially the 1990–91 conflict following Iraq’s invasion of Kuwait—were driven largely by control over oil resources. These wars disrupted oil exports from the Middle East, affected maritime trade routes, and led to sharp volatility in global markets.
3. Modern Oil Wars: Geopolitical Rivalries and Economic Strategy
Today’s oil wars are less about open military invasion and more about economic and political control. Major powers engage in “energy diplomacy” and sanctions, using oil as leverage. For example:
United States vs. Iran: The U.S. has imposed sanctions on Iranian oil exports to limit Tehran’s revenue and geopolitical influence. This restricts global supply and often causes short-term oil price spikes.
Russia vs. the West: The 2022 Russia–Ukraine war triggered one of the largest energy crises in recent decades. Western sanctions on Russian oil and gas reshaped trade routes and forced Europe to diversify its energy imports.
Saudi Arabia vs. U.S. Shale Producers: In 2014–2016, Saudi Arabia intentionally increased oil production to lower global prices, aiming to drive out high-cost American shale producers from the market. This “price war” destabilized oil-exporting economies and caused massive losses in the energy sector.
These modern conflicts are fought through production levels, price manipulation, and supply chain disruption rather than traditional warfare. Yet their effects on world trade are equally powerful.
4. Impact on Global Oil Prices
Oil wars create volatility—the most visible effect on the world market. When supply is threatened, prices surge; when production rises excessively, prices collapse.
For instance:
The 2022 Russia–Ukraine war pushed Brent crude prices above $120 per barrel—the highest in a decade.
Conversely, during the COVID-19 pandemic in 2020, an oil price war between Russia and Saudi Arabia led to an oversupply. Prices crashed, even turning negative in U.S. futures markets for a brief period.
Price volatility affects not only oil-producing nations but also global consumers. Transportation, manufacturing, and agriculture—all dependent on energy—face rising costs, which can slow economic growth and trade activity.
5. Effects on the Global Trade Market
a. Inflation and Cost of Goods
Oil price fluctuations directly influence inflation. When oil becomes expensive, transportation and manufacturing costs rise, increasing prices for goods globally. This reduces consumer demand and can lead to trade imbalances between nations.
b. Trade Deficits and Surpluses
Oil-importing countries spend more foreign currency on imports when prices rise, worsening their trade deficits. Conversely, oil-exporting countries gain trade surpluses and stronger currencies. For example, high oil prices benefit nations like Saudi Arabia, Norway, and Russia, but hurt countries like India and Japan.
c. Currency Movements
Oil wars also affect foreign exchange markets. The U.S. dollar, traditionally the benchmark currency for oil trading (the “petrodollar”), strengthens during global crises, while currencies of oil-importing nations often weaken. In contrast, oil-exporting countries’ currencies appreciate when prices rise.
d. Supply Chain Disruptions
Many shipping lanes and chokepoints—like the Strait of Hormuz or the Suez Canal—are located in oil-rich, politically unstable regions. Conflicts here disrupt maritime trade, delay shipments, and raise insurance costs for global exporters.
6. The Role of OPEC and Non-OPEC Nations
The Organization of Petroleum Exporting Countries (OPEC), founded in 1960, remains central to global oil politics. Through coordinated production decisions, OPEC and its allies (collectively called OPEC+) attempt to stabilize prices and control supply. However, internal rivalries often lead to disputes and price wars.
Non-OPEC producers like the U.S. (via shale oil) and Russia challenge OPEC’s dominance, creating competitive dynamics that frequently spill into trade wars. Each side uses production adjustments and diplomatic alliances to secure their share of the global market.
7. Energy Transition and Future Oil Conflicts
As the world shifts toward renewable energy and climate-friendly policies, traditional oil producers face declining long-term demand. This transition could spark new forms of “energy wars,” as nations compete for dominance in emerging technologies like electric vehicles, hydrogen, and battery minerals.
For instance:
The U.S. and China are already in competition for control over rare earth elements used in clean energy systems.
Oil-exporting countries are diversifying their economies to reduce dependency, but instability could rise if revenues fall too quickly.
The future oil wars may thus be economic battles over energy influence rather than territorial control.
8. Global Economic Consequences
Oil wars have cascading effects across the global economy:
Stock Markets: Energy price volatility influences global indices. Rising oil prices often cause stock markets to decline due to higher business costs.
Commodity Prices: Oil affects other commodities like natural gas, metals, and agricultural goods, since energy is required for production and transport.
Investment Flows: Investors shift toward safer assets (like gold and U.S. Treasury bonds) during oil-related geopolitical tensions.
Developing Economies: Emerging markets reliant on oil imports suffer higher inflation, currency depreciation, and trade deficits during crises.
9. Case Studies: Notable Oil Conflicts
1973 Arab Oil Embargo: OPEC’s restriction on oil exports to the West quadrupled prices, leading to global recession and inflation.
1991 Gulf War: Iraq’s invasion of Kuwait disrupted oil supply and triggered U.S.-led military intervention, causing price surges.
2014–2016 Oil Price War: Saudi Arabia flooded the market to undercut U.S. shale, resulting in a 70% price drop.
2022 Russia–Ukraine War: Sanctions and supply restrictions reshaped the global energy trade, with Europe turning to U.S. and Middle Eastern suppliers.
10. Conclusion
Oil wars have always been more than just battles for resources—they are struggles for power, influence, and economic dominance. Every time an oil-producing nation faces conflict or sanctions, the repercussions are felt in trade balances, inflation rates, and financial markets worldwide. The volatility of oil prices remains one of the most significant risks to global economic stability.
As the world transitions toward renewable energy, new types of resource competition will emerge. But as long as oil remains the foundation of industrial energy, the geopolitics of oil will continue to shape the world trade market—deciding winners and losers in the global economic arena.

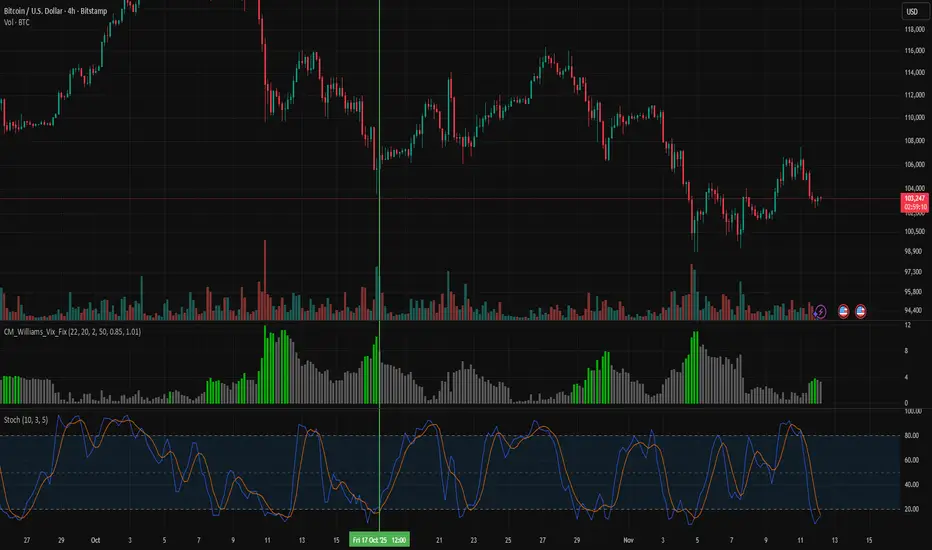
Williams VIX Fix · Predict Market BottomsThe Williams VIX Fix is a trading indicator that helps identify market bottoms by tracking volatility. When fear in the market spikes, the indicator flashes green, signaling a potential reversal.
Created by Chris Moody, this tool works across crypto, stocks, and forex. It’s most effective on higher timeframes like the 4-hour or daily chart. You can find it on TradingView by searching “cm Williams VIX Fix Finds Market Bottoms.”
Here’s how traders use it:
When the bars at the bottom of the chart rise sharply and turn green, it often means the market has overreacted on the downside. This setup has historically worked well for assets like Bitcoin BITSTAMP:BTCUSD , Tesla, and the S&P 500.
However, the indicator can sometimes give false or multiple signals. That’s why traders combine it with tools like the Stochastic Oscillator or Order Blocks for better accuracy.
For example:
When the VIX Fix flashes green and the Stochastic Oscillator is in the oversold zone crossing upward, it often marks a true bottom.
Or, when price touches an order block and the VIX Fix flashes green with a Stochastic confirmation, it’s a high-probability entry.
The indicator even has a modified version by Aaron Stone that highlights both market tops and bottoms, though traders say bottom signals remain more reliable.
In short, the Williams VIX Fix is a smart way to spot fear-driven market bottoms, but it’s best used with other confirmations.
TheCryptoFire
BTC long term chartIn my view BTC started bearish cycle last month targeting 55k area next year. From there I expect bullish trend will restart to target 134k area in next 3-years bullish cycle.
In the short term we could see a rebound from 90k area to test 108k strong resistance (about 0.5 fibonacci level)

Bear case if we close below 50 weekWhile I still want to remain a bull a close below the 50 week moving average around 103k atm would make me put the odds on this bear case. I can't find in the history of bitcoin a time we broke below the 50 week and did not go all the way down to the 200. We can see a clear 5 wave structure that has played out other counts possible but for this bear idea this one is very easy to see. The Fib retracement target of .618 if we get a fast correction sits right around the 200 week moving average so if we crash hard we could target buying back in at 55-65k area just something to keep in mind.
This is just 1 possible idea but history shows if we don't close this week over 103k were going down to the 200 week moving average (maybe this time is different?)

BTCUSD LongPrice is being rejected at the 4H FVG, A retracement into it after having London Lows cleared. I am targeting yesterday's (12/11/25) 9am 4Hr candle high.
