BITCOIN Correction Ahead! Buy!
Hello,Traders!
BITCOIN fell down sharply today, but the price is now hitting the horizontal demand level and we are already seeing some early rejection signs, so as the coin is oversold, a local bullish correction is to be expected. Time Frame 12H.
Buy!
Comment and subscribe to help us grow!
Check out other forecasts below too!
Disclosure: I am part of Trade Nation's Influencer program and receive a monthly fee for using their TradingView charts in my analysis.
Trade ideas

BTC WAIT FOR THE CRACK!After months of repeated warnings throughout the year about crypto's vulnerability, we’ve now arrived at a critical inflection point.
If Bitcoin breaks down here, it could trigger a waterfall decline — potentially into a bidless market.
This is a major level. What happens next could define the next phase for the entire crypto space.
Stay alert.
It's better to be out of the market wishing you were in than out of the market wishing you were out!
No one is forcing you to be in the market!
Click boost, like, and subscribe! Let's get to 5,000 followers! ))

The market mid term is showing bearish signs in my view.That's right The market mid term is showing bearish signs in my view.
1st it failed to rally the way it rallies when its in full bull, we don't see 5k 10k daily candles anymore, (that's because bitcoin is maturing (I heard that one before) and no the reason its because people is still bullish and greed is predominant.
2nd The resistance below 124k is strong, meaning lots of sales are happening potentially calling for a double top
3rd this brings me to the conclusion that demand is drying up and supply will soon dominate
Using this information I can easily deduct that BTC still has potential to break the resistance above but it will get sold at around 120-122k
Going down the support will be at around 108-110k
and worse case scenario is at 98-100k As in previous instances.

POTENTIAL BULLISH SHARK HARMONIC ON BTC/USDThere appears to be a potential bullish harmonic pattern forming on Bitcoin. The structure has all the components that could signal a possible market bottom before a blow-off top phase. Sentiment and confluences — including the 0.618 retracement level, suggesting a potential completion of Elliott Wave 2 — are aligning.
I’ve outlined my entry levels, stop losses, and take-profit targets for transparency. Wishing everyone good luck with their trades.

$BTCUSD AT $100k WHAT NEXT?BITSTAMP:BTCUSD trades at $100k psychological level. What’s the next potential move on this pair? Well… I’d expect more decline in price rise again! I anticipate bullish price Action to develop away from that zone

BITCOIN TRENDLINE SUPPORT WATCH IT The chart of bitcoin I am posting today to show That the support is about 98 k handle based on fib and trendline support . I hope it holds for some to use rallies to understand cycles of Liquidity have peaked and will see a drain for the markets into the next window refinancing for Gov debt .

BTCUSD – DAILY PROFESSIONAL ANALYSIS (04 NOV 2025)Prepared by: ElDoradoFx PREMIUM 3.0 Analyst Desk
⸻
🧭 1️⃣ Market Overview
Bitcoin has experienced a strong bearish continuation, breaking decisively below the key structural support at 108,200, confirming a shift in market sentiment. The break of structure (BOS) at 109,600 turned the mid-term bias bearish, with price now testing the psychological level at 100,000.
RSI is at 32 on the daily chart, showing near-oversold conditions, but momentum remains heavy to the downside. Unless bulls reclaim 101,000–102,000, sellers are likely to continue dominating toward 98,600–97,000.
⸻
📊 2️⃣ Technical Breakdown
🔻 Daily (D1)
• Price broke below the long-term ascending trendline from August.
• EMAs aligned for bearish continuation (20 < 50 < 200).
• RSI 32 → weak recovery potential but still room for downside liquidity sweep.
→ Interpretation: Bears fully in control until 102,000 is reclaimed.
🔻 1-Hour (H1)
• Descending channel intact; price rejected from supply zone 101,200–101,600.
• RSI hovering around 30–40; possible minor retracement before further drop.
• MACD still printing red histogram bars → bearish momentum active.
→ Interpretation: Look for short opportunities near resistance retests.
⚠️ 15M–5M (Intraday)
• Price formed a small double bottom near 99,550, showing temporary relief bounce.
• RSI rebounding, but no confirmation of reversal.
• EMA50 (H1) around 101,000 acting as dynamic resistance.
→ Interpretation: Possible short-term correction before continuation down.
⸻
📐 3️⃣ Fibonacci Analysis
Swing Range: 104,839 → 99,559
Level Price Observation
38.2% 101,455 Minor retracement zone
50.0% 102,200 Key confluence with EMA50
61.8% 102,950 Strong resistance zone for potential short re-entry
✅ Golden Zone: 101,455 – 102,950
This is the ideal sell re-entry area if price pulls back.
⸻
🎯 4️⃣ High-Probability Trade Scenarios
🔻 SELL SETUP (PRIMARY BIAS)
Scenario A – Golden Zone Retest
• Entry: 101,455–102,950 (Fibonacci + EMA confluence)
🎯 TP1 → 100,000 TP2 → 99,000 TP3 → 97,000
🛑 SL → Above 103,300
Scenario B – Continuation Breakout
• Trigger: Break & retest below 99,550
🎯 TP1 → 98,600 TP2 → 97,000 TP3 → 95,800
🛑 SL → Above 100,300
⸻
🟢 BUY SETUP (ALTERNATIVE SCENARIO)
Scenario A – Support Reversal Zone
• Entry: 99,550–98,600 (if strong bullish reaction with engulfing candles)
🎯 TP1 → 101,000 TP2 → 102,000 TP3 → 103,000
🛑 SL → Below 98,200
⸻
🕐 5️⃣ Fundamental Watch
• US yields rising and DXY strengthening above 105.2 → bearish pressure on BTC.
• Market sentiment risk-off due to global equity weakness.
• Watch upcoming US Unemployment & CPI data — could trigger volatility reversal.
⸻
⚙️ 6️⃣ Key Technical Levels
Type Levels
Resistance 101,455 / 102,200 / 102,950
Support 99,550 / 98,600 / 97,000
Golden Zone 101,455 – 102,950
Breakout Confirmation Below 99,550 or Above 103,000
⸻
🧾 7️⃣ Analyst Summary
BTC confirmed a bearish structure, with short-term retracements expected toward the Golden Zone (101,455–102,950) before further downside continuation. Momentum indicators still favor sellers, though oversold readings could create minor pullbacks. Until 103,000 is broken to the upside, bias remains bearish.
⸻
📈 8️⃣ Final Bias Summary
🔻 Bearish below 102,000 → Targets 99,000 / 97,000 / 95,800
🟢 Bullish only above 103,000 → Targets 104,800 / 106,000
⸻
— ElDoradoFx PREMIUM 3.0 Team 🚀

Bitcoin Bear market I would say BEGUN The chart posted is the work I have posted and take notice of the MATH . Cycles are negative into My OCT 10 th /20th and all abc rallies can be used to exit if you have not I was clear at 123 k last chance best of trades Wavetimer

Bitcoin (BTC) at a Critical Crossroad: Technical BreakdownCRYPTOCAP:BTC is currently testing a pivotal support level that will determine its intermediate-term trajectory.
The Technical Setup:
· Price is approaching a decisive test of its intermediate-term ascending trendline support.
· The $96,000 zone acts as the key structural foundation for the recent bullish trend.
The Potential Scenario:
A confirmed breakdown below$96,000** would signify a break in the bullish market structure. This could initiate a deeper corrective phase, with the next significant support confluence located around the **$78,000 level. A sustained move below $78,000 would likely shift the broader market sentiment to bearish.
Key Implication:
The market's reaction around the$96,000 level is critical. Traders and investors should monitor this zone closely, as its failure could open the path for a substantial correction.
This analysis is based on classical technical principles and is for informational purposes only. It is not financial advice.
#Bitcoin #BTC #Crypto #TechnicalAnalysis #Trading #MarketAnalysis #Finance #RiskManagement

Bitcoin Short IdeaBTC approaches key resistance - watching for rejection and potential strong short move.
BTC is testing a strong resistance zone between $114,000 – $115,800, where selling pressure has previously dominated.
After a sharp rally, the price has entered a potential distribution area, hinting at a possible slowdown in bullish momentum.
🎯 Entry zone: $114,000 – $115,800
❌ Stop-loss: 4H candle close above $116,400
✅ Take profit: To be determined — better to monitor dynamically as the move develops.
The setup suggests a possible strong downside move if sellers take control. Be prepared for volatility — this one could unfold fast.
⚠️ Disclaimer: This is not financial advice. The idea is shared for educational and analytical purposes only. Position size should not exceed 2% of your total deposit. Always manage your risk and trade responsibly.

Possible Bullish ScenarioOn the macro level, 98k-ish area is the next level of support. I wouldn't be surprised to see that support level hit within this megaphone forming. There is confluence with the macro support level, support line of the megaphone and retesting of the fib level (blue line.) I wouldn't be surprised to see that area visited followed by a strong move to the upside.

Bullrun is over. The BTC bullrun is over. The cycle top is in.
Some altcoins will outperform BTC now, but BTC is done.
One last bulltrap. Dont fall for it.
Buy in late 2026.

BTC - BUY1. Trend Bullish - Sereis of HHs and HLs
2. Retracement of Fib 50% completed and wait for good entry around 61.8% where price will be 94,308
3. Bullish Trend Line will also intact.
4. At 94,308 there will be C point will also act as confluence for the ABCD chart Pattern

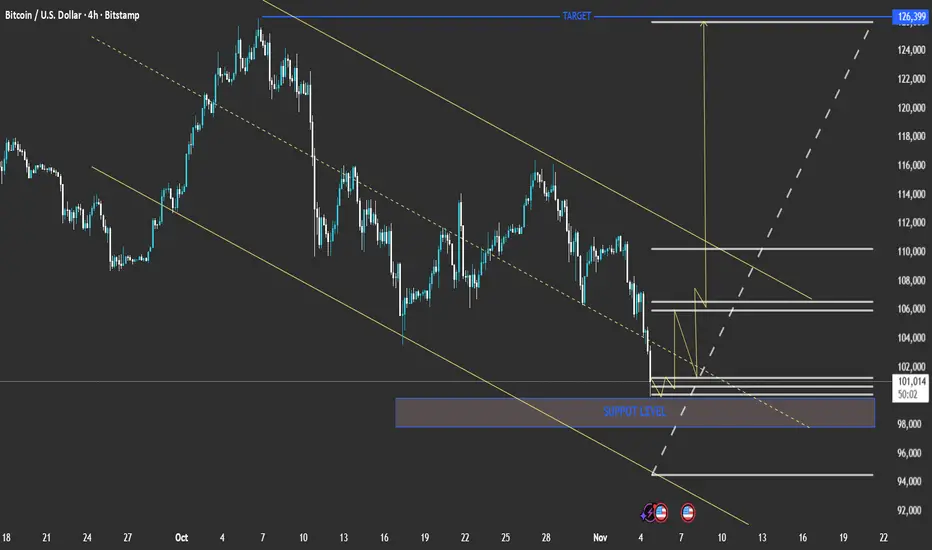
technical analysis of your Bitcoin (BTC/USD) 4-hour chartPair: BTC/USD
Timeframe: 4H
Current Price: ≈ 101,240
Trend: Downtrend within a descending channel
Main Zones:
Support Level: 98,000 – 100,000
Short-Term Resistance: 104,000 – 106,000
Major Target (Upside): 126,399
📉 Technical Outlook
Bitcoin continues to respect the descending channel drawn with parallel trendlines.
The price is now hovering near the lower boundary of the channel, close to the support level zone.
A potential bullish reversal may occur if this support holds, leading to a push toward mid-channel resistance (around 106,000).
📈 Bullish Scenario
If the support at 98,000–100,000 holds:
BTC could rebound toward 104,000 → 106,000 → 110,000.
A confirmed breakout above 110,000 may trigger a strong rally toward the main target of 126,399.
📉 Bearish Scenario
If BTC breaks below 98,000:
Expect further downside to 94,000 – 92,000, the next major demand zone.
This would confirm continuation of the descending channel trend.
⚙️ Summary
Aspect Bias
Trend Bearish (short term)
Key Support 98,000 – 100,000
Key Resistance 106,000 – 110,000
Long-Term Target 126,399 (if breakout occurs)
Short-Term Risk Break below 98,000 FPMARKETS:BTCUSD FPMARKETS:XLMUSD FPMARKETS:SOLUSD FPMARKETS:ETHUSD FPMARKETS:RPLUSD FPMARKETS:DOGUSD FPMARKETS:LTCUSD FPMARKETS:LNKUSD FPMARKETS:ADAUSD FPMARKETS:EOSUSD FPMARKETS:EOSUSD
Not Rocket Science, but we are RetracingNot rocket science, but we are still within the channel and most likely looking to retrace down to $95k first. This channel has been holding for a while.
#BTC CRYPTOCAP:BTC BYBIT:BTCUSDT.P
BTCUSD 1D - Pause Before the Next Leg Down?On the 4H chart, Bitcoin is retesting a critical resistance area - the 111K–113K sell zone, where a descending trendline, prior support-turned-resistance, and local volume cluster converge. This confluence makes the current level a potential short-entry area.
After failing to sustain above 115K, BTC entered a corrective phase. The recent bounce looks like a retest of the broken structure, and unless bulls reclaim 113K+, the bias remains bearish with a target near 100K–101K, a key liquidity zone.
Technically, momentum is fading:
– Bearish RSI divergence at recent highs;
– Volume contraction on rallies, expansion on drops;
– Price structure forming a likely ABC correction, with wave C projection toward 100K.
Fundamentally , near-term pressure persists as traders take profits and global risk sentiment cools ahead of potential Fed guidance. However, the macro bull case remains intact - hashrate at all-time highs, growing institutional adoption, and supply tightening continue to underpin long-term support.
Tactical plan: short entries near 111K–113K, targets 100K–101K. Invalidation above 113.5K.
Even in a bull market, gravity never takes a holiday.

bitcoinbitcoin at its weekly ema support level .i think we can go long from here with the stoploss of 5% that is 95000$ approx.and the target will be the new all time high which can come within 5-6 months..finger crossed lets see

BTCUSD.P Overall Weekly Trend: The most recent weekly analysis points towards a correction or consolidation phase following a significant prior move. Many technical ratings for the 1-week timeframe show a Sell signal.

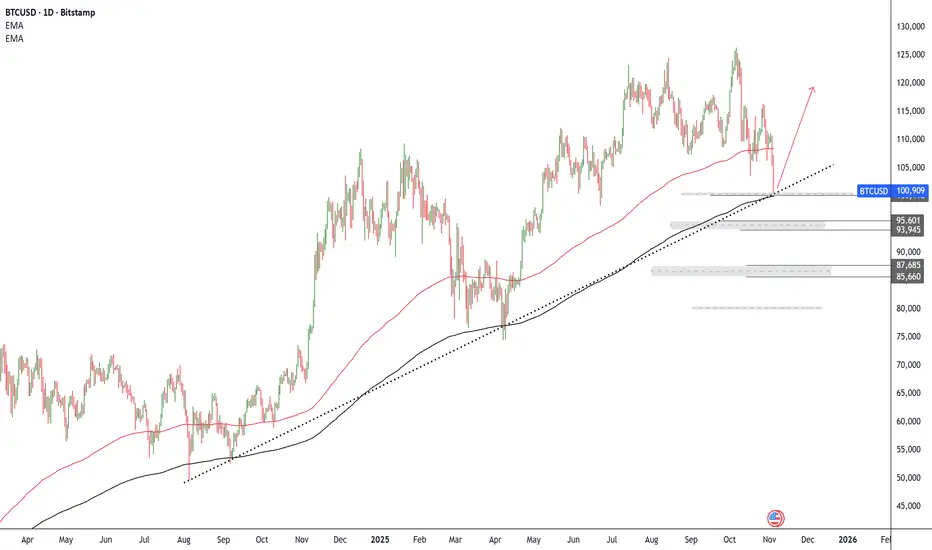
Bitcoin Correction Nears Completion as Price Tests Key SupportBitcoin is undergoing a downward correction against its broader medium-term uptrend, with the latest corrective wave — which pushed the price down toward 101,043 — nearing its end. This level aligns with both the ascending trendline and the 365-day moving average, reinforcing the likelihood of a bullish rebound from this area.
If the price manages to hold above this level, a new upward wave is expected to emerge, initially targeting the 108,000 zone, followed by 115,000 as the second objective. However, if the price breaks below the current trendline, a bearish scenario may unfold toward the demand zone between 95,600 and 93,900, which represents the next key support area.
The positive outlook remains valid as long as the price stays above the black moving average, while a sustained daily close below it could lead to a deeper correction toward 87,600–85,600.
Overall, the most likely expectation is a bullish rebound from current support levels, unless a clear break occurs below the main ascending trendline.
$BTC Correction Update: Last Leg of The Correction! - 11/4/2025CRYPTOCAP:BTC Correction Update:
Wave Z—the final leg of the structure—is typically fast-paced.
Target zones:
• Equal to Wave W → $100,275
• 161.8% extension of Wave W → $93,936
The chart outlines how the correction evolved and the patterns selected to complete it.
#BTC

Is BTC bear market started?BITSTAMP:BTCUSD is declining the $109.000 range.
Based on indicator, and price action i believe price will hit $89.500 soon enough.
It will be like 2021 January drop sort of thing ay, but if BTC is dropping will the alts go up instead? let's see where things got started after this dip.
But if i'm wrong with this ideas, then BTC probably will skyrocket like in COVID. Cuz that means there is something to do with the inside of the world, not the charts.
See you later.
Trade safely.

“When the Wolf Howls… Bitcoin Bleeds Below 100K”The pack runs blind, chasing numbers above 112K.
But the lone Alpha sees deeper in the shadows…
The real battlefield waits below 100K.
Only there the true decision will be carved — whether the beast revives, or falls into silence.
For now, the path is clear:
⚡️ The correction continues.
⚡️ The descent is not over.
⚡️ Positioning belongs to the hunters, not the herd.
Three paths lie ahead, marked by the arrows of fate.
But until the U.S. data strikes the ground…
Only one path deserves respect:
👉 The drop beneath 100K.
#Bitcoin #BTC #Crypto #TradingView #AlphaSigmaWolf #BearMarket #CryptoAnalysis #BTC100K #CryptoTrading #MarketCorrection #TechnicalAnalysis #BTCUSD #CryptoWolf #GothicTrading #CryptoSignals
