$BTCUSD: possible support areaBITSTAMP:BTCUSD : I'm considering three scenarios from the least bearish to the most bearish
1). This correction is Wave 4 of a diagonal and places are channeling. We're very close to the lower channel line. I put a 4? to indicate this scenario.
2). BTC has completed a 5-wave leading diagonal. This is marked by the yellow 1-2-3-4-5. BTC is now retracing this 5-wave sequence that started in Sept 2024. Support Zone would then be in the $87K-$74K zone.
3). BTC has completed a 5-wave ending diagonal. BTC is retracing the 5-wave sequence that started from the bear market low. In this case, it can go to $70K-$50K.
Trade ideas

btcIn order to touch the orange lines, he must first break the red box. If he cannot, lower numbers will become available. We are approaching an important date.

SHORT trend to 91kthe same scenario like yesterday, touched already the stong resistance and now to 91k


BTCUSD – 1D FVG Retest Completed | BTC is showing classic bearish continuation structure after failing to reclaim the 1D Fair Value Gap (FVG) and rejecting cleanly from the imbalance zone.
Price is now sitting just above the key support around $92,825, and this level is acting as the final line before a larger macro sell-off begins.
📌 Key Points From the Chart
1️⃣ 1D FVG Rejection (Primary Bearish Signal)
Price tapped directly into the purple 1D FVG, showing a wick-to-wick mitigation.
The rejection from this area confirms:
✔️ Smart Money filling inefficiency
✔️ No bullish displacement
✔️ Supply still in full control
This is a textbook continuation pattern in a downtrend.
2️⃣ $92,825 – Last Support Before Breakdown
This level has been tested multiple times, making it both:
➡️ Major psychological level
➡️ Short-term liquidity pool
If price holds below this zone → bearish momentum accelerates.
3️⃣ Liquidity Sweeps Expected Before Breakdown
The projected path shows:
A slight push up into local liquidity
Quick rejection
Break of structure
Continuation towards macro demand
This pattern often appears before strong dumps.
4️⃣ HTF Trend Still Bearish
Both structure and momentum indicate:
🔻 Lower highs
🔻 Lower lows
🔻 No bullish displacement
🔻 No HTF demand breakup
BTC remains in a distribution / markdown phase.
5️⃣ Next Macro Target → $86,145
This is where:
✔️ HTF liquidity rests
✔️ Major demand zone sits
✔️ Previous inefficiency aligns
This level is extremely attractive for Smart Money.
📉 Summary
BTC remains bearish unless bulls break back above the 1D FVG.
Rejecting from imbalance + losing $92,825 = clear path towards $86,145.

In case we move deep below the 50MA possible scenario for the bear market, as per previous runs we are entering the bear market. it can take is until Q4 2026
bitcoin is cookeduhh seems like btc is cooked outside of some massive liquidity event. I've pitched two ideas - slow bear down, bottom around fall next year 40k max pain can be 26k. Or revist range low at 72k and bounce - liquidity evnent happens causing a flow into assets revisit ATH fall of next year blow off into new ath around 161k. Given there will be a few more rate cuts I think it will take something drastic to bring money back into the market at this time. idk lemme know ur thoughts.

BTC REVERSAL LEVELBTC moving towards major support zone the huge horizontal line draw. keep a track trader if it bounces from that level good, if it closed in monthly time frame below this than further down as the line drawn. cheers"

BTC its all in the chart. for what il looking for.
either the imbalance and bounce or the marked zone.
that's all

BTCUSD Price DropBTCUSD currently at .618. Are we expecting a bounce or continuation of price drop?
What are your thoughts?

BITCOIN (BTC/USD): Consolidates—Breakout or Breakdown Ahead?⚠️Bitcoin is currently consolidating following a significant bearish rally.
The price is coiling within a horizontal trading range on a 4-hour timeframe.
Based on the price's reaction to these boundaries, two potential scenarios are anticipated:
Bullish Scenario:
Should the price break and close above 104,640 on a 4-hour timeframe, a bullish trend continuation is expected.
The target for this scenario is 108,000.
Bearish Scenario:
Conversely, if the price drops and closes below 98,780 on the 4-hour timeframe, a bearish movement is anticipated.
The objective for this scenario is 96,000.
Given the current oversold market conditions, a bullish bias is held.
However, further observation is warranted to confirm the market's direction.
What are your expectations?

BRIEFING Week #46 : Make or BreakHere's your weekly update ! Brought to you each weekend with years of track-record history..
Don't forget to hit the like/follow button if you feel like this post deserves it ;)
That's the best way to support me and help pushing this content to other users.
Kindly,
Phil

BTCUSD Long: Breakout From Descending Channel Targets $108KHello traders! Bitcoin is showing a potential continuation of bullish momentum after breaking out of the descending channel, where sellers had previously maintained control over the market structure. During the prolonged downtrend, the price consistently made lower highs and lower lows, until forming a strong Pivot Point near the $100,500–$101,000 Demand Zone — an area that has historically triggered solid bullish reactions.
Currently, after a fake breakout below this demand zone, the price quickly recovered, signaling liquidity sweeps and seller exhaustion. Since then, BTCUSD has rebounded strongly, confirming a structural shift from bearish to bullish control. The pair has now broken above the channel resistance, establishing a short-term bullish bias supported by steady higher lows. At the moment, Bitcoin is approaching the $107,500–$108,000 Supply Zone, which coincides with previous market consolidation and marks a potential reaction area where sellers might temporarily slow down the move. A clean breakout and close above $108,000 would open the door for a further rally toward the $111,000 Supply 2 Zone, reinforcing the medium-term bullish structure.
I expect the $104,500–$105,000 area to act as immediate support and a key retest level, allowing buyers to maintain momentum and target $108,000. Holding above this zone maintains the bullish scenario, while a confirmed break below it could trigger a pullback to the previous demand level before a new rally develops. Manage your risk!

BTCUSD – bullish PO3 in play at macro POCBTC put in a new ATH around $125–126k in October and has since sold off to about $95.6k, a drawdown of roughly 24%.
Historically, Bitcoin bull markets regularly see 20–35% pullbacks on the way to their peaks, so this correction is still inside a “normal” mid-cycle range rather than an outlier.
On the 1D chart we’ve got a clear range distribution at the highs (Wyckoff-style) followed by a sharp move down into a manipulation box around $93–96k. That zone is now loaded with confluence support:
Macro FRVP POC ~96,215 from the previous macro range – the price where the most volume traded, often acting as a strong S/R pivot.
FRVP from the Aug-2024 low shows a major high-volume node in the 92–95k band, reinforcing this area as a fair-value region rather than thin air.
The 2-Day 200 EMA is rising into the same area, adding dynamic trend support from a higher timeframe.
Just above sits the Bull Market Support Band (20-week SMA + 21-week EMA), which has historically been where 30–40% pullbacks found support in prior bull markets before new all-time highs.
PO3 upside thesis
Phase 1 – Range: distribution at 120–125k (yellow box).
Phase 2 – Manipulation: stop-hunt below range into the $93–96k confluence (macro POC + FRVP + 2D 200EMA + BMSB underside).
Phase 3 – Expansion: if price holds above $93k (no 3 daily closes below) and reclaims the BMSB / local down-trend, the setup targets a new expansion leg back into $130–140k+, in line with external bullish scenarios that still frame this as a mid-cycle correction rather than a completed top.
Invalidation / bear path
Breakdown: 3 consecutive daily closes below $93k would signal loss of the current manipulation range.
That opens $85k as the next major demand area; failure there brings the $74–75k HL pivot back into play as a full cycle-risk support and likely further bear market momentum.

In 2026 Bitcoin should trade to the $60k-$80k RegionOn October 23rd, I published an update on Bitcoin titled “Is Bitcoin About to Shed Its 6-Figure Price Tag?” … and that post certainly struck a nerve.
A number of Bitcoin defenders were quick to tell me I was wrong. As it turned out, those same voices had to face the public reality that their conviction was misplaced, and my analysis proved correct in the short term.
To be clear, I remain agnostic when it comes to Bitcoin’s investment merits. My focus is purely on the wave structure, counting 5’s and 3’s nothing more. I cover most tier-1 cryptocurrencies, and while I remain bullish on Bitcoin over the long term, I continue to expect further downside in the intermediate term once a minor B-wave retracement higher completes.
Ultimately, my analysis continues to suggest a bottoming region between $60,000 and $80,000 sometime in 2026, from which Bitcoin can begin a primary-degree rally. Until that region is reached, Bitcoin may be best viewed as a vehicle for shorter-term trades of minor degree, rather than a sustained long-term hold.

$103,000 Support is Your Next Long Entry!The chart shows a Bearish Harmonic Pattern (D point completed near $107,000), indicating the recent bullish momentum needs a rest.
We anticipate a short-term pullback following the completion of this pattern.
The target for this drop is the key support area (green box) around $103,000 - $103,500.
OBV also shows Bearish Divergence (price up, indicator down), which strongly supports the idea of a temporary pullback.
Wait for the price to hit the $103,000 support zone.
Look to enter a LONG trade from the $103,000 - $103,500 area for the next major leg up. This is the main opportunity!
Good Luck!

Is it safe to go long on Bitcoin?Macro Game: Expectation of Rate Cut Reaches Bottom + Dollar Under Pressure Provides Elasticity
Although there is an increasing divergence within the Federal Reserve regarding the rate cut in December, the probability of a rate cut has dropped to a neutral range of 55%, and the market has fully absorbed the hawkish expectations. There is limited further negative space. The government shutdown has led to the absence of economic data, and in addition, the release of loose expectations by White House officials. If the subsequent employment or inflation data are not in line with expectations, the probability of a rate cut is expected to quickly rise, providing impetus for the valuation repair of risky assets. At the same time, the US dollar index has entered an adjustment cycle after its previous strength, and the "depreciation trade" trend strengthens the attractive appeal of Bitcoin's hedging attribute, forming a risk asset resonance with gold as a safe-haven asset.
Bitcoin trading strategy
buy:98500-99500
tp:101500-102500
sl:97500

Building a Trading System: From Idea to ExecutionEvery trader starts with an idea — a setup, a pattern, a theory that seems to work.
But until that idea becomes a structured system, it’s just intuition.
A trading system gives your ideas rules, logic, and repeatability.
That’s the difference between a trader who hopes, and a trader who executes.
Define the Core Idea
Every system begins with an observation.
Maybe you notice breakouts after volume spikes, or reversals after RSI divergence.
Whatever the logic, write it down.
A system has to be specific, if you can’t define it clearly, you can’t test it.
Set Your Entry and Exit Rules
Your system should answer three things precisely:
When to enter a trade
When to exit a trade
How much to risk
Ambiguity is the enemy.
Rules make your strategy repeatable, testable, and objective.
Backtest the Logic
Before going live, test your rules on past data.
You’re not looking for perfection, you’re looking for consistency.
If your logic survives bull, bear, and sideways markets, it’s valid.
Track win rate, drawdown, and profit factor — they’ll tell you what’s working.
Execute With Discipline
A system only works if you do.
Follow the rules exactly as tested, even when it feels uncomfortable.
Consistency turns probability into profit — emotions destroy both.
Application
Here we have a very good example from our trading signals where we executed one of our strategies for 10 days. The strategy was designed with detailed inputs, logic and executed with a precise setup in a trading bot.
Refine and Evolve
Once live, keep notes.
Track how the system performs under real conditions.
Make small, measured improvements based on data, not emotion.
A system should evolve, not change its identity.
Redefining and tuning is a part of the process, there is no strategy that lasts forever, everything needs to evolve and adjust!

BTC target End of yearBased on weekly chart and recent macro the market is still bullish
If no big fundamentals happen this is where we should end till end of the year
There are 2 possible outcomes:
1. (blue case) the pressure of whales selling will keep the price within 120 000 range
2. (the red case) there will be breakout above 125 000 and we end somewhere in middle of the bull channel around 160 000

$BTCUSD: cycle has not topped --that's my bottomline.Orange resistance line: BTC attempted to break it three times. After the third rejection, it dropped to the blue support line, which served as resistance in March-April 2025. White and blue confluence of support lines-- until this breaks, the trend is still up and the cycle has not topped.
April 2025 low retraced slightly more than 50% of the move from 9/24-1/2025 and reversed. Present low retraced slightly more than 50% of the move from 4/2025 to 7/2025. These are all typical retracements in an uptrend.
I'm holding my long positions.

BTC @ 61.8 an exact retracement!!! LG!!!!!!!If this holds it will be a PERFECT textbook bounce to the stratosphere!!! Sit back, grab your popcorn and HODL!!!!

BTC UpdateIt bounced when it hit oversold on RSI on the 3 hr chart and regained support which is bullish.
Unfortunately, it's not rallying past the half way point on RSI which is bearish, and it still hasn't tested the purple line below.
I tried to get into some IBIT calls before close for this bounce, but options premiums were really high, so I elected not to touch this. It need to go sideways for a few days before I can play options. Premiums will drop when the VIX does.

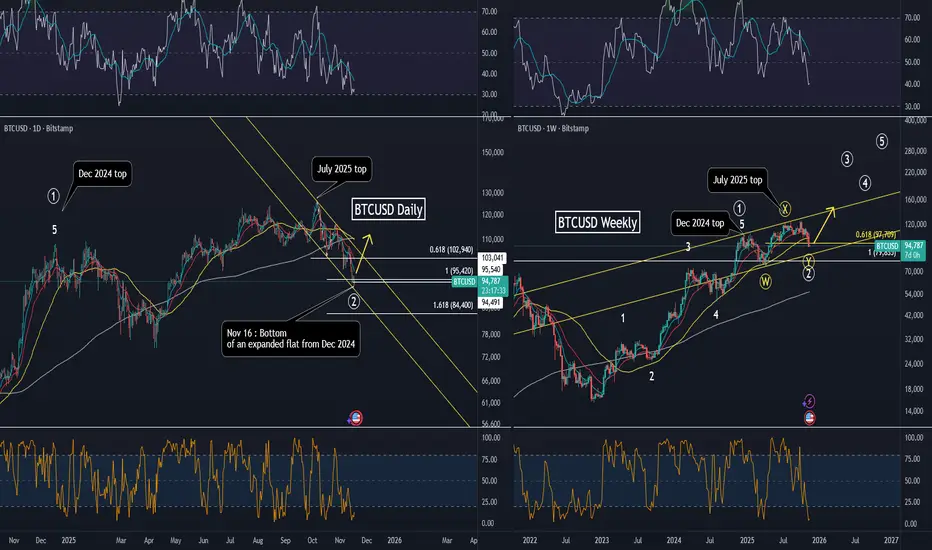
Bitcoin bottoms on Nov 17, rally to ATH here onwardsBITSTAMP:BTCUSD #Bitcoin (Nov 17): I make a call that #Bitcoin and #crypto bottomed today on Nov 17. As you see on the Weekly, Bitcoin has been doing a running flat (WXY) from Dec 2024 to correct the weekly cycle. the last leg ended at Fib 0.618.
Generational buying opportunity