Bitcoin Bottom?We have POTENTIAL bullish divergence with oversold RSI on the 6 and 12 hour charts. A close slightly lower will also give us divs on the 4-hour.
We also have potential divergence on the daily, although not quite oversold.
If we bounce after these closes and see a clear lower low on price and higher low on RSI, then the bottom is statistically very likely to be close.
Trade ideas

The buying momentum has returnedBitcoin has reached the broken support line on the weekly chart and is poised to rise. We bought based on several signals across different timeframes.

The Billy Big Balls MomentA trader reached out to me by direct message here on Trading View highlighting a challenge that many of us face from time to time. We’re talking about self sabotage. That moment you know what to do - but do something entirely different and get a result that frustrates the **** out of you.
Follow along, I hope this helps.
BUT FIRST
NOTE – This is a post on mindset and emotion. It’s not a trade idea or strategy designed to make you money. My intention is to help you preserve your capital, focus, and composure so you can trade your own system with calm and confidence.
Here's a scenario you might be familiar with...
You nail a sequence of trades.
Precision. Flow. Everything lines up.
And then something flips.
You start pushing harder, sizing up, breaking your own rules.
A few minutes later, you’re staring at a screen wondering,
“What the hell just happened?”
It’s not lack of discipline nor is it a technical problem.
You have an emotional pattern that hasn’t been mapped out yet.
This pattern has roots into your subconscious and it’s sabotaging your efforts.
WHATS REALLY HAPPENING AND WHERE DOES THE DRIVER REALLY COME FROM
When you start winning, your brain gets flooded with dopamine , the chemical of reward and anticipation.
If your nervous system has ever learned that success leads to loss, losing control, losing safety, losing connection it quietly associates “winning” with risk .
The mind says, “Let’s keep this going.” Deeper down though is the silent warning … “This isn’t safe.”
Doesn’t sound logical right? It’s not. It’s emotional. Deeply embedded in your psyche and activated whenever the mind feels that familiar feeling again.
The mind wants to go forward - the body wants to intervene. And so you get an internal split. A moment of pressure that your mind just has to resolve. And the fastest way the subconscious knows to relieve that pressure… is to end the win.
So you do something impulsive, not because you want to fail,
but because deep down, you're trying to protect yourself or believe or not, you might be even trying to punish yourself.
Weird stuff happens in the subconscious.
That’s why the sabotage happens right after a run of success.
It’s not logic breaking down.
It’s the mind trying to restore an emotional equilibrium.
HOW TO CATCH IT BEFORE IT HAPPENS
Listen. The moment you size up impulsively is not random.
It’s a repeatable signal that your emotional system has been triggered.
You can’t fix what you can’t see - so start tracking it.
1. Notice your signature cue.
For some, it’s tension in the chest or a fidgety feeling of restlessness.
For others, it’s the need to “just check one more chart.”
For you it might be something else. Pay attention and start to become aware of what comes up for you.
2. Map the pattern
Keep a short log : what happens right before you go rogue?
Notice the time of day, physical tension, thoughts.
You are looking for a repeatable sequence.
3. Identify your threshold
There’s always a tipping point where clarity narrows: your breath shortens, attention tunnels or you start fantasising about bigger gains.
That’s your signal.
4. Interrupt the pattern and create a recovery plan (as you notice the cues)
Physically step away from the desk.
Exhale through the mouth long, slow, 6 seconds.
Let your eyes rest on something still . This shifts the nervous system out of fight-or-flight and back into focus.
This isn’t about controlling emotion.
Its about expanding your capacity so emotion doesn't control you.
Next time you’re on a hot streak, notice where focus ends and thrill begins.
That’s the edge that makes or breaks the run.

Educational BTC Analysis: Decoding BTC's Wave (C) DownHello Friends, Welcome to RK_Chaarts.
Today we are going to understand Elliott Wave Teaching Points from the BTCUSD Daily Chart,
This chart sequence perfectly illustrates the difference between motive (impulse) and corrective waves, as well as the important structures and rules of a larger correction.
1. The Structure of a Corrective Pattern (A-B-C)The Big Picture: The overall movement, labeled Intermediate Wave (A), (B), and (C) (Blue), is a three-wave corrective pattern. This type of pattern moves against the trend of one larger degree (which have been an uptrend). The three-wave (A-B-C) structure is the classic way markets move in a counter-trend. Wave (A): The initial counter-trend move.Wave (B): A bounce or retracement that moves back in the direction of the previous trend, but fails to reach the start of Wave (A).Wave (C): The final, and often most powerful, leg of the correction, which is designed to complete the retracement. This wave is always structured as a five-wave impulse.
2. The Rule of Subdivisions: Corrective Waves are Internally Motive, Wave (C) is an Impulse: The report states that Intermediate Wave (C) is expected to unfold as a five-wave impulse sequence of a Minor Degree (Red) (Minor Wave 1, 2, 3, 4, 5).
Learning Point: This highlights a fundamental Elliott Wave rule: the C-wave of an A-B-C correction is a motive wave (it has a five-wave internal structure) because its purpose is to create strong directional progress and complete the larger correction. This is commonly known as a Zigzag correction (which has a 5-3-5 internal count for A-B-C).
3. Identifying the Strongest Move (Wave 3)
The Current Phase: The market is currently in Minor Wave 3 (Red) downwards.
Learning Point: In Elliott Wave theory, Wave 3 is typically the longest and never the shortest of the three motive waves (Waves 1, 3, and 5). This means the analysis anticipates the current move to be the most directional, high-momentum, and volatile part of the entire Intermediate Wave (C) correction. This is the "sweet spot" for trend traders.
4. The Principle of Alternation (Predicting Wave 4)
Upcoming Wave: The analysis projects a shallow Minor Wave 4 (Red) rebound.
Learning Point: While the chart doesn't show Wave 4 yet, this prediction is often guided by the Principle of Alternation. If the preceding corrective wave (Minor Wave 2) was a sharp, deep correction, the next corrective wave of the same degree (Minor Wave 4) is expected to be a sideways, shallow, or complex correction (like a flat or triangle). The prediction of a "shallow" wave 4 suggests Minor Wave 2 was likely a deeper, sharper retracement.
5. The Critical Invalidation Rule
The Invalidation Level: The report sets the critical invalidation price at 74,223, which represents the low or starting point of wave ((1)).
Learning Point: Wave ((2)) can never retrace more than 100% of Wave ((1)). By identifying a specific price level, we can assume that our study says price should not broke below that particular level, it provides traders with clear risk management parameters.
I. Current Wave Count Status
The analysis indicates that the previous upward corrective structure, designated as Intermediate Degree Wave (A) and Wave (B) (Blue), is complete. The market is now engaged in a significant downward movement within the larger Intermediate Degree Wave (C) (Blue).
This Intermediate Wave (C) is expected to unfold as a five-wave impulse sequence of a Minor Degree (Red) to the downside, fulfilling the final leg of the overall corrective cycle.
II. Detailed Downward Projection
The Minor Degree five-wave structure within Intermediate Wave (C) is currently positioned as follows:
Minor Wave 1 and Minor Wave 2 (Red): These waves are identified as complete.
Current Phase: The market is now unfolding Minor Wave 3 (Red) downwards, indicating the strongest portion of the bearish move is in progress.
Anticipated Completion: Following the completion of Minor Wave 3, the analysis projects a shallow Minor Wave 4 (Red) rebound, followed by the final impulse move, Minor Wave 5 (Red), to complete the entire Intermediate Wave (C) correction.
The ultimate completion of Intermediate Wave (C) will signal the end of the larger-degree correction (labeled as a corrective wave (2)).
III. Critical Invalidation Level
The integrity of this bearish wave count is contingent upon the price action respecting a critical support level.
Invalidation Price: 74,223
Significance: This price point represents the extreme low or starting point of wave ((1)), so Wave ((2)) correction Should not breach this level as per wave principles, if it makes lower low below 74,223 on the lower side, the current Elliott Wave analysis would be invalidated, requiring a revision of the entire wave structure and market outlook.
I am not Sebi registered analyst.
My studies are for educational purpose only.
Please Consult your financial advisor before trading or investing.
I am not responsible for any kinds of your profits and your losses.
Most investors treat trading as a hobby because they have a full-time job doing something else.
However, If you treat trading like a business, it will pay you like a business.
If you treat like a hobby, hobbies don't pay, they cost you...!
Hope this post is helpful to community
Thanks
RK💕
Disclaimer and Risk Warning.
The analysis and discussion provided on in.tradingview.com is intended for educational purposes only and should not be relied upon for trading decisions. RK_Chaarts is not an investment adviser and the information provided here should not be taken as professional investment advice. Before buying or selling any investments, securities, or precious metals, it is recommended that you conduct your own due diligence. RK_Chaarts does not share in your profits and will not take responsibility for any losses you may incur. So Please Consult your financial advisor before trading or investing.

BTC/USD Broadening Wedge Pattern, Chance to $129kThis analysis focuses on the BTC/USD pair in the Daily Timeframe. This trading idea suggests a potential Long Position (Buy) based primarily on the formation of the Broadening Wedge chart pattern (also known as the Megaphone Pattern).
Technical Analysis Based on Broadening Wedge Pattern: The chart shows the formation of a pattern characterized by Lower Lows (green arrows) and Lower Highs (red arrows) sloping downwards, but the distance between them is widening, not narrowing. This is a variant of the Broadening Wedge pattern that slopes down, often classified as a bearish continuation pattern or a highly aggressive bullish reversal pattern when the price nears the lower boundary. In this context, with the price bouncing off the lower boundary, the pattern is interpreted as a potential bullish reversal.
Entry: The Long signal is based on two scenarios: Taking a position when the price touches the dynamic support of the lower wedge boundary (seen around the $96,000 - $100,000 level), where the latest bounce is occurring.
Take Profit (TP): The profit target has been precisely set at $129,000. This level is a resistance projection formed by the extension of the broader Broadening Wedge's upper trendline, indicating a potential rise of 29.07% from the current price. This level also serves as a test point to determine whether the price can break through and continue the long-term bullish uptrend or will retest that resistance.
Timeframe: This analysis is based on the Daily chart. The movement towards the target is projected to take about 57 days (57 bars), with the estimated time of target achievement around December 31, 2025. This suggests that this trading idea falls into the Medium-Term Swing Trade category.
Stop Loss (SL): To limit risk, the Stop Loss (SL) should be placed below the lower boundary of the Broadening Wedge pattern, which is considered crucial support. A safe SL placement is around the psychological level of $90,000 - $85,000 to invalidate the entire bullish idea if the wedge pattern is definitively broken downwards, signaling a deeper continuation of the bearish trend.
The current interpretation is a potential bullish reversal from the lower boundary of the pattern. Further confirmation will come from price action that manages to create a Higher Low on the retest of the dynamic support area, and strong buying volume upon a breakout from the upper trendline, validating the $129,000 target as a realistic Take Profit.
** Disclaimer: This analysis is part of a trading plan and does not constitute investment advice. Always use strict risk management and consider the potential for loss in every trading decision.**

BTC, Correction finished?CRYPTOCAP:BTC Price continues in a shallow range, down 22% from the all-time high, but sentiment is nearing extreme fear.
This complex correction appears complete at the trend-line boundary, where I bought, but I am giving it room for one more push lower to complete 5 waves down for Y. If wave 2 ends here, wave 3 is expected to be powerful and fast.
Price is below the daily 200EMA, which will offer some resistance at a High Volume Node. For now, the trend is down, and so further downside is the higher probability.
📈 Daily RSI has not reached oversold like all the other ranges did and is still bearish with no divergences.
👉 Continued downside brings up the next High Volume Node at $92000
Safe trading

106K Then 94K BTCMorning folks,
So, our suggestions were not in vain. As usual on a ruins of H&S we've got the butterfly and 105K lows has been broken. BTC could drop more, but now it is technically oversold.
We suggest upside bounce, at least to 106K resistance area where we consider another short entry attempt. Downside potential targets are 94-96K and then 80K if situation turns on worst scenario. But we will know it only by November close.

BITCOIN (BTCUSD): Pullback From Key Support
Bitcoin is currently trading within a wide horizontal range on a daily.
We see a test of its support now.
There is a high chance that the price will bounce from that, following
a formation of a confirmed bullish imbalance candle.
Goal - 105170
❤️Please, support my work with like, thank you!❤️
I am part of Trade Nation's Influencer program and receive a monthly fee for using their TradingView charts in my analysis.

$BTCUSD AT $100k WHAT NEXT?BITSTAMP:BTCUSD trades at $100k psychological level. What’s the next potential move on this pair? Well… I’d expect more decline in price rise again! I anticipate bullish price Action to develop away from that zone

BTC/USD Selling breakdown consolidation breakdown📉 #BTCUSD Technical Outlook (4H Timeframe)
Bitcoin continues to trade within a descending channel, maintaining bearish momentum. The recent consolidation zone breakdown confirms a potential sell opportunity on retest.
🔹 Trade Setup:
Entry: $104,500 (on retest)
Pattern: Descending Channel
Bias: Bearish
🎯 Targets:
Support 1: $101,500
Support 2: $98,800
⚠️ Risk Management:
Use strict stop-loss above the retest zone. Manage position size carefully to protect capital.
💬 Like | 💡 Comment | 🔁 Share
#Bitcoin #BTC #Crypto #PriceAction #TechnicalAnalysis #BTCUSD

BTCUSD Buyers Take ControlBitcoin is entering a renewed bullish phase as market structure strengthens and buyer activity intensifies. After a prolonged consolidation period, price behavior reflects accumulation dynamics — a typical precursor to sustained upward expansion. The transition from neutral to bullish momentum suggests a shift in sentiment across both institutional and retail participants.
Liquidity flow analysis shows consistent buy-side dominance, with capital steadily rotating back into Bitcoin. Market depth has improved, and volume data confirms that large participants are increasing exposure. Each corrective move has been met with aggressive absorption, signaling strong conviction from buyers. This pattern typically precedes directional expansion as selling pressure weakens and liquidity concentrates near higher value zones.
Volatility has normalized, maintaining a balanced rhythm favorable for trend continuation. The steady climb in momentum indicators implies that Bitcoin is building the energy required for a breakout phase. With trading activity expanding in alignment with positive sentiment, the structure supports the idea of a controlled upward advance rather than an impulsive spike.
Investor behavior mirrors early-stage bull market psychology — patient accumulation, reduced panic selling, and growing optimism. This environment tends to generate sustained price appreciation as confidence fuels consistent capital inflow.
Overall, Bitcoin’s market conditions favor a continuation of the current upward trajectory. Stability, liquidity concentration, and persistent buyer strength suggest a medium-term bullish cycle is underway.

BTCUSDBITSTAMP:BTCUSD
My View on BTC/USD is that it will weaken over the next few months , this the downside traget heading toward the strong support level at the price 79k - 75k

Another Trading Bottom in BTC, bullish in near termThis note is for self as I am playing against the bearish crowd who are projecting 95k or below levels for BTC.
1. There is an intersection of long term and short term trend lines at 100k
2. On 4 hrs chart, there is an RSI divergence
3. I can count complete correction waves as per Elliot wave, next move is up.
Whether it will be a move to new ATH or a temp top before further correction is to be seen but time to be long for now.

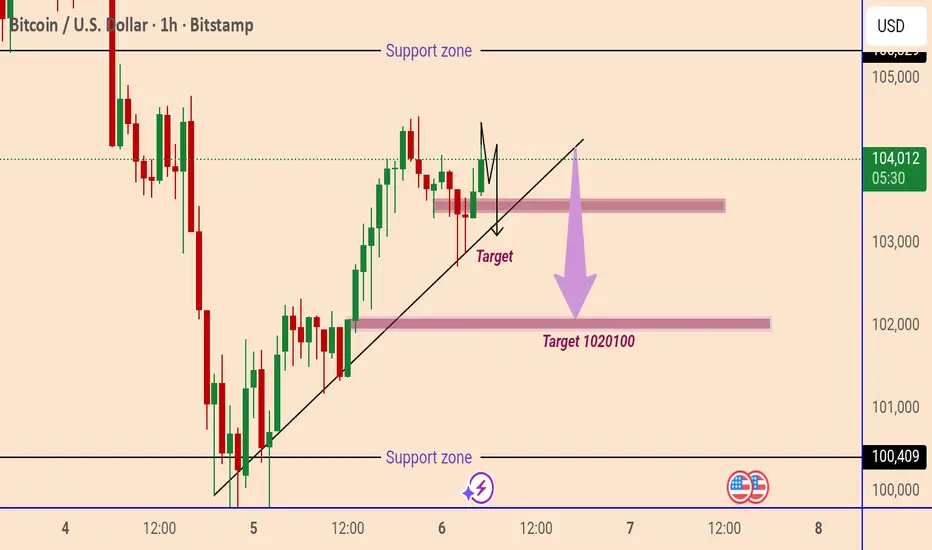
Bitcoin Trendline Breakdown SetupBitcoin (BTC/USD) is trading around $104,010, showing a mild bullish correction. However, the chart suggests a potential downward move if price breaks below the trendline support. The next targets are around $103,000 and $102,000–$102,100, with a major support zone near $100,400.
Bitcoin ($BTCUSD) Eyes Expansion as Liquidity Cycle Turn Risk-OnBitcoin ( BITSTAMP:BTCUSD ) surged above $106,000 this week, signaling renewed optimism as macro conditions hint at a liquidity-driven expansion phase. The crypto market is catching tailwinds from a wave of bullish catalysts, including the $2,000 U.S. stimulus rollout, the end of the government shutdown and a shift in Federal Reserve policy toward rate cuts after an extended period of tightening.
Quantitative tightening (QT) has officially ended, and Treasury liquidity injections are flooding markets with fresh capital, a backdrop that historically favors risk assets such as Bitcoin. Simultaneously, the long-awaited Clarity Act is expected to provide regulatory transparency for crypto assets, potentially unlocking institutional participation. With Altcoin ETFs reportedly in the pipeline following Bitcoin’s spot ETF success, the broader digital asset market is poised for a significant re-rating in valuation.
Technically, Bitcoin remains in a well-defined uptrend, respecting a long-term ascending trendline that dates back to mid-2024. Price has rebounded sharply from the $98K support area, aligning with the trendline that has held through multiple retests, and key weekly swing low. A clean break and close above the $110,000–$112,000 zone could trigger an accelerated move toward the $126,110 all-time high, which marks the next major supply level.
Conversely, a failure to maintain trendline support could invite a deeper pullback toward $95,000 or even the $75K region where stronger structural demand sits. However, momentum indicators such as RSI and volume suggest accumulation rather than exhaustion, implying that bulls remain in control as long as macro liquidity continues expanding. More so, the confluence of fundamentals indicate that BTC could be forming a new low that could surge to a new all-time high.
With fiscal easing, monetary support, and regulatory clarity converging, Bitcoin may be entering its next major expansion leg — positioning it once again as the bellwether for a renewed risk-on cycle.

BTC FALLSPreferably suitable for scalping and accurate as long as you watch carefully the price action with the drawn areas.
With your likes and comments, you give me enough energy to provide the best analysis on an ongoing basis.
And if you needed any analysis that was not on the page, you can ask me with a comment or a personal message.
Enjoy Trading ;)

BITCOIN HIGH PROBABILITY SETUP SOON!!!🚨 BTCUSD HIGH PROBABILITY BUY SETUP 🚨
* Here We Can See Clearly The Next Potential Moves For BTC Coming Hours/Days.
* Keep Your Eyes Close On Your Trading Positions.
* Happy PIP Hunting Traders.
FXKILLA.

BTC - BUY1. Trend Bullish - Sereis of HHs and HLs
2. Retracement of Fib 50% completed and wait for good entry around 61.8% where price will be 94,308
3. Bullish Trend Line will also intact.
4. At 94,308 there will be C point will also act as confluence for the ABCD chart Pattern

BITCOIN THE ONLY BULLISH WAVE COUNT We held fib supportBitcoin and The only bullish wave structure I can label is before you . The decline can be counted as an abc in a zig zag from the 121 zone to form at expanding 4 th wave abcde into a major uptrend line as well as a fib relationship . As long as we hold 98000 I will state that we can see a new high into 129k zone if we have a last wave up If we break 96700 i would only look for bear market rallies for a long time .

What Rising Indices Mean for Global Investors1. Understanding Market Indices
A stock market index represents the performance of a group of selected stocks. These stocks are often chosen based on their market capitalization, sector, or regional importance. For example:
S&P 500 (U.S.) tracks 500 large American companies.
Nikkei 225 (Japan) represents 225 top companies listed on the Tokyo Stock Exchange.
FTSE 100 (U.K.) measures the top 100 companies listed on the London Stock Exchange.
When these indices rise, it usually indicates that the collective value of their constituent companies’ stocks is increasing. This upward trend is often interpreted as a sign of economic strength and investor confidence.
2. A Reflection of Economic Growth
Rising indices are generally viewed as a positive indicator of economic growth. Companies listed on major indices tend to perform well when the economy expands. Increased consumer spending, strong corporate earnings, and stable employment levels all contribute to higher profits, which in turn push stock prices higher.
For instance, during periods of economic recovery—such as after a recession or global crisis—indices tend to climb as investors anticipate future growth. This optimism encourages further investment, creating a feedback loop of confidence and capital inflows.
3. Investor Sentiment and Confidence
Stock indices also serve as a psychological measure of investor confidence. When indices are on an upward trend, it signals that investors believe in the long-term stability of the economy. Positive sentiment often leads to increased demand for equities, pushing prices higher.
Conversely, rising indices can also attract new participants who don’t want to “miss out” on market gains. This phenomenon, known as “herd behavior,” can drive short-term rallies, especially when accompanied by strong media coverage or positive macroeconomic data.
4. Attraction for Global Capital Inflows
When indices in a particular country or region rise consistently, foreign investors often take notice. A bullish stock market suggests economic stability, policy consistency, and profitable opportunities. As a result, global funds and institutional investors may increase their exposure to that market.
For example:
A rising Nifty 50 in India attracts foreign portfolio investment (FPI) due to India’s growth potential.
An uptrend in the S&P 500 may lure global investors seeking safety and steady returns in the world’s largest economy.
Such capital inflows further fuel index growth and can strengthen the host country’s currency, creating a reinforcing cycle of financial optimism.
5. Wealth Effect and Consumer Behavior
Rising indices create what economists call the “wealth effect.” As investors see the value of their portfolios grow, they feel wealthier and more confident about spending. Increased consumer spending boosts company revenues, reinforcing the positive cycle of growth and higher earnings.
This effect is particularly pronounced in countries where household wealth is significantly tied to stock ownership, such as the United States. Higher consumer confidence leads to robust retail activity, real estate investment, and broader economic expansion.
6. Portfolio Valuations and Institutional Impact
For mutual funds, pension funds, and exchange-traded funds (ETFs), rising indices directly enhance portfolio valuations. Higher index levels mean better fund performance, which attracts new investors and capital.
Institutional investors often use benchmarks like the MSCI World Index or S&P 500 to measure their own performance. When these benchmarks rise, fund managers may adjust strategies to maintain parity or outperform the market, increasing trading volumes and market liquidity.
7. Sectoral Insights and Rotations
Rising indices often conceal complex movements within sectors. For instance, while the overall market may be rising, certain industries—like technology or healthcare—may be outperforming others.
Global investors closely monitor sectoral rotations, where capital shifts from one sector to another. During times of optimism, growth sectors such as technology and consumer discretionary lead gains. In contrast, when the market matures, investors may rotate to defensive sectors like utilities or consumer staples to protect profits.
Understanding these rotations helps investors position themselves strategically within the larger trend of a rising index.
8. Currency Implications
A strong and rising stock market often leads to currency appreciation. As foreign investors pour capital into equities, demand for the local currency rises. For instance, a rally in the Japanese Nikkei could strengthen the yen if international investors buy Japanese assets.
However, there’s also a balancing act—if a country’s currency strengthens too much, its exports may become less competitive, potentially slowing corporate earnings growth in export-driven economies. Hence, central banks closely monitor these interactions to maintain economic stability.
9. Rising Indices and Inflation Expectations
While rising indices often indicate prosperity, they can also signal growing inflationary pressures. Strong corporate profits and consumer spending can lead to higher demand for goods and services, pushing up prices.
Central banks, such as the U.S. Federal Reserve or the European Central Bank, may respond by raising interest rates to control inflation. Higher interest rates, in turn, can slow down future market gains as borrowing becomes more expensive for companies and consumers.
Thus, investors must evaluate whether rising indices reflect sustainable growth or overheating markets.
10. Risk of Overvaluation
One of the main concerns during a period of sustained index growth is overvaluation. When stock prices rise faster than corporate earnings, price-to-earnings (P/E) ratios expand, suggesting that stocks may be overpriced.
Historically, overvaluation has preceded market corrections. The dot-com bubble of the late 1990s is a classic example where excessive optimism led to inflated valuations, followed by a sharp downturn.
Prudent investors monitor valuation metrics, earnings growth, and macroeconomic indicators to distinguish healthy rallies from speculative bubbles.
11. Diversification and Global Portfolio Strategy
For global investors, rising indices in one region can influence asset allocation strategies across markets. Investors may rebalance portfolios by:
Taking profits in overvalued markets.
Allocating funds to underperforming or emerging regions.
Hedging currency and geopolitical risks.
For example, if the U.S. market is surging while Asian markets are lagging, investors might diversify into Asia for potential future gains once valuation gaps narrow.
Diversification remains a key principle—no matter how promising a market appears, concentration risk can magnify losses if conditions suddenly change.
12. Long-Term vs Short-Term Interpretations
Rising indices must be viewed through different time horizons:
Short-term investors see rising indices as trading opportunities driven by momentum.
Long-term investors interpret them as reflections of structural economic progress, technological innovation, or policy stability.
Therefore, understanding the context behind index movements—earnings growth, fiscal policy, interest rates, or geopolitical developments—is essential for making informed investment decisions.
Conclusion
Rising indices symbolize confidence, economic vitality, and investor optimism in global markets. They indicate strong corporate earnings, robust demand, and capital inflows. However, they also come with risks—such as overvaluation, inflationary pressures, and the potential for sharp corrections.
For global investors, rising indices should not be seen merely as a signal to buy, but as a prompt to analyze fundamentals, monitor macroeconomic trends, and rebalance portfolios wisely. A disciplined, informed approach allows investors to harness the opportunities of a bullish market while remaining prepared for inevitable market cycles.

Bitcoin: Testing $100K after another pullbackBitcoin slipped back toward the $100K range this week, largely driven by a broader pull-back in risk assets and concerns over tightening monetary policy. A hawkish tone from the Federal Reserve and soft macro-economic signals weighed on sentiment, reducing near term upside momentum. On the other hand, underlying on chain and structural fundamentals remain sound: spot BTC-ETF inflows are still net positive, on exchange supply is staying low, and there are emerging analysts who now argue that Bitcoin is under-priced given its fundamentals. Certainly long term holders and followers of BTC and the crypto market know very well that historically, the crypto market had several strong shifts both toward the up- and downside.
BTC continued with its corrective move during the previous week. The price dropped below the $107K reaching its lowest weekly level at $99.180. BTC is closing the week around $101K. With the latest drop, RSI reached the level of 34, however, a clear oversold market side has not been reached. The indicator is closing the week at 36. The MA50 is now strongly converging toward the MA200, decreasing the distance between lines, indicating that potential cross might occur in the short future period.
Last week BTC returned to the levels from the start of this year, which could be treated as the current most significant supporting level for BTC. For the moment, there is a high probability that the market will spend some time testing these levels, before the next stronger move. In this sense, the $100K remains a supporting level, while the move toward the upside might lead BTC toward the $103K, with lower probability of $105K.

BTCUSDIn life, one must know how to dream. But that's not enough. You also have to believe. Believe that Bitcoin is capable of dropping by nearly 80%. Why? It's quite simple. No one wants to play the game of: "I was a fool because I bought high. Now I’ll just hope someone even more foolish comes along and lets me earn a few percent."
That’s why no one will buy Bitcoin until market participants feel it can rise by 50%. That’s the essence of this cryptocurrency: an unbacked asset that can be pushed back and forth, generating tens or even hundreds of percent in profit.
At the moment, it’s failing to deliver on that potential. That’s why no one is buying it. From a technical standpoint, a small “head and shoulders” pattern has already been activated, marked in gray. At the same time, wave C of the ABC pattern is unfolding. But simultaneously, I see strong potential for a larger “head and shoulders” formation. And that’s when we’ll drop by 80%.

BTC/USD POSSIBLY Reaching a LOWFor now, BTC punched through all reversal levels except $98,254 ($99,525 lowest yet), between now and Thursday it could be a little choppy with a final LOW around Thursday or even wick down $98,254.
The only catastrophic scenario would be if it CLOSED the WEEK below $98,254 but even astrologically it should turn BULLISH on Thursday hence, avoiding a WEEKLY CLOSE below $98,254.
