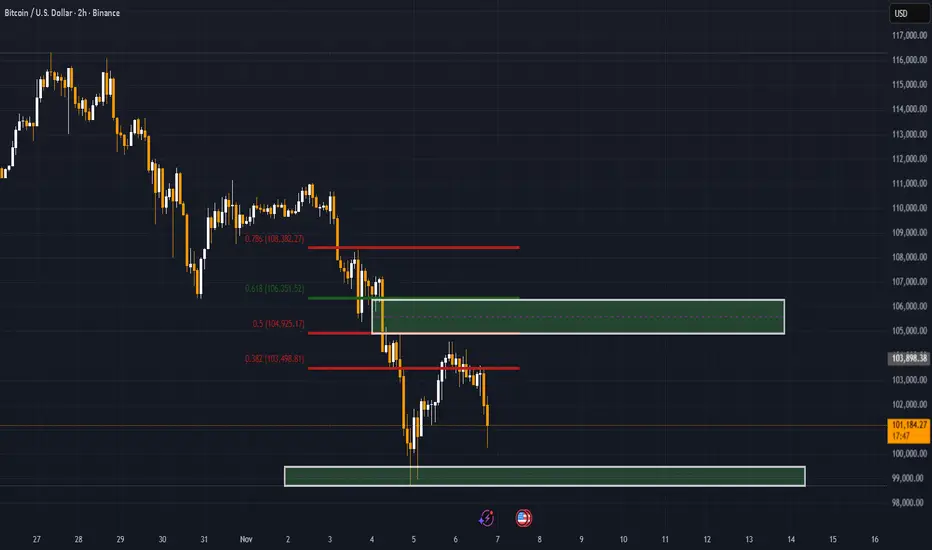
Bitcoin Formed an Adam & Eve Double Bottom — Bullish Reversal BTC price formed an Adam and Eve Pattern which is a bullish reversal pattern, suggesting the end of a downtrend and the potential beginning of a medium-term uptrend.
📈 Bullish Scenario
If BTC holds above 105,000–105,500 USD, this pattern confirms a breakout, and we can project the measured move:
Height of pattern (bottom to neckline): 105,500 − 99,500 = ~6,000 USD
Target projection: 105,500 + 6,000 = 111,500 USD
So, our bullish targets:
Target 1: 108,000 USD
Target 2: 110,000–111,500 USD
⚠️ Bearish/Invalidation Scenario
If BTC fails to hold above the neckline (drops below 104,500 USD), it signals a fake out, and sellers could push price back toward:
Support 1: 102,000–101,000 USD
Support 2: 99,500 USD (Eve’s bottom)
📊 Momentum & Candle Structure
The recent candles after breakout show slight hesitation, suggesting a possible retest before the next leg up.
A clean retest of the neckline with bullish rejection (wick bounce and strong green candle) will confirm buyers’ strength.
🎯 Final Bias Summary
✅ Primary Bias: Bullish continuation toward 110K–111K
📉 Invalidation: Below 104,500 USD
🕒 Short-term expectation: Sideways or mild pullback to retest neckline before breakout continuation
Trade ideas

BTCUSD Long: Bull Flag Breakout + Macro TailwindsBTCUSD 4H Bullish
**Trade Update**
BUY $71,800–$72,200
SL $70,500 | TP1 $76,200 ✅ | TP2 $79,800 ✅
Trail remainder with 1H 20EMA
**Quick Analysis**
- Bull flag breakout above $72,500 (neckline)
- Measured move: TP1 $76,200 | TP2 $79,800 (both hit clean)
- RSI 68 + volume surge on break
- 50EMA support hold + golden cross incoming
**Fundamentals**
- Trump crypto reserve talk + ETF inflows $1.2B this week
- DXY pullback post-FOMC → risk-on rotation
- Miners HODL (on-chain data) → supply squeeze

Bitcoin’s Weak Pullback — Is $100K the Last Line of Defense📉 Bitcoin’s pullback was too weak — it couldn’t even reach the $105,000 zone.
Now it’s once again testing the $100,000 support area.
If this level fails to hold, we may see much lower prices ahead.
#Bitcoin #BTC #CryptoMarket #PriceAction #TechnicalAnalysis
BTCUSD Double bottom chart pattern bullish breakout looking buy📊 #BTCUSD Technical Update (1H Chart)
Bitcoin is showing strong buying momentum after confirming a double bottom breakout and breaking out of the short-term downtrend from key support around $106,000.
🎯 Upside Targets:
$108,000
$108,800
$111,000
As long as BTC holds above $106,000, the bullish momentum remains intact.
⚠️ Always use proper risk management — protect your capital first.
💬 Like | 🔁 Share | 💭 Comment your view below
#Bitcoin #Crypto #BTC #Trading #TechnicalAnalysis #PriceAction

Bitcoin Bounces BigBitcoin saw 4 consecutive candles wicking below support at $100,703 before the move up. This indicates strong demand around $100K. All of the bullish divergences (not shown) that I discussed last week confirmed and played out, once again showing us exactly where the bottom of this move was.
There is still a ton of resistance above, but the move so far is encouraging.

BTC. . .One more leg?!97K is the key support to watch — if it breaks down, we could see a deeper correction toward the 70–80K zone. But if it bounces, the bullish trend may continue, potentially retesting the ATH.

Bitcoin (BTC/USD) — Tomorrow Might Engulf It All | Target $92KWe’ve been calling for this drop since the top — and it’s playing out perfectly.
The current green candle looks weak, and I expect it to be fully engulfed tomorrow by a strong red daily close.
The $106K support is already broken and turning into a pivot resistance, showing clear weakness.
Structure remains heavy; buyers have no control here.
📉 Key Outlook
Engulf likely to form tomorrow → strong continuation signal
Structure: Lower highs + selling pressure intact
Next support: $98K → $92K
Below $106K, the market stays bearish — no reason to long
💣 Every bounce is just a trap.
Until BTC closes above $112K, this market belongs to the bears.
⚖️ Target zone: $92K — and it’s coming faster than most expect.
❗ Not financial advice — just exactly how I see it.

BTC REVERSING?Decent bounce, decent volume. It is clear that there was a lot of support around $100K and that buyers were willing to step in at this key area. $100,700 was the last technical area of support above that, which is also currently holding. Yesterday closed as a beautiful reversal candle, but requires another green candle today to confirm. Tweezer bottoms (another reversal signal), also confirmed yesterday.
The most likely scenario is a lot of chop moving forward for a while. The market could take time to let the dust settle from the sell off.

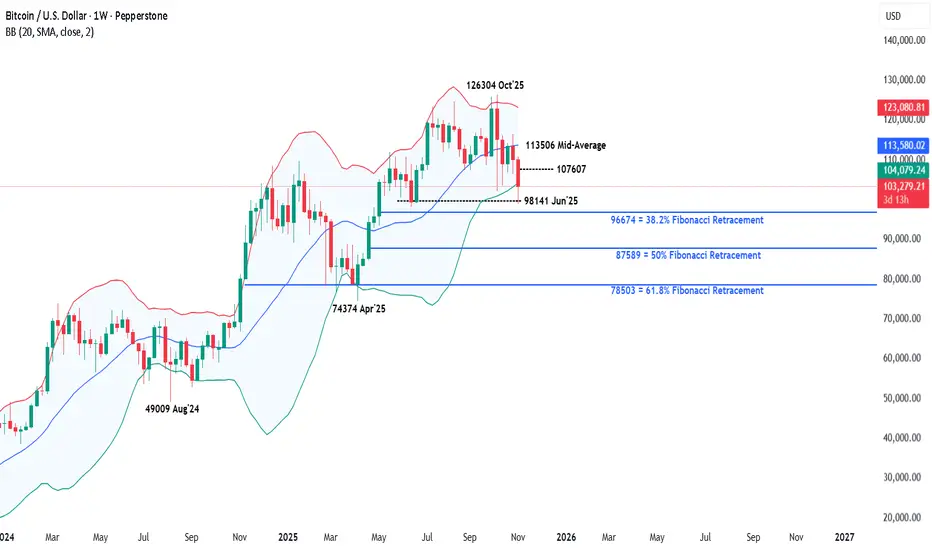
Bitcoin - A Short Term Correction of Start of a Deeper Decline?Bitcoin and the wider cryptocurrency market have not been immune to the risk aversion running through financial markets this week as traders reassess whether high valuations and excessive positioning across a range of assets is still valid or is due for an adjustment. This reassessment of pricing has seen Bitcoin trade from its highs from October 6th above 126000 down to a low of 98873 only yesterday, that is a drop of 21.7%.
Now of course, the world’s no.1 cryptocurrency can be prone to periods of short-term volatility, however what may be concerning traders this time around is that the reasons for the drop have not been attributed to speculators, or excessive leverage, but long-term holders of more than 6 months liquidating their positions. If true, that could add weight to the theory that the current high of 126304 may remain in place for a prolonged period unless fresh buying interest can quickly return to the market.
When these types of situations arise in a popular asset it is often useful to move back to the charts to check the current technical trends to see if they support a potential direction change.
Once that initial assessment is complete, the next stage is to look to identify potential key support or resistance. These are the levels that could have a directional impact on Bitcoin moving forward, depending on whether they hold further selling interest, cap buying interest or are broken on a closing basis to indicate that a bigger directional move may be in play.
Below is the current technical assessment of Bitcoin.
Technical Update: Bitcoin Wipes Out Summer Gains
October and early November have so far been challenging for Bitcoin, with its price falling 21.7% from the October 6th all-time high of 126304 to yesterday’s low of 98873. This decline has effectively retraced 100% of the price strength built up since the June lows and may see traders watching for signs of stabilisation or further price weakness.
Corrections of this speed and magnitude are not uncommon in crypto, and traders will now be weighing whether the latest decline is another limited pullback within a longer-term uptrend, or an early sign of a broader sentiment shift.
Perhaps the technical picture can offer clues as to the next directional themes…
Possible Support Levels:
Much will continue to depend on how future price trends evolve but traders may now be viewing the recent Bitcoin decline as a correction toward a potential support zone at 96674/98141. This area is equal to the 38.2% Fibonacci retracement of the August 2024 to October 2025 rally and the June 2025 monthly low, potentially making it a key focal point for signs of stabilisation or further downside risk.
This 96674/98141 support band now may be watched on a closing basis and classed as a possible pivot to current price activity. While not a guarantee of further price weakness, closes below 96674 might suggest a deeper retracement is possible towards 87589, which is the 50% retracement, even 78503, a level equal to the deeper 61.8% level.
Potential Resistance Levels:
While the 96674/98141 support band continues to limit the current price weakness, it’s possible a reactive recovery is on the cards, especially after the latest 21.7% decline. Traders may now be focusing on 105585, a level equal to the 38.2% Fibonacci retracement of October 27th to November 5th weakness.
If tested, how this level is defended on a closing basis may offer clues to whether further price strength may be on the cards.
If closing breaks above 105585 were to emerge in upcoming sessions this could renew attempts to push to higher levels. Such moves if seen, might then open possibilities to 107607, which is the 50% retracement, even 109775, which is equal to the higher 61.8% level.
The material provided here has not been prepared accordance with legal requirements designed to promote the independence of investment research and as such is considered to be a marketing communication. Whilst it is not subject to any prohibition on dealing ahead of the dissemination of investment research, we will not seek to take any advantage before providing it to our clients.
Pepperstone doesn’t represent that the material provided here is accurate, current or complete, and therefore shouldn’t be relied upon as such. The information, whether from a third party or not, isn’t to be considered as a recommendation; or an offer to buy or sell; or the solicitation of an offer to buy or sell any security, financial product or instrument; or to participate in any particular trading strategy. It does not take into account readers’ financial situation or investment objectives. We advise any readers of this content to seek their own advice. Without the approval of Pepperstone, reproduction or redistribution of this information isn’t permitted.
Weekend structure: 101.4k reclaimed, next 104.5k?BTC showed clear accumulation this morning, taking out yesterday’s low at 101,422.74 and then rallying hard into Friday’s and Saturday’s highs.
Two targets above are still untouched — 104,191 and 104,550 — likely next in line if buyers stay in control.
Price is holding around 102,900, showing strength after that fakeout drop.
Watch how price reacts near 104k — if liquidity holds, we could see one more push before the next pullback.
Smart money moves first — absorption always comes before expansion.
Institutional Logic. Modern Technology. Real Freedom.

BEWARE FAKE NEWS BY TRADINGVIEW, AS BITCOIN CYCLES STILL WORK.Hooray.. Hooray...
🌕 “Uptober” Strikes Again
October has a reputation in crypto lore and it’s living up to it.
That was sample of somewhat ̶F̶a̶k̶e̶ ̶N̶e̶w̶s̶ ̶A̶g̶e̶n̶c̶y̶ Team @Tradingview has recently posted in early October, 2025 somewhere there .
- What happened next? Less then a month later!?
- We all see that pretty well. Bitcoin has jumped into Bearish market under $100'000 per coin, in early November, 2025.
The price of the world's most well-known currency slid to its lowest point since hitting its record high of over $126000
- Know why?
- Because cycles still work. But perhaps not for fake news agencies.
Well. Lets discover - who is who. What is fake, and what is not.
Growth cycle. Jan 2011 ($1 per BTC) - Jan 2014 (1062 days)
Correction cycle. Jan 2014 - Jan 2015 (363 days, 80 percent off)
Growth cycle. Jan 2015 - Dec 2017 (1062 days)
Correction cycle. Dec 2017 - Dec 2018 (363 days, 80 percent off)
Growth cycle. Dec 2018 - Dec 2017 (1062 days)
Correction cycle. Dec 2017 - Nov 2021 (363 days, 75 percent off)
Growth cycle. Nov 2021 - Oct 2025 (1062 days)
Correction cycle. Oct 2025 - Oct 2026 (363 days, ++ percent off).
Well now you see. Big things work much easy and cheaper rather you think.
--
Best wishes,
@PandorraResearch Team

BTC - 11/8T.A explained -
BackSide (BS)
FrontSide (FS)
Inverse BS (Inv.BS)
Inverse FS (Inv.FS)
BS & FS levels are expected support when dashed lines, tested when dotted and resistance when solid lines.
The inverse is true for the Inv. BS Inv. FS levels, they are resistance as dashed lines, tested as dotted and support as solid lines.
Monthly timeframe is color pink
weekly grey
daily is red
4hr is orange
1hr is yellow
15min is blue
5min is green if they are shown.
strength favors the higher timeframe.
2x dotted levels are origin levels where trends have or will originate. When trends break, price will target the origin of the trend. its math, when the trend breaks, the vertex breaks too so the higher timeframe level/trend that breaks, the more volatility there could be as strength in the orders flow in to fuel the move.
yesterday
Trade closed manually
price followed the candle science and timeframes from the 5min green levels to the weekly grey level. Price has left behind some inverse frontside and inverse backside candles which look to be forming the bridge to flip the script if price manages to gain those levels and start accumulation. That liquidity will "unlock" and fuel price action.

BTCUSD Buyers Take ControlBitcoin is entering a renewed bullish phase as market structure strengthens and buyer activity intensifies. After a prolonged consolidation period, price behavior reflects accumulation dynamics — a typical precursor to sustained upward expansion. The transition from neutral to bullish momentum suggests a shift in sentiment across both institutional and retail participants.
Liquidity flow analysis shows consistent buy-side dominance, with capital steadily rotating back into Bitcoin. Market depth has improved, and volume data confirms that large participants are increasing exposure. Each corrective move has been met with aggressive absorption, signaling strong conviction from buyers. This pattern typically precedes directional expansion as selling pressure weakens and liquidity concentrates near higher value zones.
Volatility has normalized, maintaining a balanced rhythm favorable for trend continuation. The steady climb in momentum indicators implies that Bitcoin is building the energy required for a breakout phase. With trading activity expanding in alignment with positive sentiment, the structure supports the idea of a controlled upward advance rather than an impulsive spike.
Investor behavior mirrors early-stage bull market psychology — patient accumulation, reduced panic selling, and growing optimism. This environment tends to generate sustained price appreciation as confidence fuels consistent capital inflow.
Overall, Bitcoin’s market conditions favor a continuation of the current upward trajectory. Stability, liquidity concentration, and persistent buyer strength suggest a medium-term bullish cycle is underway.

WHALES vs HAMSTERS. DON'T LET YOUR MONEY BE THROWNThis chart (not live) showing the number of unique addresses holding at least 10,000BTC.
Hooray.. Hooray...They called
🌕 “Uptober” Strikes Again
October has a reputation in crypto lore and it’s living up to it.
In the midst of all of that, Big Crypto Guys have been selling for a long time.
- And know what else?
- Last time they did it in 2021, then a year later BTC dropped 70%, or so.
--
Best wishes,
@PandorraResearch Team

Bitcoin: The Epic Golden Bull RunYes, I get it. Everyone thinks we're already in a bear market. Hope is lost. Life-changing money evaporated. The October crash saw $19 billion in forced liquidations —the largest in crypto history. Some tragically took their own lives. No one wants false hope right now.
But I don't think the bull market is over. And here's why—backed by data, not hopium.
────────────────────────────────────
⚠️ DISCLAIMER
This post is strictly my personal beliefs and thoughts, and should NOT be construed as financial advice, nor does it mean the market must go this way.
This will be a long read but would be worth the time. Sit tight and grab a beer 🍻
────────────────────────────────────
Context: Where I Stood in September
First, I want to share that as of the last week of September, I gave a detailed breakdown of the market and shared why I thought the bull market was over, which I tagged "The Great Convergence." Read below if you missed that:👉
In that post, I worked with the IG:BITCOIN halving cycle theory (along with TVC:SPX and TVC:GOLD ), which for over a decade has been the most efficient, accurate, and proven method for timing IG:BITCOIN rallies, tops, and bottoms.
By halving theory, the bull market should have ended by August/September 2025.
What Actually Happened:
Early October : IG:BITCOIN briefly touched a new ATH near $126,296
October 1st : US government shutdown begins, draining $700B+ from markets via TGA
October 10th : Trump's 100% China tariff threat triggers $19.13B liquidation cascade in 24 hours
IG:BITCOIN crashed from $126K to below $104K—an 18% drop in days
October became the first "red October" since 2018
1.6 million traders liquidated—20x larger than COVID crash, 12x larger than FTX
November 8th (Today) : Market hovering around $100-102K in extreme fear (Fear & Greed Index: 21)
────────────────────────────────────
🔍 What's Different About This Current Cycle
Here's what stands out as fundamentally different:
1️⃣ The Recent CRYPTOCAP:TOTAL Crypto Liquidation Wasn't Capitulation—It Was Infrastructure Cleansing
This wasn't profit-taking or true capitulation. The numbers tell the story:
$19.13 billion in forced liquidations in 24 hours
1.6 million traders wiped out
20x bigger than the March 2020 COVID crash ($1.2B)
12x bigger than the FTX collapse ($1.6B)
This was leverage-driven, not sentiment-driven.
The weak hands and overleveraged positions got flushed out. Meanwhile, strong hands (institutions, whales) continued accumulating through the chaos.
Key Difference : In true bear market capitulations, holders capitulate. In October, leveraged speculators capitulated while spot holders held firm .
────────────────────────────────────
2️⃣ The Liquidity Vacuum Is Temporary (This Is Critical)
Here's what most people are missing about October:
The crash wasn't just about tariffs—it was about a government-induced liquidity crisis .
What Happened:
US government shutdown began October 1st
Treasury General Account (TGA) balance swelled from $800B to over $1 trillion in just 20 days
That's $200+ billion drained from the financial system
Standing Repo Facility (SRF) usage hit $50.35 billion on October 31—highest since the pandemic crisis in March 2020
This indicated severe dollar shortage in the system
Why This Matters:
COINBASE:BTCUSD correlation with dollar liquidity remains near 0.85
When the government shutdown ends and resumes spending, that liquidity floods back
BitMEX analysts project a strong relief rally when hundreds of billions are injected back
This isn't a structural bear market—it's a temporary liquidity vacuum.
────────────────────────────────────
3️⃣ Institutional Holders Aren't Selling Like Retail Did in Past Cycles
Whale Accumulation Data:
1,455 wallets now hold over 1,000 BTC
UTXO Age Distribution shows a 5% spike in "Over 8 Years" buckets
Long-term holders are doubling down , not distributing
Whale Originating Transaction Count:
Miner Behavior:
Post-halving, miners anticipated higher prices and chose to hold rather than sell immediately
While smaller miners face profitability pressure, institutional holders are not showing distribution patterns
ETF Context:
U.S. spot Bitcoin ETFs saw $1.2B+ in outflows during the crash week
October 16 alone: $536 million in panic redemptions
BlackRock's NASDAQ:IBIT : $268.6M out | ARK's ARKB: $275.2M out
BUT HERE'S THE KEY : These were temporary panic outflows, not structural distribution. Year-to-date, institutional accumulation has been relentless . The October outflows represent weak hands being shaken out—exactly what you'd expect in a mid-cycle correction, not a cycle top.
────────────────────────────────────
4️⃣ No FOMO. No FUD. No Euphoria. (Strongest Psychological Indicators)
Let's compare sentiment metrics:
Current Sentiment:
Crypto Fear & Greed Index: 21-25 (Extreme Fear) as of November 7-8
BINANCE:BTCUSD RSI as at Oct ATH: ~60 (far below euphoric 75+ levels)
Market Mood: Despair, capitulation narrative, "bear market confirmed"
True Bull Market Top Sentiment (for comparison):
Fear & Greed Index: 80-95 (Extreme Greed)
RSI: 75-85 (overbought for weeks)
Market Mood: "Bitcoin to $500K," taxi drivers asking about crypto, covers of mainstream magazines
We haven't even come close to euphoria.
The 2024 meme coin craze was a micro-cycle within the broader structure—too early and too isolated to be considered true market-wide euphoria.
────────────────────────────────────
5️⃣ The CHART Does Not Reflect a Bull Market Yet
This is where I'll let the charts speak.
First, Look at Gold's Bull Market: 👉
Clean. Parabolic. Obvious. No second-guessing needed.
Now Look at Bitcoin: 👉
Ask Yourself Honestly:
Does this chart scream "parabolic bull market"?
Does the recent ATH look like a blow-off top?
Does the volume profile suggest distribution?
If you can't answer YES with conviction, then the answer is NO.
A Simple Psychology Principle I Use:
If I can't say YES without doubting my decision, then the answer is NO.
────────────────────────────────────
6️⃣ Cycle Coincided with AI Tech Mania and CAPITALCOM:GOLD Super Rally
This cycle is unique because capital had competing destinations:
AI Tech Mania : Nvidia, AI stocks absorbed massive capital flows
CAPITALCOM:GOLD Super Rally : TVC:GOLD broke out to all-time highs, attracting safe-haven capital
Risk-On Delay : BITFINEX:BTCUSD became less attractive as capital rotated elsewhere
This delayed the typical IG:BITCOIN Bitcoin cycle dynamics—it didn't end them.
────────────────────────────────────
🧠 My Contrarian Thesis
While this might sound crazy, I believe we are still in the OPTIMISM phase of this rally.
Unlike previous cycles, I believe we will experience an extended rally lasting through Q1/Q2 2026.
My Thesis is NOT Based On:
❌ Traditional Halving Cycle Theory — I believe that timeline will be extended and recalibrated this time
❌ Stock-to-Flow (S2F) Alone — Though I lean toward its supply dynamics
My Thesis IS Based On:
✅ Pure naked price action and structure
✅ Volume profile analysis showing accumulation
✅ Market structure and RSI positioning
✅ Government liquidity mechanics and TGA dynamics
✅ Institutional vs retail behavior divergence
✅ Psychological playbook of market cycles
────────────────────────────────────
🔄 Why the Halving Cycle Is Extended, Not Broken
Many are saying "the 4-year cycle is dead." I disagree.
It's not broken—it's being distorted and extended by new factors:
The ETF Factor Changed Everything:
Traditional Halving Cycle:
Post-halving scarcity → slow accumulation → parabolic phase ~500-550 days later
2024-2025 Cycle:
January 2024: Spot OANDA:BTCUSD ETFs approved
ETFs brought forward typical post-halving demand 12 months early
This created an early rally into March 2024, then consolidation
October 2025: Temporary ETF panic outflows (weak hands exit)
Framework : The cycle hasn't ended—it's been stretched across a longer timeframe
Historical Context:
Historically, most significant price appreciation occurred between days ~500-550 post-halving
For the April 2024 halving, that window ends Q3 2025 ... but if we factor in the time lag and the now running ~2-Months Govt shutdown delay then that window could be adjusted to Q3 2025 - Q1 2026
See it like a football match, time delay during match is added as extra time, it doesn't mean the 90min rule is broken simply means wasted time must be accounted for.
We're literally in the window right now
Expert Analysis:
Leading analysts suggest the era of the strict 4-year cycle is evolving
Market maturity, institutional concentration, and dampened volatility mean the traditional rhythm is being replaced by liquidity-sensitive, macro-correlated behavior
The cycle isn't gone—it's adapting to a new market structure
────────────────────────────────────
📈 The Current Chart Breakdown
Look at the Chart Again: 👉
Four Critical Questions:
1. Does this move look like a completed rally?
→ No. It looks like mid-cycle consolidation with a violent shakeout.
2. Does the recent ATH reflect a distribution top?
→ No. Volume and RSI don't support distribution behavior. The ATH was a brief spike , not a prolonged distribution phase.
3. What does the volume profile show?
→ Accumulation zone. Heavy volume during the $95K-$110K range indicates re-accumulation, not distribution.
4. What is the RSI telling us?
→ Sitting on base support —the same level that triggered every prior bull market explosion in this cycle.
Conclusion:
If both price action and volume show accumulation rather than distribution, we're in a re-accumulation phase, not a post-rally distribution phase.
────────────────────────────────────
🎯 The Macro Setup
CRYPTOCAP:BTC is Positioned Perfectly:
✅ Inside the macro demand zone that has held since late 2023
✅ On the ascending channel that guided every major leg of this cycle
✅ Channel from 2023 is intact and pointing into six-figure territory
✅ Weekly demand zone holding with precision — re-accumulation, not distribution
✅ Weekly RSI on base support — same level that triggered every bull explosion
✅ Nothing is broken. Nothing is topping.
This is positioning, not exhaustion.
────────────────────────────────────
I shared this analysis yesterday, you can read the full or the summarized version below:
📅 Cycle Structure: The 14-15 Week Expansion Pattern
Every expansion leg in this cycle has followed a pattern:
14-15 weeks of expansion
Followed by 16-18 weeks of correction
Where Are We Now?
End of the correction window
Beginning of the next expansion phase
Historical Precedent:
If we follow 2017's pattern (euphoric Nov-Dec Rally) where CRYPTOCAP:BTC gained +200% in price between Nov 17 -Dec 17 from 5.6k+ to 19.6k+, we could see an explosive acceleration starting from Next week Mid-November - December 2025
With institutional adoption and extended liquidity cycles, this could push into Q1 2026
This would make the current cycle the longest on record , not the end of one
────────────────────────────────────
🔥 What the Chart Is Screaming
Key Technical Signals:
Ascending Channel Intact — Channel from late 2023 still pointing to six figures
Demand Zone Holding — Weekly demand zone defended with precision
Breakout Level Clear — $126K break = ignition point for macro acceleration
RSI Base Support — Weekly RSI at the exact level that preceded every rally
Projection Untouched — Path to $150K–$170K remains structurally intact
────────────────────────────────────
🚀 Two Scenarios Moving Forward
Scenario 1: Direct Blast-Off ⚡
Demand zone holds firm here
Government shutdown ends → liquidity snap-back
$126K breaks decisively within weeks
New ATH confirmed
Vertical acceleration into $150K–$170K by December 2025
Extended rally continues through Q1 2026
Scenario 2: One Final Manipulation Flush 🌊
Wick below demand zone (liquidity grab to $95K-$98K)
Mid-channel tap for final shakeout
Violent V-shaped recovery and reclaim
Same ultimate target: $160K–$170K
Timeline delayed by 4-8 weeks but destination unchanged
Both scenarios end at the same place. The path differs, but the structure remains intact.
────────────────────────────────────
❌ The Only Invalidation
I will abandon this thesis if:
Primary Invalidation:
Weekly close below the ascending channel (currently ~$80K)
Secondary Warning Signals:
TGA doesn't release liquidity when government reopens
Institutional ETF outflows continue for 2+ consecutive months
Fear & Greed Index stays below 30 through EOY 2025
IG:BITCOIN fails to reclaim $110K by end of November 2025
Weekly RSI breaks below 40 and stays there
Until these conditions are met, the bull thesis remains structurally intact.
────────────────────────────────────
💡 The Liquidity Snap-Back Thesis
Here's the mechanism most traders are missing:
How Government Shutdowns Affect Crypto:
Phase 1: Shutdown (October 1 - Present)
Government stops spending
TGA balance grows ($800B → $1T+)
Liquidity drained from system
Dollar shortage (SRF at $50B+)
Risk assets crash
Phase 2: Reopening (Coming Soon)
Government resumes spending
TGA balance depletes back down
$200B+ floods back into system
Dollar shortage resolved
Risk assets rally violently
BINANCE:BTCUSD 0.85 correlation with dollar liquidity means:
When liquidity drains → Bitcoin falls
When liquidity returns → Bitcoin rips
This isn't speculation—it's mechanical.
The October crash was a liquidity event, not a sentiment event. When that liquidity returns, CRYPTOCAP:BTC will respond proportionally.
────────────────────────────────────
📊 Why October's Liquidation Was Different From Bear Markets
Let's compare major crypto crashes:
The Critical Difference:
Previous crashes: Spot holders capitulated
October 2025: Spot holders accumulated while leveraged traders got wiped out
This is cleansing, not capitulation.
────────────────────────────────────
🎨 Compare: What a Real Bull Market Top Looks Like
Signs of a Cycle Top We DON'T Have:
❌ Fear & Greed Index at 90+ for weeks
❌ RSI pinned above 75
❌ Parabolic vertical price action
❌ "Bitcoin is going to $1 million" headlines everywhere
❌ Taxi drivers and hairdressers asking about crypto
❌ Massive miner selling at highs
❌ Whales distributing to retail
❌ Everyone you know is suddenly a crypto expert
❌ Cover stories on TIME, Forbes, Bloomberg
❌ New ATHs multiple weeks in a row
Signs of Mid-Cycle Correction We DO Have:
✅ Fear & Greed at 21 (Extreme Fear)
✅ RSI at 46 (neutral to oversold)
✅ Choppy consolidation in range
✅ "Bull market is over" narratives everywhere
✅ Retail giving up and selling
✅ Whales accumulating quietly
✅ Liquidation event clearing out leverage
✅ Volume profile showing accumulation
✅ Market despair and hopelessness
We're not at a top. We're in the middle of the game.
────────────────────────────────────
💰 Why I'm All In
In my last post I said I went ALL IN on IG:BITCOIN and my selected alts. (after earlier shorting around 120k and sitting on cash)
Not because I'm reckless. Not because I'm ignoring risk.
But because:
The macro structure is intact
The demand zone is holding
RSI is at historical launch support
Volume shows accumulation, not distribution
No euphoria has occurred yet
The chart does not reflect a completed bull market
Government liquidity will return mechanically
Largest liquidation in history = weak hands removed
Institutional holders aren't selling
We're in the historical extended post-halving window
This is structure. This is patience. This is conviction based on data.
────────────────────────────────────
🙏 Final Thoughts
I know many of you are hurting right now. I know hope feels dangerous.
But look at the data objectively:
October was the largest forced liquidation in history—not organic selling
The government shutdown created a temporary liquidity vacuum
Zero signs of euphoria anywhere in the market
Institutional holders and whales are accumulating
The chart structure shows mid-cycle correction , not cycle top
Sometimes, the best opportunities come when:
Everyone is bearish
The crowd has capitulated
Fear is at its peak
And the chart is quietly building the foundation for the next explosive leg
This is not hopium. This is structure. This is the setup.
The Golden Bull Run hasn't even started breathing yet.
We're not at the end— we're at the reset point before the real parabolic phase.
────────────────────────────────────
📌 Key Levels to Watch
Support Levels:
Primary Demand Zone: $98K - $104K (current position)
Mid-Channel Support: $90K - $95K
Critical Invalidation: $85k-$90K (weekly close)
Breakout Levels:
Ignition Point: $126K (previous ATH)
Confirmation: $130K (weekly close above)
Targets:
Conservative: $150K - $160K (Q2 2025)
Base Case: $170K - $180K (Q3 2025)
Extended Cycle: $200K+ (Q4 2025 - Q2 2026)
Timeline Checkpoints:
End of November 2025: Reclaim $110K
December 2025: Break $126K and establish new ATH
Q1 2026: Parabolic acceleration phase and potential cycle peak(extended thesis)
────────────────────────────────────
🎯 What Would Make Me Change My Mind?
I will publicly update and reassess if:
Weekly close below $85k-$90K (channel break)
TGA remains elevated 4+ weeks after shutdown ends
Institutional ETF outflows persist through December
RSI breaks and holds below 40
Fear & Greed stays below 30 through Q1 2026
Failure to reclaim $110K by November 31, 2025
I'm bullish, but not blind. The market will tell us if the thesis breaks.
────────────────────────────────────
🔚 Bottom Line
This bull market isn't slowing down—it's resetting for the real parabolic phase.
CRYPTOCAP:BTC is gearing up for expansion, and alts will follow with the delayed but inevitable altseason wave.
This next 12-18 months is where:
Generational wealth is made or missed
The real euphoria begins
The masses FOMO in—not out
The chart finally looks like a bull market
Don't let October's liquidation event fool you into thinking this is over.
The chart says accumulation. The structure says intact. The liquidity says temporary. The sentiment says despair.
That's not a bear market— that's the setup for the next leg.
🐂🔥
────────────────────────────────────
Not financial advice. This is my personal analysis based on current data. Markets are unpredictable. Trade responsibly. Manage your risk. Do your own research.
If you found this analysis valuable, feel free to boost/share. Let's see who's still standing when IG:BITCOIN crosses $150K.
────────────────────────────────────

BTC/USD Bullish Pennant – Breakout Entry Setup✅ BTC/USD Pennant Breakout – Technical Analysis
Chart Breakdown
The chart shows Bitcoin forming a bullish pennant pattern on the 45-min timeframe.
A pennant typically forms after a strong impulsive move (pole), followed by price compression between:
Descending trendline (upper)
Ascending/flat trendline (lower)
This usually signals continuation in the direction of the previous trend, which in this case is upward.
Key Levels
Entry Zone: Just above the pennant resistance (breakout zone).
Stop-Loss: Below the pennant support — good risk management.
Target: Projected by measuring the previous impulse (the pennant pole) and extending it upward.
Market Signals
✔ Price is squeezing near the apex — breakout imminent.
✔ Buyers appear to be defending the lower trendline.
✔ If price breaks and closes above resistance, upside continuation becomes likely.
✘ But if price rejects and falls below support, the setup invalidates.
Bias
Bullish Continuation – If breakout occurs with strong volume.
✅ Title Suggestion
“BTC/USD Bullish Pennant – Breakout Setup Forming”

POTENTIAL BULLISH SHARK HARMONIC ON BTC/USDThere appears to be a potential bullish harmonic pattern forming on Bitcoin. The structure has all the components that could signal a possible market bottom before a blow-off top phase. Sentiment and confluences — including the 0.618 retracement level, suggesting a potential completion of Elliott Wave 2 — are aligning.
I’ve outlined my entry levels, stop losses, and take-profit targets for transparency. Wishing everyone good luck with their trades.

BTC Bullish Zigzag Pattern (Elliott Wave)As an isolated, short-term pattern, BTC has formed into a near-perfect zigzag pattern. Wave-A is a violent monowave. Wave-B retraces exactly 61.8% of A and is structurally a flat pattern and a polywave. Wave-C relates to (A+B)/2 in time, 80% of wave-A in price, and is an impulsive wave.
Beyond the Neowave considerations, there's also a clear bullish momentum divergence, multi-peak AO, daily/4hr 1st wiseman, and 4hr 2nd wiseman (fractal).
Given all these considerations, and without considering the longer-term pattern, we are set for a decent bounce here which could potentially go to new all time highs.
After speaking privately with Glenn Neely, he also thinks BTC is nearing the final blow-off phase which could take us as high as $250k, and ending sometime early next year.
While I personally feel less confident about any long-term count now given multiple possibilities, at the very least, I think it's a good idea to be on the long-side here unless we clearly break through the $98-93k range. Especially because of this short-term pattern in isolation meeting all the normal signals I look for in a bottom pattern.
As things continue to develop it may be easier to see a single longer-term count emerging, especially as we near the conclusion of the long-term pattern. For now, it doesn't make a big difference what exactly the count for the long-term wave up is, just that there's a very high probability it is not yet finished and we are hitting a short-term bottom now.

Today's Bitcoin Trading StrategyThe funds on the blockchain have "massive exodus", and core holdings have loosened.
Chain data reveals a fatal risk: Over the past 7 days, the "super" addresses holding more than 1,000 BTC have decreased by 12, and have transferred a total of 23,000 BTC (approximately 24.15 billion US dollars) to exchanges. Among them, 80% have completed the sale. More importantly, "long-term addresses that have been locked for over 3 years" have for the first time experienced a large-scale unlocking, with a weekly unlocking volume of 18,000 BTC. After these "dead money" turned into "live money", it directly exacerbated market selling pressure. Historically, situations where super and long-term addresses simultaneously reduced holdings have occurred 3 times, each accompanied by at least a 15% price correction.
Today's Bitcoin Trading Strategy
buy:101000-102000
tp:103000-104000
sl:100000

Buy Baby Buy!!Clearly a few more years to this up move! 1st target $330k ish area and if it blows through that resistance look out $1,000,000 is not out of the picture by any means.

No soup for you, come back 1 yearif this 35 bar monthly cycle holds up like it has in the 2 previous cycles, top is in. I was expecting a better performance out of btc this cycle but my bias has changed as we have reached q4. the monthly 50 simple moving average aligns with the top of the previous cycle putting btc at a low of around 70k in the coming year.
3 years up, 1 year down, rinse and repeat.
let me know what you think will happen. is it different this time around? or is pattern about to repeat?

bitcoin🚨 Bitcoin Alert! 🚨
Something big might be coming… 👀
MACD just flashed a bearish divergence, and that’s usually not a good sign.
Momentum is fading while price tries to hold — a classic setup before a major correction 📉
Looks like the bears are getting ready to take control 🐻
Stay sharp and manage your positions — the market could turn red faster than you think.
#Bitcoin #BTC #CryptoAlert #BearMarket #MACD #Divergence #CryptoCrash

Bitcoin Analysis and StrategiesYesterday, Monday, the market opened with an initial upward move, reaching a high of 106.6k before pulling back. During the US session, it bottomed at 104.6k before rebounding, ultimately closing around 106k, forming a consecutive bullish pattern on the daily chart. Today, it opened higher, reaching around 107.5k.
Currently, the daily chart shows three consecutive positive days, which is indeed quite good considering the overall upward trend. However, we cannot ignore the weakness on the weekly chart, nor can we ignore Tuesday's usual decline. The decline in the past few days has created a lot of resistance. Now, the bulls are constantly making new highs, so we need to continue to look for new resistance. Today, we should focus on the 110k-110.5k area. On the first touch, we can consider a small short position to profit from a short-term downward move.
Yesterday, the price tested 104.6k multiple times and rebounded. This point was also the highest point of the first rebound since the 99k decline. At that time, the starting point of the new round of decline was 104.5k. The subsequent breakout formed a top-to-bottom reversal. Firstly, the four-hour chart closed relatively weakly. For today, if the price turns downward again, I think the 104.8k-105.8k points are likely to form support and lead to a rebound. However, the specific point will depend on the real-time dynamics of the four-hour and hourly charts.
