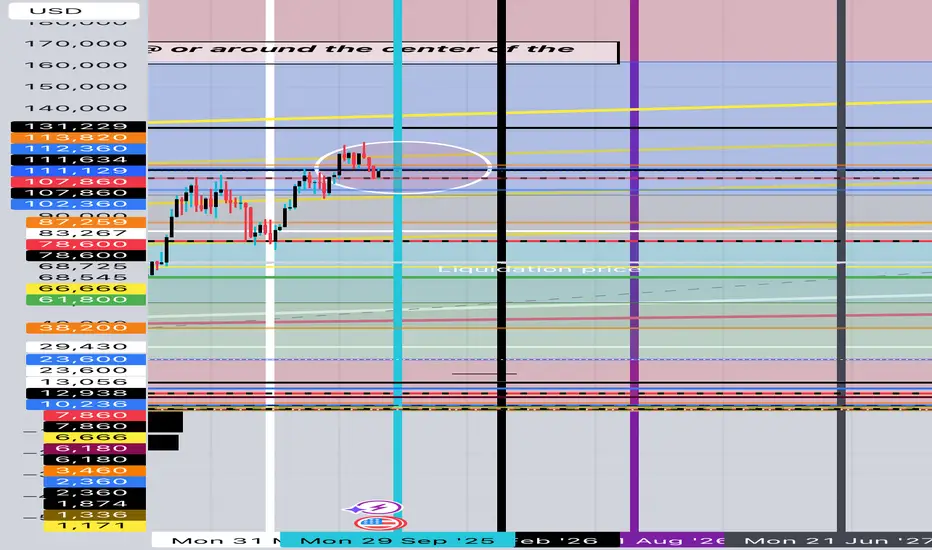
Bitcoin - TIP - Correct Way to Draw Support / ResistanceI see often times analysts using horizontal support and resistance on Bitcoin.
I wanted to demonstrate the proper way of using support resistance on Bitcoin - and show how the channels are ascending from left to right.
Not only can this be repeated on high time frames - by duplicating the line with the same degree of angle, and placing it at any location - it can also be applied to smaller and smaller time frames, and the price respects these angles very well.
Due to the liquidation wicks and absorptions that occur, price will move above and below the correct line - but the correct line serves as a volume support line that’s again, ascending from left to right.
Try this out on your charts - and see how reliable it is.
Ascending angles - not horizontals.
BTCMINI trade ideas

Bitcoin Shorting Opportunity: Order Block Resistance at $120KBitcoin (BTC/USD) Shorting Opportunity: Order Block Resistance at $120K - Sep 5, 2025
This chart is a 1-day candlestick chart for Bitcoin (BTC/USD), created on TradingView.com on September 5, 2025, at 10:58 UTC+1 (11:04 AM WAT). It presents a potential shorting opportunity based on the following analysis:
- Entry Point: Initiate a short position near $120,892.50, which aligns with the upper boundary of the Order Block (OB). This area likely represents significant institutional selling interest and a potential resistance zone.
- Target: Aim for a profit target at $98,242.47, the recent low, indicating a potential downside move of approximately $22,650 per BTC.
- Stop Loss: Place a stop loss at $123,286.98, just above the Order Block, to limit risk to about $2,394.48 per BTC if the price breaks upward.
- Risk-Reward Ratio: This setup offers a favorable 1:9 risk-reward ratio, making it an attractive shorting opportunity if the Order Block holds as resistance.
- Rationale: The Order Block, marked on the chart, suggests a reversal point where selling pressure may dominate. The recent "Sweep" and "Shift" annotations indicate a possible liquidity grab or trend change, supporting a potential decline toward the support at $98,242.47. The upward move from the low followed by a pullback reinforces this setup.
Monitor price action closely around the Order Block, as volatility could impact the trade. Consider real-time data for confirmation.

BTCUSD DAY TRADING SETUP (CAFX)"This is how I am currently analyzing BTCUSD. I’m paying close attention to the overall market structure, key support and resistance zones, and recent price action to determine where the next move might unfold. I’ll be watching for potential breakout opportunities, liquidity grabs, and retests around major levels to confirm my bias. Keep in mind, this is simply my personal outlook and not financial advice — always do your own analysis before making trading decisions."

BTCUSD – Breakout from Range High → Eyeing 115–119k SweepBTC broke out of the local range and tagged liquidity around 112.6k. Structure still looks constructive with EMAs turning supportive on the 1H.
• Entry (white): 112,000–112,200 (buy zone / retest levels)
• Stop (red): 110,785 (below recent swing)
• Take Profit 1 (green): 113,825 (local fib extension + resistance)
• Take Profit 2 (green): 115,503–115,516 (key supply)
• Take Profit 3 (green): 119,608 (major range high / liquidity sweep)
Bias: Bullish continuation unless 110,800 breaks — in which case we reassess for a deeper flush back to 109k liquidity.

BTCUSD bullish continuation supported at 109,040The BTCUSD remains in a bullish trend, with recent price action showing signs of a corrective pullback within the broader uptrend.
Support Zone: 109,040 – a key level from previous consolidation. Price is currently testing or approaching this level.
A bullish rebound from 109,040 would confirm ongoing upside momentum, with potential targets at:
115,420 – initial resistance
117,400 – psychological and structural level
119,260 – extended resistance on the longer-term chart
Bearish Scenario:
A confirmed break and daily close below 109,040 would weaken the bullish outlook and suggest deeper downside risk toward:
106,470 – minor support
104,340 – stronger support and potential demand zone
Outlook:
Bullish bias remains intact while the BTCUSD holds above 109,040. A sustained break below this level could shift momentum to the downside in the short term.
This communication is for informational purposes only and should not be viewed as any form of recommendation as to a particular course of action or as investment advice. It is not intended as an offer or solicitation for the purchase or sale of any financial instrument or as an official confirmation of any transaction. Opinions, estimates and assumptions expressed herein are made as of the date of this communication and are subject to change without notice. This communication has been prepared based upon information, including market prices, data and other information, believed to be reliable; however, Trade Nation does not warrant its completeness or accuracy. All market prices and market data contained in or attached to this communication are indicative and subject to change without notice.

Emerging Markets vs Developed Markets1. Defining Emerging and Developed Markets
Emerging Markets
Defined by the World Bank, IMF, and MSCI as economies transitioning from low or middle-income to higher-income levels.
Often characterized by rapid GDP growth, increasing foreign investment, and structural reforms.
Have growing but still volatile financial markets.
Examples: India, China, Brazil, Mexico, Turkey, South Africa.
Developed Markets
Countries with high per-capita income (usually above $12,000-$15,000), strong institutions, and advanced infrastructure.
Financial systems are stable, liquid, and globally integrated.
Economies are more service-oriented rather than manufacturing-driven.
Examples: U.S., U.K., Germany, Japan, Canada, Australia.
2. Key Economic Characteristics
Feature Emerging Markets Developed Markets
GDP Growth Higher growth rates (5–8% in many cases) Lower growth (1–3%)
Per Capita Income Low to middle-income High-income
Industrial Structure Manufacturing & agriculture dominant, but services growing Services dominate (finance, technology, healthcare)
Innovation Catching up; dependent on FDI & imports Advanced R&D, global tech leaders
Currency Stability Volatile, prone to inflation Stable, globally traded (USD, Euro, Yen)
Emerging markets are often seen as growth stories, while developed markets represent stability and maturity.
3. Financial Market Differences
Emerging Markets
Stock markets are less liquid, meaning large trades can move prices dramatically.
Higher volatility due to political risk, regulatory uncertainty, and global capital flows.
Often more sector-concentrated (energy, banking, infrastructure).
Foreign Direct Investment (FDI) plays a big role in financing growth.
Developed Markets
Deep, highly liquid capital markets (e.g., U.S. stock market is the largest in the world).
Lower volatility, with strong institutional investors (pension funds, insurance companies).
More diverse sectoral representation (tech, healthcare, finance, industrials).
Better regulations, reducing systemic risks.
4. Investment Opportunities
Why Investors Choose Emerging Markets
Higher returns: Fast economic growth means higher equity and bond returns (though riskier).
Demographics: Younger populations, rising middle class, and urbanization.
Undervalued assets: Stocks and bonds often trade at cheaper valuations compared to developed markets.
Natural resources: Many emerging economies are rich in oil, gas, and minerals.
Why Investors Choose Developed Markets
Stability: Political stability, strong legal protections, and reliable institutions.
Liquidity: Easy entry and exit in large markets like the U.S. and Europe.
Innovation hubs: Developed countries lead in technology, biotech, and finance.
Lower risk: Investors prefer developed markets during global uncertainty.
5. Risk Factors
Emerging Markets Risks
Political Risk: Government instability, corruption, and inconsistent policy.
Currency Risk: Devaluation or inflation affecting returns.
Liquidity Risk: Difficulty in buying/selling assets without price disruptions.
Regulatory Risk: Sudden changes in trade policy, taxes, or financial rules.
Dependence on Commodities: Economies like Brazil or Russia depend heavily on oil/mineral exports.
Developed Markets Risks
Slower Growth: Returns are lower due to market maturity.
Aging Population: Japan and Europe face demographic challenges.
Debt Levels: High government debt (U.S., Japan).
Global Linkages: Developed markets are highly exposed to global downturns.
6. Role in Global Trade
Emerging Markets: Supply labor-intensive goods, commodities, and raw materials. They are key players in global manufacturing supply chains (China, Vietnam, India).
Developed Markets: Supply high-value goods and services like technology, finance, pharmaceuticals, aerospace, and luxury products.
Emerging economies are often the producers, while developed markets are the consumers and innovators.
7. Examples of Emerging vs Developed Markets
Emerging Markets Examples
India: Fastest-growing large economy, driven by services and IT.
China: World’s factory, now transitioning toward consumption-driven growth.
Brazil: Rich in natural resources but faces political and inflation challenges.
South Africa: Gateway to Africa, but troubled by inequality and governance issues.
Developed Markets Examples
United States: World’s largest economy, innovation hub (Silicon Valley, Wall Street).
Germany: Europe’s powerhouse, strong in engineering and manufacturing.
Japan: Technology-driven, though aging demographics challenge growth.
United Kingdom: Major financial center, diversified economy.
8. Performance Trends
Emerging markets tend to outperform during global booms due to higher growth and demand for commodities.
Developed markets perform better in downturns, as investors flock to safe assets.
Over the last two decades, China and India have been the growth engines, while the U.S. has remained the financial powerhouse.
9. Case Study: 2008 Financial Crisis vs COVID-19 Pandemic
2008 Crisis: Developed markets (U.S., Europe) were hit hardest due to financial exposure. Emerging markets recovered faster, supported by China’s stimulus.
COVID-19 Pandemic: Emerging markets struggled due to weak healthcare and high debt, while developed economies used fiscal stimulus and central banks to stabilize markets.
This highlights how resilience differs across categories.
10. Future Outlook
Emerging Markets: Expected to drive global growth due to demographics, urbanization, and technology adoption. India and Southeast Asia are especially promising.
Developed Markets: Will remain leaders in innovation, finance, and global institutions. However, slower growth and aging populations will challenge long-term momentum.
Integration: The line between emerging and developed is blurring. Countries like South Korea, Singapore, and Taiwan once considered “emerging” are now closer to developed status.
Conclusion
The distinction between emerging markets and developed markets is fundamental in understanding global economics and finance. Emerging markets offer growth, opportunities, and dynamism, while developed markets provide stability, maturity, and reliability.
For investors, businesses, and policymakers, the choice is not about preferring one over the other but about balancing exposure to both. A diversified portfolio that captures the growth of emerging markets while relying on the stability of developed markets is often the most effective approach.
The future will likely see more emerging economies transition into developed ones, reshaping the global economic order. India, China, and parts of Africa may become the next growth engines, while developed countries will continue leading in technology and governance.
In summary, emerging markets are the growth frontier, while developed markets remain the anchors of global stability. Understanding their differences is key to navigating global finance and economics.
BTC 5th halving : $423,600 (minimum) Predicting Q1 of 2032
Im almost certain BTC is nearing the end of its current bull run cycle. So Im getting ready to find the bottom of the 4th Halving's run to prepare for the 5th Halving's peak

Testing snap shotI never really got the hang of publishing ideas , which sucks because I have been spot on with my predictions
Btcusd fridayIt’s happening btc is going a bit high and then higher then higher because of the falling usd in Friday session

BIG BTC Upswing coming upMy Trade idea is based on Moving Averages, Momentum, Volume profiles and Bollinger Bands

Bitcoin to $500K by 2028–2030Institutional Adoption, Scarcity, and the Devaluation of the Dollar
The question of whether Bitcoin could reach the half‑million mark within the next five to seven years is increasingly debated among investors, economists, and institutions alike. While such projections still carry uncertainty, several converging trends suggest that a $500,000 valuation for Bitcoin by 2028–2030 is within the realm of possibility. These drivers include the rapid pace of institutional adoption, Bitcoin’s fixed supply, its growing narrative as a store of value, the potential role of national reserves, and a macroeconomic backdrop defined by inflation and dollar devaluation. Additionally, the long‑term holding behavior of Bitcoin investors has reduced circulating supply, further amplifying the scarcity effect.
1. Institutional Adoption via ETFs and Beyond
The approval and growth of Bitcoin exchange-traded funds (ETFs) in major financial markets mark a watershed moment in the asset’s mainstream acceptance. These vehicles simplify access for institutional investors that were previously constrained by custody and regulatory hurdles. Pension funds, endowments, and sovereign wealth funds are now able to allocate to Bitcoin through regulated channels.
As demand from professional investors grows, the inflows through ETFs act as a continual buy‑side force. Unlike speculative retail buying sprees of previous cycles, institutional allocations are more structured and long‑term oriented, potentially anchoring a more stable demand floor. This steady absorption of supply is expected to become one of the strongest catalysts for Bitcoin price growth this decade.
2. Fixed Supply: The Scarcity Engine
Bitcoin’s most unique feature is its hard‑coded supply cap: only 21 million coins will ever exist . This mathematical certainty contrasts starkly with fiat currencies, where central banks can expand money supply indefinitely. Halving events, which reduce the block rewards of mining BTC roughly every four years, further accelerate scarcity.
By 2030 , the annual mining of Bitcoin will be minuscule compared to today, limiting fresh supply even as institutional demand scales up. In classical economic terms, a growing demand against a fixed or declining supply can only result in upward price pressure.
3. Store of Value in an Inflationary World
The past decade has demonstrated how inflation and monetary expansion distort asset markets. As governments print more money to finance debt and expenditures, investors increasingly seek hedges against the erosion of purchasing power. Historically, gold has played this role.
Bitcoin, with its transportability, divisibility, verifiability, and digital-native characteristics, is now increasingly seen as a modern alternative or complement to gold. If Bitcoin even partially captures the $13+ trillion gold market as a store of value, valuations well above $500,000 per coin become mathematically plausible.
4. Bitcoin as a Component of National Reserves
While still early, several nations are exploring or experimenting with holding Bitcoin in their reserves. For countries facing dollar dependency or geopolitical pressures, Bitcoin provides a neutral, censorship‑resistant reserve asset that reduces reliance on the U.S. financial system.
Should more governments follow El Salvador’s lead or allocate even a small percentage of their foreign reserves to Bitcoin, global reserve demand could represent a massive new buyer base. Even marginal allocations at a sovereign level would create outsized effects due to Bitcoin’s relatively small market capitalization compared to global reserves.
5. The Dollar, Inflation, and Asset Price Revaluation
The U.S. dollar, while still dominant, faces structural challenges: ballooning government debt, persistent fiscal deficits, and the need for monetary expansion to sustain growth. Increased money supply historically leads to currency debasement. As purchasing power erodes, asset prices, from equities to real estate to scarce stores of value like Bitcoin, tend to reprice higher in nominal dollar terms.
Thus, Bitcoin’s potential ascent to $500,000 is not solely about Bitcoin “going up,” but also about the dollar “going down.” In this sense, the milestone is as much a reflection of fiat devaluation as it is of Bitcoin adoption.
6. The Supply Dynamics: 80% Already Parked
On‑chain analytics highlight another critical factor: roughly 80% of Bitcoin supply is currently held by long‑term investors in “dormant” wallets, seldom moved or sold. This indicates that a large portion of the supply is illiquid, effectively taken off the market.
When institutions, retail newcomers, or governments try to acquire Bitcoin in size, they will be competing over the thin slice of supply available for trade. This dynamic creates a potential supply squeeze, which historically has been one of the key drivers of Bitcoin’s parabolic price advances.
Conclusion: A Plausible Milestone, But With Volatility Along the Way
Projecting Bitcoin to $500,000 by 2028–2030 is not simply speculation, it is a thesis grounded in identifiable trends: institutional adoption through ETFs, a mathematically capped supply, Bitcoin’s emerging status as digital gold, the potential for sovereign reserve adoption, and macroeconomic tailwinds fueled by dollar debasement.
However, it is important to note that Bitcoin’s journey will not be linear. Volatility, regulatory battles, and shifts in global macro conditions will shape the trajectory. Yet, the combination of structural scarcity and rising global demand makes the possibility of half‑a‑million per coin a credible long‑term scenario.
#crypto #bitcoin #finance #defi #economy #portfolio #digital #blockchain #trading #asset

BTC Short Setup ideaLooking to short BTC at 110,400
🎯 Targets:
TP1: 108,000
TP2: 107,620
🛑 Stop Loss: 110,600
Risk/Reward looking solid for this short-term move. Watching price action closely around entry zone for confirmation. Trade safe!
#BTC #Bitcoin #CryptoTrading #ShortSetup #TechnicalAnalysis
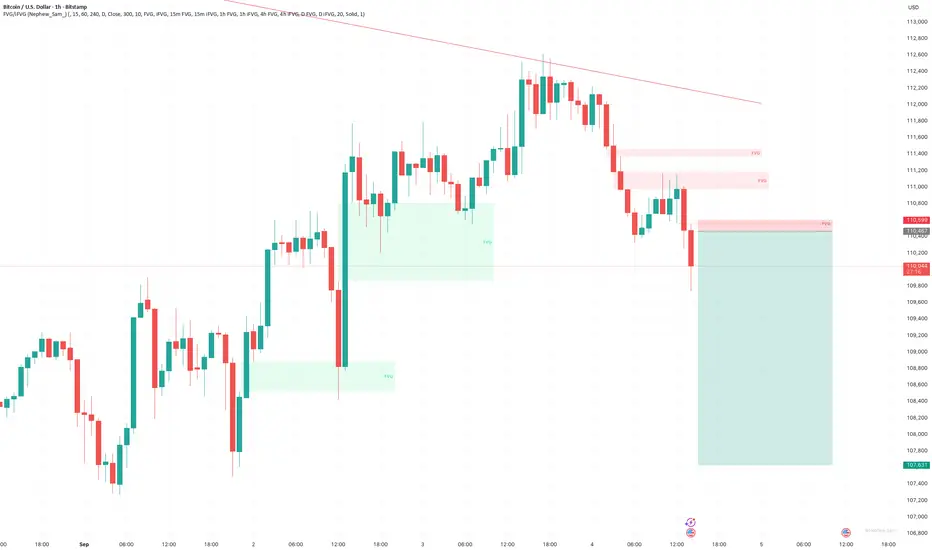
BTC Breaks the Trendline but Fails to Hold Above Key ZoneBitcoin broke the trendline but failed to hold above the blue zone

BTCUSD🚀 BTCUSD – 1H Time Frame Setup
📈 BTC is making HHs & HLs (short-term bullish structure).
🔑 Tried to break resistance 111,835 – 112,000 thrice ❌ — possible breakout on the 4th or 5th attempt.
⏳ 4H & Daily trend still bearish ⚠️ → trade with caution.
Currently Ranging!
💡 Trading Plan:
✅ Look for a bullish candle confirmation before entry.
🎯 Partial booking recommended at TP1 → must manage risk after first target.
🛑 Always protect profits / adjust SL.
📊 Best setup if BTC comes near 0.5 Fib (≈ 6.08 level) and then breaks above 111,835 – 112,000 🔓

BTC IS STRUGGLINGBitcoin closed just below $112,000 yesterday, once again underscoring the significance of this level as the key resistance in the current structure. That zone has been the battleground for weeks now – and while bulls have managed to defend support around $108K–$109K, they’ve yet to prove they can flip $112K into support.
The pattern is becoming increasingly clear: unless BTC can push and hold above $112K, it risks putting in another lower high. Sellers continue to step in at this level, keeping upward momentum capped and forcing price to oscillate within a narrowing range.
On the downside, the shaded support region at $108K–$109K remains the line in the sand for bulls. A breakdown there would expose the long-term trendline and major support closer to $101K. Until then, Bitcoin is trapped in a well-defined range, with $112K as the ceiling that must break to shift momentum decisively back in favor of the bulls.

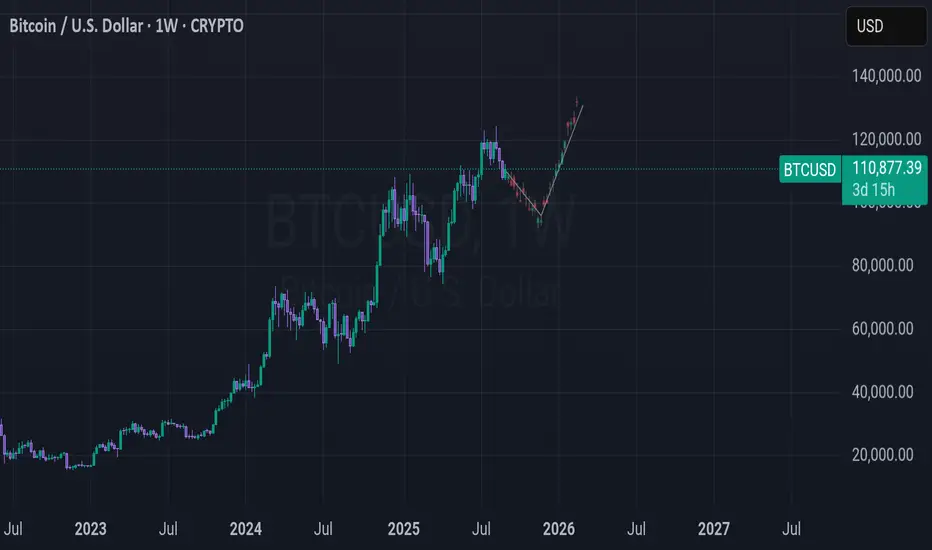
BTC (expected pattern)The chart shows Bitcoin moving in a downtrend followed by a sharp rebound upward. The projection suggests that if major unexpected events occur (for example, if Donald Trump were to pass away), Bitcoin could surge dramatically ‘to the moon.
Bitcoin, Ethereum & XMR September UpdateBitcoin edges lower as traders turn cautious ahead of U.S. jobs data and amid uncertainty over tariffs. The ADP private payrolls report is due at 1215 GMT and weekly jobless claims are at 1230 GMT followed by Friday's highly-anticipated nonfarm payrolls data.
This could lead to a sell-off in the crypto space, seeing BTCUSD reaching BISI imbalances @ $98,225 - $95,976,
ETHUSD to $3,354 - $2,880.
XMRUSD (Monero) is currently trading inside of a bullish inefficiency; between $265.12 - $235.06.

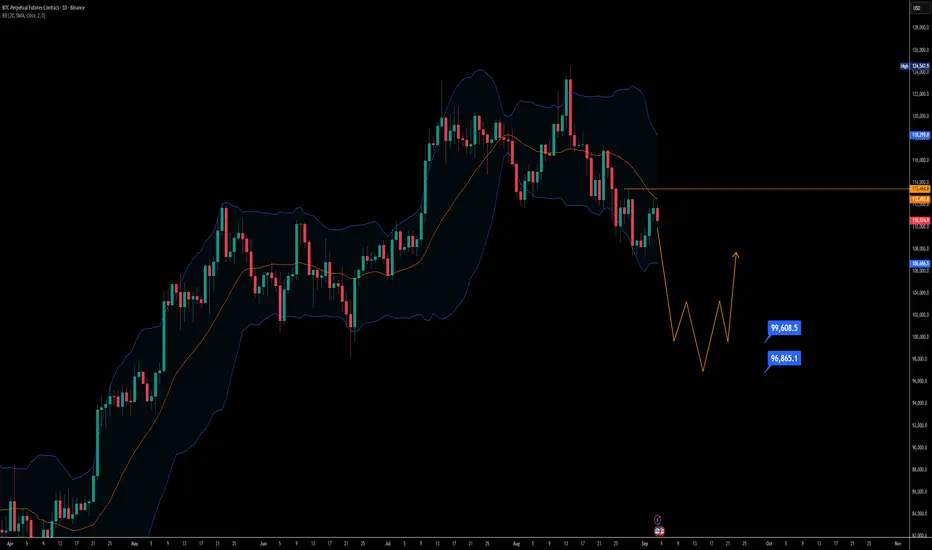
Bitcoin daily chart shows rejection at SMA with supports near 99On the daily timeframe, Bitcoin is showing a clear rejection from the Bollinger Band 20 SMA. This zone is acting as resistance, aligning with the market’s failure to sustain the previous lower high. At the same time, the structure has been printing a series of higher lows, keeping the bullish bias alive for now.
For momentum to shift strongly upward, BTC would need to break above $130,500, which would confirm a new higher high. However, if this does not happen and today’s daily candle closes red, it would signal the formation of another higher low without confirmation of an uptrend. This setup leans toward a bearish outlook in the short term.
Key supports to watch lie between the $99,000 and $96,000 zones, where a temporary bounce could occur. A sustained move below these levels could open the path for deeper downside continuation.
Targets: Short-term focus remains on the $99,000 area as a key support and possible bounce zone.
Trendline BreakThe price has broken out of a long bearish trendline, followed by a pullback, now the price looks to make a higher high and continue long
WE ONLY TRADE PULLBACKS
Comment your thoughts

CautionThe Bulls recently had a bullish breakout on the daily which is encountering resistance at the 21 EMA on the daily. However, last candle on the weekly brought in a bearish MACD(Chris Moody) on the weekly chart. Bulls be careful the bears are still lurking. Bulls need price to overcome 108K on the weekly. Thank you for your time

“BTCUSD Road to 120K – But Watch the Trap Ahead!”“BTCUSD 🚀 Road to 120K – But Watch the Trap Ahead!”
Bitcoin has shown strong momentum after a liquidity sweep around 108,000, signaling that big players collected orders before pushing price higher. This is a common smart money concept (SMC) move where liquidity is grabbed before the next leg.
🔑 Key Points to Note:
Previous Support Flip: Market reclaimed the broken support, turning it into a base for continuation.
Upside Target: The next major resistance zone is 120,000 – 123,000, where sellers are likely to step in.
Market Behavior: Price often sweeps liquidity before testing strong resistance, so patience is key.
Potential Pullback: Once resistance is tapped, a correction may follow as profit-taking starts.
📌 Educational Takeaway: Always watch how price reacts at liquidity zones and key resistance points. These levels often decide whether the trend will continue or reverse.
📈 For now, short-term bias = bullish toward 120,000, but be cautious for a possible rejection at that zone.

BITCOIN LIVE CHARTBitcoin has been trading lower since hitting all time high 'ATH' back in august, thus it is suggesting a bearish shift in momentum.
am expecting lower prices on bitcoin, preferably i want to see liquidity sweep at 113500 price before a continuation to the down side.

BTCUSD Update Watching key resistance — a break and retest could push price toward 117k+. If rejected, I’ll wait for buys near 111k–110.5k.
