BTCUSD🚀 BTCUSD – 1H Time Frame Setup
📈 BTC is making HHs & HLs (short-term bullish structure).
🔑 Tried to break resistance 111,835 – 112,000 thrice ❌ — possible breakout on the 4th or 5th attempt.
⏳ 4H & Daily trend still bearish ⚠️ → trade with caution.
Currently Ranging!
💡 Trading Plan:
✅ Look for a bullish candle confirmation before entry.
🎯 Partial booking recommended at TP1 → must manage risk after first target.
🛑 Always protect profits / adjust SL.
📊 Best setup if BTC comes near 0.5 Fib (≈ 6.08 level) and then breaks above 111,835 – 112,000 🔓
BTCMINI trade ideas

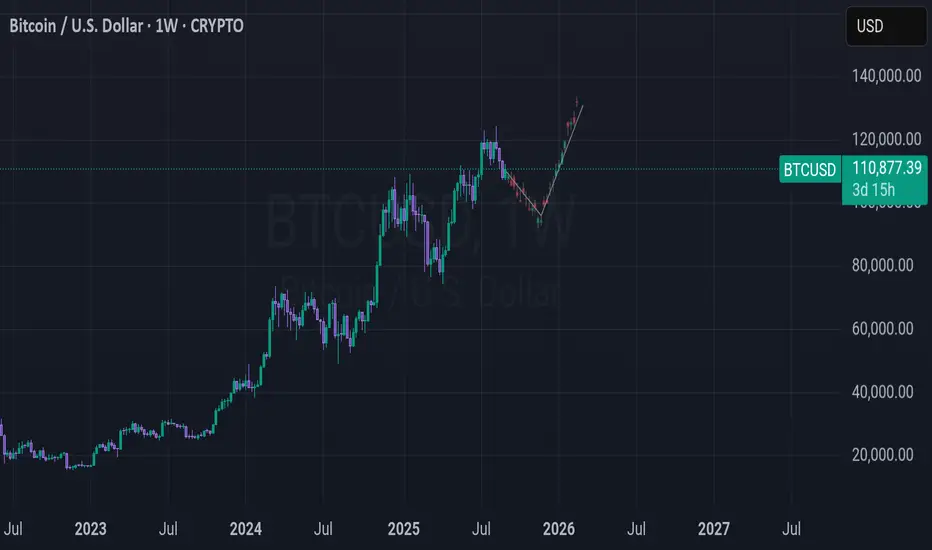
BTC IS STRUGGLINGBitcoin closed just below $112,000 yesterday, once again underscoring the significance of this level as the key resistance in the current structure. That zone has been the battleground for weeks now – and while bulls have managed to defend support around $108K–$109K, they’ve yet to prove they can flip $112K into support.
The pattern is becoming increasingly clear: unless BTC can push and hold above $112K, it risks putting in another lower high. Sellers continue to step in at this level, keeping upward momentum capped and forcing price to oscillate within a narrowing range.
On the downside, the shaded support region at $108K–$109K remains the line in the sand for bulls. A breakdown there would expose the long-term trendline and major support closer to $101K. Until then, Bitcoin is trapped in a well-defined range, with $112K as the ceiling that must break to shift momentum decisively back in favor of the bulls.

BTC (expected pattern)The chart shows Bitcoin moving in a downtrend followed by a sharp rebound upward. The projection suggests that if major unexpected events occur (for example, if Donald Trump were to pass away), Bitcoin could surge dramatically ‘to the moon.
Bitcoin, Ethereum & XMR September UpdateBitcoin edges lower as traders turn cautious ahead of U.S. jobs data and amid uncertainty over tariffs. The ADP private payrolls report is due at 1215 GMT and weekly jobless claims are at 1230 GMT followed by Friday's highly-anticipated nonfarm payrolls data.
This could lead to a sell-off in the crypto space, seeing BTCUSD reaching BISI imbalances @ $98,225 - $95,976,
ETHUSD to $3,354 - $2,880.
XMRUSD (Monero) is currently trading inside of a bullish inefficiency; between $265.12 - $235.06.

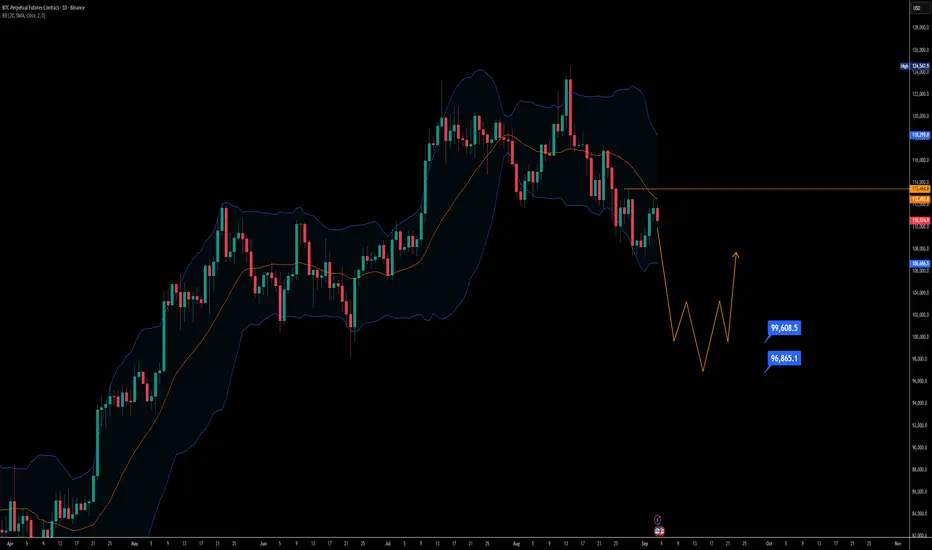
Bitcoin daily chart shows rejection at SMA with supports near 99On the daily timeframe, Bitcoin is showing a clear rejection from the Bollinger Band 20 SMA. This zone is acting as resistance, aligning with the market’s failure to sustain the previous lower high. At the same time, the structure has been printing a series of higher lows, keeping the bullish bias alive for now.
For momentum to shift strongly upward, BTC would need to break above $130,500, which would confirm a new higher high. However, if this does not happen and today’s daily candle closes red, it would signal the formation of another higher low without confirmation of an uptrend. This setup leans toward a bearish outlook in the short term.
Key supports to watch lie between the $99,000 and $96,000 zones, where a temporary bounce could occur. A sustained move below these levels could open the path for deeper downside continuation.
Targets: Short-term focus remains on the $99,000 area as a key support and possible bounce zone.
Trendline BreakThe price has broken out of a long bearish trendline, followed by a pullback, now the price looks to make a higher high and continue long
WE ONLY TRADE PULLBACKS
Comment your thoughts

CautionThe Bulls recently had a bullish breakout on the daily which is encountering resistance at the 21 EMA on the daily. However, last candle on the weekly brought in a bearish MACD(Chris Moody) on the weekly chart. Bulls be careful the bears are still lurking. Bulls need price to overcome 108K on the weekly. Thank you for your time

“BTCUSD Road to 120K – But Watch the Trap Ahead!”“BTCUSD 🚀 Road to 120K – But Watch the Trap Ahead!”
Bitcoin has shown strong momentum after a liquidity sweep around 108,000, signaling that big players collected orders before pushing price higher. This is a common smart money concept (SMC) move where liquidity is grabbed before the next leg.
🔑 Key Points to Note:
Previous Support Flip: Market reclaimed the broken support, turning it into a base for continuation.
Upside Target: The next major resistance zone is 120,000 – 123,000, where sellers are likely to step in.
Market Behavior: Price often sweeps liquidity before testing strong resistance, so patience is key.
Potential Pullback: Once resistance is tapped, a correction may follow as profit-taking starts.
📌 Educational Takeaway: Always watch how price reacts at liquidity zones and key resistance points. These levels often decide whether the trend will continue or reverse.
📈 For now, short-term bias = bullish toward 120,000, but be cautious for a possible rejection at that zone.

BITCOIN LIVE CHARTBitcoin has been trading lower since hitting all time high 'ATH' back in august, thus it is suggesting a bearish shift in momentum.
am expecting lower prices on bitcoin, preferably i want to see liquidity sweep at 113500 price before a continuation to the down side.

BTCUSD Update Watching key resistance — a break and retest could push price toward 117k+. If rejected, I’ll wait for buys near 111k–110.5k.

BTC TA BITSTAMP:BTCUSD has now completed a full Elliott 8-wave fractal sequence on the daily chart. Importantly, we are seeing bullish divergence on both the CMF and CCI, while the bull flag measured move aligns directly with the 141.4%–161.8% Fibonacci extension taken from Wave 5 to the pullback Wave C.
Volume-based confirmation is present, with OBV and ADL both moving in agreement, signalling accumulation and directional consistency. Current resistance is at 124,517, with upside Fibonacci targets projected in the 144–149k region.
For confirmation, traders should watch closely for breaks of the symmetrical triangles forming inside both the CCI and CMF, these will provide early signals of trend continuation or reversal. Once momentum confirmation is seen, price action itself can be used as the final trigger.

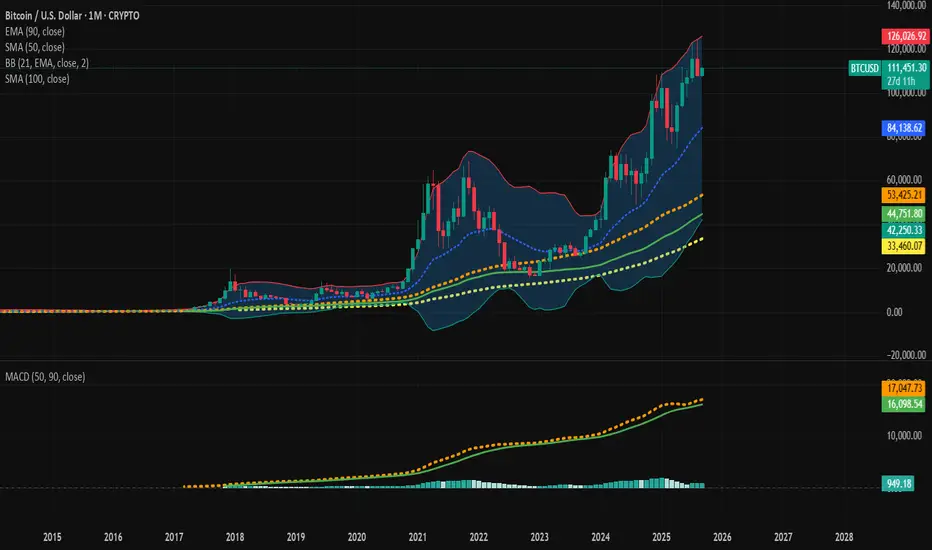
Bitcoin – Between Equilibrium and Transcendence.⊣
⟁ BTC/USD – BINANCE – (CHART: 1M) – (Sep 03, 2025).
◇ Analysis Price: $111,148.95.
⊣
⨀ I. Temporal Axis – Strategic Interval – (1M):
▦ EMA90 – $44,745.16:
∴ Deep-cycle moving average, historically preserved through bull markets;
∴ Distance buffer ≈ +$66.40K (+59.7%) above EMA90;
∴ No tests since the 2020 breakout -> macro trend intact.
✴️ Conclusion: EMA90 = deep structural anchor (bullish fortress intact).
⊢
▦ SMA50 – $53,419.17:
∴ Primary macro floor for post-halving cycles;
∴ Price stands +$57.73K (+51.9%) above this line;
∴ First high-timeframe defense in a major correction.
✴️ Conclusion: SMA50 = medium-term guardian support.
⊢
▦ SMA100 – $33,457.05:
∴ Extreme long-term anchor, rarely approached outside bear capitulations;
∴ Cushion +$77.69K (+69.9%) above;
∴ “Black-swan” only in current cycle context.
✴️ Conclusion: SMA100 = last-resort macro base.
⊢
▦ BB (21 ,2) - (Midline $84,111.14 / Upper $125,959.23 / Lower $42,263.04):
∴ Price rides the upper regime, sitting ~13.3% below the upper band (headroom ≈ $14.81K);
∴ Distance to midline (equilibrium) ≈ $27.04K (+24.3%) -> strong cushion;
∴ Bands are widened -> volatility expansion phase of the macro trend.
✴️ Conclusion: BB = mature expansion; (midline $84.1K) is the balance axis.
⊢
▦ MACD (50, 90) - (Line 947.03 / Signal 17,045.04 / Histogram 16,098.01):
∴ Long-cycle configuration filters noise and tracks halving waves;
∴ Histogram magnitude strong -> impulse still alive at the macro scale;
∴ No imminent bearish crossover on this slow setting; trend health preserved.
✴️ Conclusion: MACD = bullish regime with durable momentum.
⊢
🜎 Strategic Insight – Technical Oracle:
∴ Structure: Price is well above all macro bases (SMA50 $53.4K, EMA90 $44.7K, SMA100 $33.5K) and operating in the upper Bollinger regime; (midline $84.1K) marks the structural equilibrium;
∴ Momentum - (single pillar): MACD (50, 90) remains decisively positive, consistent with a continuing bull cycle;
∴ Risk rails: Upside trigger = sustained push toward/through ($125.96K - BB-upper); downside mean-reversion rails = ($99–$84K - prior clusters/BB mid).
✴️ Conclusion: The monthly chart remains Bullish-Structural and in mature expansion. As long as Bitcoin holds above the (BB midline ~$84.1K), the macro up-cycle stays intact; clearance toward ($126K) would reopen upside discovery.
⊢
𓂀 Stoic-Structural Interpretation:
✦ Structure of Trend:
∴ The price hovers far above the macro fortresses (SMA50 $53.4K, EMA90 $44.7K, SMA100 $33.5K). These remain untouched, signaling the structure’s resilience;
∴ Bollinger (midline at $84.1K) is the true axis of equilibrium: as long as it holds, the market breathes in the upper realm of expansion;
∴ The upper Bollinger bound ($125.9K) is not yet pierced, leaving the cycle suspended between present strength and future compression.
✦ Momentum of Will:
∴ The MACD (50, 90), slow and deliberate, projects a force aligned with the long halving waves: histogram positive, crossover intact, momentum unfaltering;
∴ The market’s will remains bent toward continuation, though each candle at this altitude tests the resolve of buyers;
∴ Stoic principle: strength endures until proven otherwise; momentum persists until equilibrium demands balance.
✦ Flow of Capital:
∴ Wide Bollinger bands whisper volatility unchained, inviting both euphoria and caution; liquidity expands but seeks its balance at the ($84.1K mid);
∴ Capital rotates but does not abandon the structure; the exodus of liquidity is absent from the long frame;
∴ The inflow of discipline dominates - patience governs capital flows.
✦ Interpretation of Fate:
∴ Above ($125.9K) = release into new discovery, fate embraces uncharted peaks;
∴ Between ($99K and $84K) = mean-reversion crucible, where structure is tested but not destroyed;
∴ Below ($84K) = stoic descent, a return toward (SMA50 / EMA90) bastions.
✴️ Conclusion: The monthly essence is Bullish-Structural, with fate aligned to the continuation of expansion. Yet, Stoicism reminds: no trend ascends without pause; ($84.1K) is the sacred balance, ($125.9K) the gate to transcendence.
⊢
· Cryptorvm Dominvs · MAGISTER ARCANVM · Vox Primordialis ·
· Dominivm Cardo Gyratio Omnivm · Silence precedes the next force. Structure is sacred ·
⊢
btc levels btc has broken out after testing 110472 level with a low of 110200 im still looking at 113722 level as resistance so we see if we can hold 112223 move stops up to 112002 to lock in profits if in long

BTC perfect golden pocket bounce to 117500BTC perfect golden pocket bounce to 117500
From there, we'll probably get a rejection then get another golden pocket bounce right in time with the fed rate cut in weeks.
I think this is the last push of the bull run.

Bitcoin Strategy: The Rally Will ContinueWhile Bitcoin's recent rebound has been slow, the upward trend has been remarkably consistent, with bullish momentum gaining strength. I remain bullish on a Bitcoin rebound.
Recent market trends indicate strong support below 110,000, particularly around the previous support level of 107,200. Multiple pullbacks have failed to break below this level. After repeated support tests, this support level has consolidated, triggering a new round of gains. The price has now stabilized above 110,000, putting the 112,000 level I anticipated a few days ago within reach.
Bitcoin Strategy
Recent long positions have successfully reached their target levels, and my strategy remains unchanged. Technical indicators consistently point to a bullish outlook. In the short term, I remain bullish on Bitcoin, and if the price retraces to around 110,000, I'll continue to open long positions.

BTC/USDBitcoin has broken out of its downtrend and broken out of the channel. It appears poised for new records. The same applies to SOL, AVAX, DOGE, and ADA, which are all trading together.
This is not investment advice.
I wish everyone good luck.

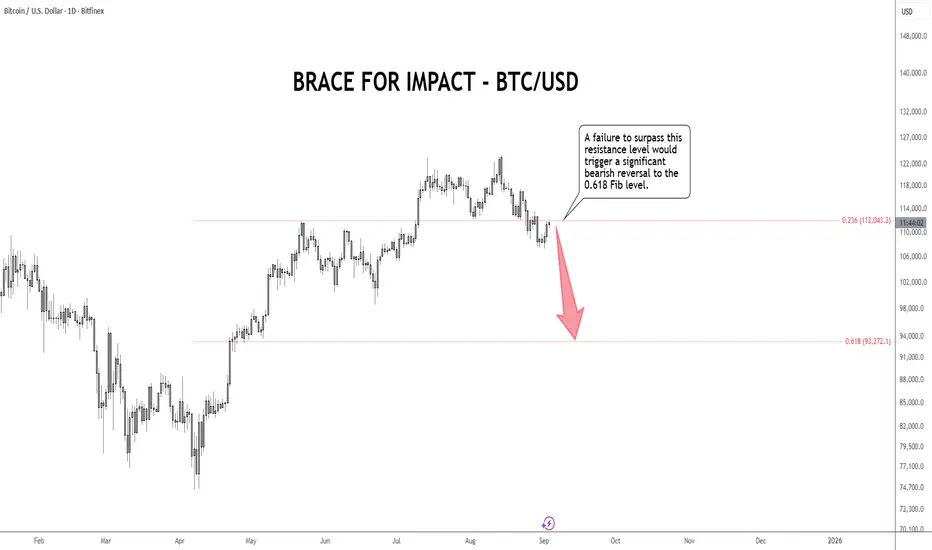
Bitcoin Price at a Crossroads: Fibonacci Defines the Next MoveBitcoin is testing a critical technical juncture. A rejection at the 0.236 Fibonacci retracement resistance is likely to catalyze a significant corrective move. The primary downside target for such a bearish reversal is the key 0.618 Fibonacci support level. A break below this support would signal a deeper retracement of the prior trend.
BTCUSD Intraday Move 03.09.2025🔹 Bias: Bullish Channel Structure
BTCUSD is moving strongly within an ascending channel, respecting FVGs along the way and maintaining bullish momentum.
🔹 Key Level – 111,600
A decisive close above 111,600 will confirm strength and open the path for continuation toward higher liquidity pools. This level also aligns with channel midline and prior consolidation, making it a pivotal breakout zone.
🔹 Retest as Entry Trigger
The ideal plan is to wait for a clean breakout and candle close above 111,600, followed by a controlled retest of this zone. If demand re-enters here, it validates buyers’ control and offers a low-risk entry.
🔹 Upside Target – 113,482
Once 111,600 holds as support, price has room to push toward 113,482, where liquidity rests near channel resistance.
🔹 Risk Management
Invalidation lies below 111,000, where the most recent demand and FVG structure would fail.
👉 Trade Plan: Close above 111,600 → Retest → Long entry → Target 113,482 with stops below 111,000.

BITCOIN BULLISH BIAS RIGHT NOW| LONG
BITCOIN SIGNAL
Trade Direction: long
Entry Level: 111,368.88
Target Level: 119,727.44
Stop Loss: 105,796.50
RISK PROFILE
Risk level: medium
Suggested risk: 1%
Timeframe: 1D
Disclosure: I am part of Trade Nation's Influencer program and receive a monthly fee for using their TradingView charts in my analysis.
✅LIKE AND COMMENT MY IDEAS✅

BTCUSD Roadmap UpdateBitcoin has shown its hand
As always, it is mucky and full of false moves :)
We run into November!
Not financial advice

BTCUSD Bircoin drop, sell your minning farm, but just for nowThis Diagonal is still valid for me, selll @ 113.400
Targets 105.000 / 102.000 and 99.000
GG

Has Bitcoin's long-short trend reversed?Recently, Bitcoin has demonstrated strong resilience at the key support level of 107,000: this level has undergone multiple downward tests, with no effective breakdown occurring; instead, it has rebounded quickly after each touch, confirming the market recognition of this support zone and the strength of buying interest. As the bottom support is confirmed, the price momentum has gradually strengthened and has now successfully broken through the previous resistance level on the 4-hour timeframe. Technically, a bullish structure of "valid support - broken resistance" has been formed, and the short-term trend has shifted from consolidation to a bullish bias. Based on this market change, our trading strategy needs to be adjusted accordingly: we can take a small-position long trade when the price retraces to the support level.

BTCUSD bullish breakout supported at 109,040The BTCUSD remains in a bullish trend, with recent price action showing signs of a corrective pullback within the broader uptrend.
Support Zone: 109,040 – a key level from previous consolidation. Price is currently testing or approaching this level.
A bullish rebound from 109,040 would confirm ongoing upside momentum, with potential targets at:
115,420 – initial resistance
117,400 – psychological and structural level
119,260 – extended resistance on the longer-term chart
Bearish Scenario:
A confirmed break and daily close below 109,040 would weaken the bullish outlook and suggest deeper downside risk toward:
106,470 – minor support
104,340 – stronger support and potential demand zone
Outlook:
Bullish bias remains intact while the BTCUSD holds above 109,040. A sustained break below this level could shift momentum to the downside in the short term.
This communication is for informational purposes only and should not be viewed as any form of recommendation as to a particular course of action or as investment advice. It is not intended as an offer or solicitation for the purchase or sale of any financial instrument or as an official confirmation of any transaction. Opinions, estimates and assumptions expressed herein are made as of the date of this communication and are subject to change without notice. This communication has been prepared based upon information, including market prices, data and other information, believed to be reliable; however, Trade Nation does not warrant its completeness or accuracy. All market prices and market data contained in or attached to this communication are indicative and subject to change without notice.
