BTC pending for long to $140001. Accumulate Area is done prepared, waiting for break higher
2. Retracing may happen due to RSI reaching peak
3. Waiting the price bounce up at Channel Support line before decided to long
4. Long to $14000
BTCUSD.P trade ideas

Bitcoin is bullish now & many Traders don't see it !!!As you can see, the price has formed a triangle over the past 4 months, whose bullish or bearish nature will be determined after its breakout. The corrective Elliott waves(abc) are currently completing the final wave, which indicates that a potential price increase is on the way. The price seems to have completed the corrective wave, and from now on, it's time for a price increase, which will continue up to around $130k .

BTC Trend Continuation Trading with Fibonacci and Price Action📹 In this video, I break down a powerful trend continuation strategy as we look at a BTC Bitcoin chart designed to help you identify high-probability trading setups 🎯.
📊 We’ll dive nto using the Fibonacci retracement tool alongside consistent, repeatable price action patterns that tend to appear in strong trends. When a specific setup reveals itself, that’s when we look to take advantage of the opportunity.
📈 The focus is on recognizing higher highs and higher lows in a bullish market structure, understanding how to align with momentum, and building confidence in trading the continuation of trend direction 🚀.
⚠️ Disclaimer: This content is for educational purposes only and not financial advice. Always manage your risk and trade responsibly.

BTC Q4 - updateUpdating the previous idea where it feels it all was shifted a few days earlier. Apart form that the the shape of the recovery and the way it happened largely fall into what was expected.

Bitcoin Trap or Breakout? Triple Top or Hidden Accumulation? Bitcoin is stalling at key resistance after a massive rally… but is this a distribution trap before a pullback, or accumulation building for the next breakout?
Huge volume with small candles and declining momentum raises the question: Are we topping, or loading for liftoff?
Watch the chart, decide for yourself and share your thoughts in the comment section — Distribution or Breakout?
Thanks for your time

BITCOIN Will Go Higher From Support! Long!
Here is our detailed technical review for BITCOIN.
Time Frame: 1D
Current Trend: Bullish
Sentiment: Oversold (based on 7-period RSI)
Forecast: Bullish
The market is on a crucial zone of demand 122,787.24.
The oversold market condition in a combination with key structure gives us a relatively strong bullish signal with goal 130,283.78 level.
P.S
The term oversold refers to a condition where an asset has traded lower in price and has the potential for a price bounce.
Overbought refers to market scenarios where the instrument is traded considerably higher than its fair value. Overvaluation is caused by market sentiments when there is positive news.
Like and subscribe and comment my ideas if you enjoy them!

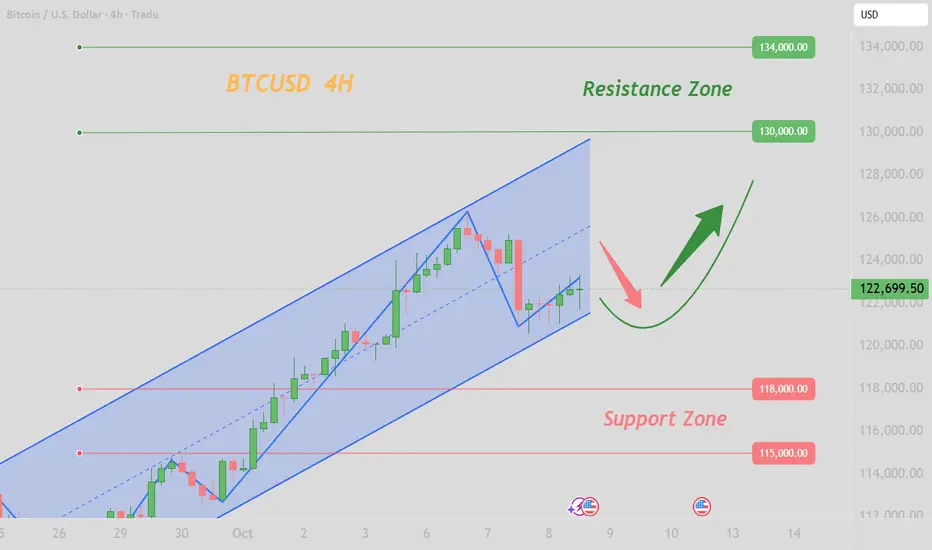
BTCUSD: Navigating the 123K ZoneBTCUSD: Navigating the 123K Zone
Bitcoin (BTCUSD) on the 4-hour timeframe has experienced a recent pullback, currently trading around 122K, and is encountering resistance at the "123K" zone within its ascending channel.
Renewed bullish momentum is contingent on a decisive breakout and sustained trading above the "123K" resistance, targeting the "126.5K ATH" with close monitoring of price action near "125K."
Immediate downside protection is provided by the "120K-121K Immediate Support" area, which is vital for maintaining the short-term uptrend and preventing deeper corrections within the channel.
Should immediate support fail, the "118K to 119K - Previous Breakout" level is anticipated to offer robust support, with "115K Good Support" and the "112K-113K Important Level" underlying the broader bullish structure.
Disclaimer:
The information provided in this chart is for educational and informational purposes only and should not be considered as investment advice. Trading and investing involve substantial risk and are not suitable for every investor. You should carefully consider your financial situation and consult with a financial advisor before making any investment decisions. The creator of this chart does not guarantee any specific outcome or profit and is not responsible for any losses incurred as a result of using this information. Past performance is not indicative of future results. Use this information at your own risk. This chart has been created for my own improvement in Trading and Investment Analysis. Please do your own analysis before any investments.

BTCUSD Bullish Confirmations Within An H4 Demand ZoneDouble Confluence within A demand zone. Price has swept liquidity within demand.
There is a double bottom rejection pattern and a bullish flag.
The trend is Still Your Friend.

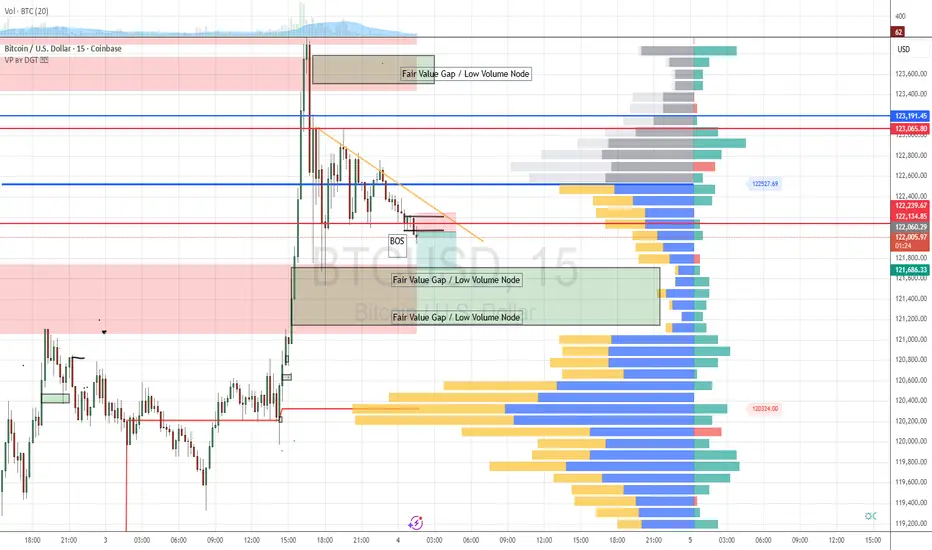
Post-ATH Setup: Targeting Fair Value Gap After Channel BreakA new all-time high (ATH) was reached today. The sudden impulse created a significant Fair Value Gap (FVG) / Low Volume Node (LVN), which the market appears eager to fill.
After the breakout of the current order flow channel, I’m waiting for confirmation before entering. I plan to take a 1:2 risk-to-reward trade targeting the Fair Value Gap area, in line with the prevailing downtrend.
The current narrative suggests that buyers are not interested in buying at the top and are waiting for a pullback.
BTC/USD 08/10/2025BTCUSD
We are inside a rectangle pattern, which in most cases is broken downwards, as it is a continuation pattern. It follows that a drop below 120.600 USD opens the door to a drop to the red boxes in the chart below.
Since errors also can occur in patterns, we should not ignore the upper orange box. In this case, the rectangle pattern will be invalidated and a rise to the green boxes, which are quite high, may occur.
In this case, BTC should exceed 122,400 USD and this level represents the main level for observation in the upward direction.

BTC — Daily & 4H AnalysisBTC — Daily & 4H Analysis 📈
On the 4H timeframe, price has created a new Higher High (HH) and a Break of Structure (BOS).
The recent Mother Bar on the 4H chart was also violated to the upside, adding confirmation of a bullish continuation.
On the Daily chart, the candle has not yet closed — but if it closes above 124,481, that would confirm a new Higher High on the Daily as well.
Meanwhile, I’m watching for a reversal retracement on the 4H to give a buy confirmation.
My target is around 126,313.90
CAPITALCOM:BTCUSD

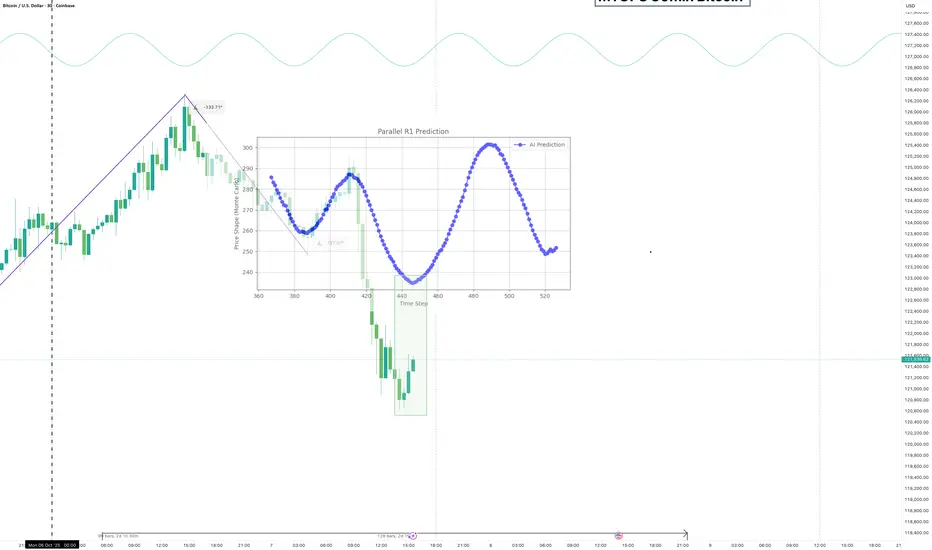
Wow, yet another great forecast. I just gets it!This is me testing a back-up model, should my base AI model have a bad day.
Yet again, the AI models just 'get' the markets better than I've seen a human get 'em.
BTC 4H UpdateIn the last chart, we projected four upside targets:
TP1: $127,398
TP2: $130,077
TP3: $1302,845
TP4: $134,000 – $135,000
Price action has been moving in line with that projection and is now approaching the first key target (TP1).
If price breaks and holds above $126,000, continuation toward $130,000 (TP2) and higher levels remains the main scenario.
If rejection occurs at any of these zones, a pullback into local supports is likely before the next leg higher.
The reaction around TP1 will be decisive in confirming whether the path toward $135,000 remains intact.
This is not financial advice. Trade according to your own plan and risk management.

BTC longs till ATHLast few posts haven't been the most accurate however all the longs were executed on SPOT and not leverage so the trades were still profitable none the less. Im seeing another opportunity to go for bitcoin longs here until ATH. This trade will be taken on leverage instead of SPOT due to the over extended nature of price.

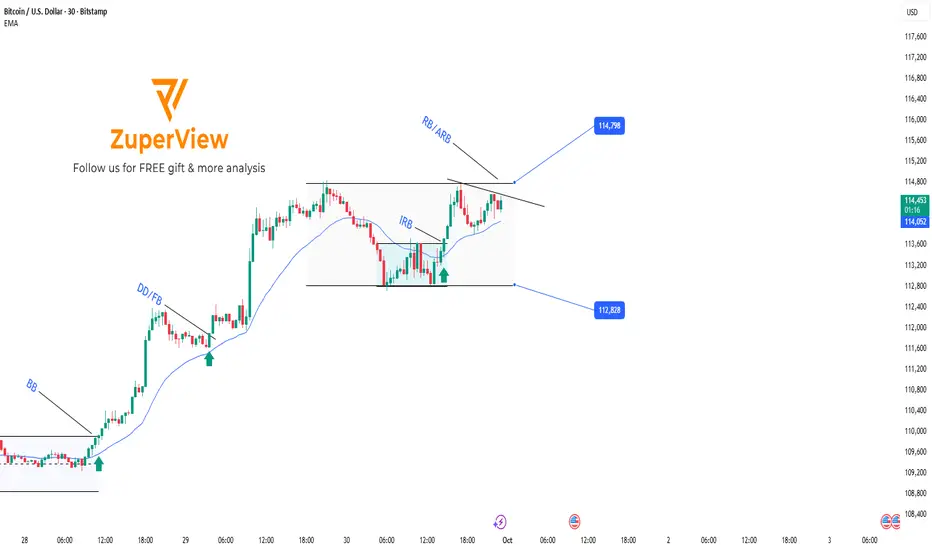
BTC breakout trading setupBITSTAMP:BTCUSD is currently consolidating within the 112,828–114,798 sideway range.
Earlier, the market broke out from a smaller accumulation inside the larger range, generating an IRB (Inside Range Break) signal, pushing price back toward the upper boundary.
Price is now forming a momentum consolidation, indicating potential for another breakout.
2 Possible Scenarios
1. RB (Range Break)
Price compresses further with EMA pressing tightly.
A strong breakout directly above the range top may occur with momentum.
2. ARB (Advance Range Break)
After breaking above the range, instead of continuing higher immediately, price may stall.
A new consolidation forms just above the broken range, with EMA pressing upward.
This setup may signal a continuation of the previous breakout move.
You can refer to my previous analysis here:
Please like and comment below to support our traders. Your reactions motivate us to do more analysis in the future 🙏✨
Daniel Miller @ ZuperView
Its A selling pivotbitcoin is likely to sell from today to go to 118k from now till and during the weekend.

BTC/USD – Four Possible Price Scenarios Ahead I Oct/09/2025The BTC/USD market is currently in a sensitive phase as the price consolidates around the liquidity zone and sits just above a key Demand zone. The short-term structure remains bearish, but signs of dip-buying are emerging as price approaches the 121k area.
Based on the 1H chart — combined with Volume Profile, Supply & Demand zones, and liquidity flow analysis — below are four possible price scenarios for the upcoming sessions, each with confirmation signals and actionable trading strategies:
🟩 Scenario 1 – Liquidity Sweep + Pullback to POC (Highest Probability ~45%)
🔹 Price Action:
Price continues to sweep slightly below the Liquidity Zone (around 121,700 – 121,300) to grab buy-side liquidity.
After the sweep, a long lower wick or bullish engulfing candle may appear — signaling recovery.
Price bounces back toward the POC zone (123,100 – 123,300).
Selling pressure then returns, causing a retest of the 122,000 area or lower.
🔹 Confirmation Signals:
Strong volume spike at the liquidity low.
Mild bullish divergence on RSI or OBV.
Candle closes above 122,200.
🔹 Trade Setup:
Short-term Buy: around 121,300 – 121,500
Take Profit: 123,100 – 123,300
Stop Loss: below 121,100
After reaching the PoC, consider flipping short if a clear rejection appears.
🟥 Scenario 2 – Breakdown of Demand → Continuation of Downtrend (~30%)
🔹 Price Action:
Price loses the Demand zone (121,200 – 121,300) completely.
A full-bodied H1 candle closes below 121,000 with strong volume.
Sellers take control, pushing price lower toward 120,400 – 119,800 (4H support zone).
🔹 Confirmation Signals:
No strong bullish reaction at Demand.
Heavy selling volume (large red candles).
Retests of 121,200 are rejected.
🔹 Trade Setup:
Sell Breakout: when H1 closes below 121,000
TP1: 120,400
TP2: 119,800
SL: 121,600
🟦 Scenario 3 – Reclaim POC & Retest Supply Zone (~15%)
🔹 Price Action:
Price bounces strongly from the Liquidity Zone and breaks above the POC at 123,300.
Retests the POC zone as a new support.
Continues rallying toward the Supply zone (123,900 – 124,200).
Two possible outcomes:
Strong rejection: price turns back down.
Clean breakout: confirms short-term trend reversal.
🔹 Confirmation Signals:
H1 candle closes firmly above 123,400.
Volume increases consistently during the breakout.
RSI breaks its previous high.
🔹 Trade Setup:
Buy Breakout: above 123,400
TP: 124,200 – 124,500
SL: below 122,800
🟨 Scenario 4 – Sideways Range Between Liquidity & POC (~10%)
🔹 Price Action:
Price consolidates between 121,800 – 123,200, unable to break either side.
Volume gradually decreases as the market waits for a catalyst (e.g., CPI data, macro news).
A mini balance range forms before the next breakout.
🔹 Confirmation Signals:
Small-bodied candles with long wicks and declining volume.
Market Profile tightens around 122,500.
RSI hovers near the 50 level.
🔹 Trade Setup:
Scalp Range Trading:
Buy near 121,900 – 122,000
Sell near 123,200 – 123,300
Target small profits (80–120 USD range)
🔥 Disclaimer: This analysis is for informational and educational purposes only and does not constitute financial advice. Trading and investing in cryptocurrencies involve significant risk; please do your own research and manage your capital responsibly.


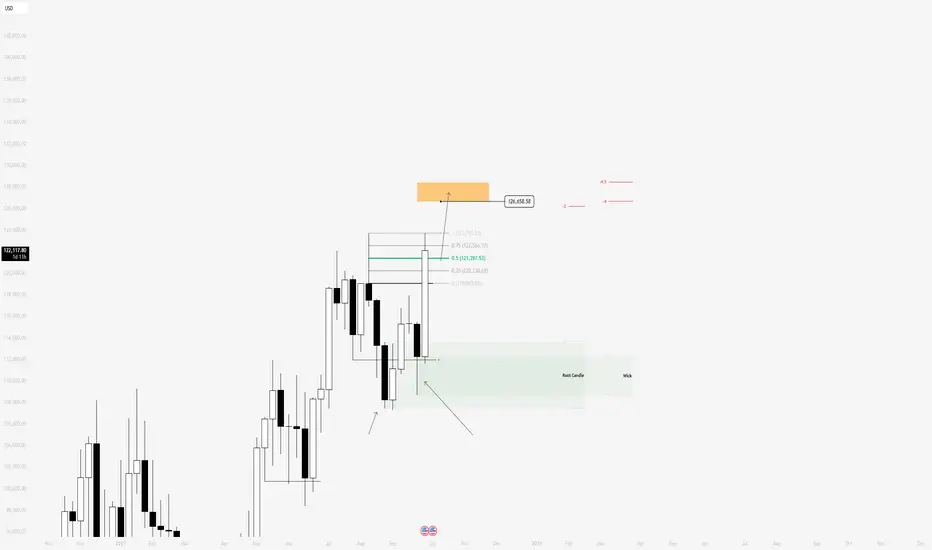
BTC Well on it's way to 126kTechnical analysis most times does not need many words.
Here we have a very bullish bitcoin BINANCE:BTCUSD
Using the wicks on the weekly chart, I can measure them and project values towards all time highs based on Market Maker Model Dynamics
The first projection, is the root candle of the current distribution
The second projection is the lower wick of the last re-accumulation before we had an expansion in the just concluded week.
Both projections, converge around 126k so I have my sights set on 126k
I anticipate the lower wick of the upcoming week to form around 121k (50% premium wick level)
See image below
BINANCE:BTCUSD
That's it.
BTC / USDT - Ascending Triangle Evening fellas,
Clear BTC ascending triangle bout to pop.
Hope you got a slice of the pie. Fasten your seatbelts!
Trade thirsty, my friends!


BTC:Caution should be exercisedIn early trading today, Bitcoin briefly surged to a high level before plunging sharply, and finally stabilized with fluctuations around the 122000 mark.
The 125000-126000 range is a cluster of previous highs, is rife with a large number of trapped positions and profit-taking positions. Sustained expanded trading volume is required to achieve an effective breakthrough, and it will be quite challenging to break through in the short term.
Caution should be exercised regarding the impact of factors such as a leverage liquidation wave, a policy shift at the Federal Reserve's December FOMC meeting, and increased volatility amid the high valuation of global cryptocurrencies on the trend.
Buy 121100 - 121500 TP 122000 - 122500 - 123000
Daily-updated accurate signals are at your disposal. If you run into any problems while trading, these signals serve as a reliable reference—don’t hesitate to use them! I truly hope they bring you significant assistance
Btc updatedFull positions are tagged up here….
$121350 as mentioned from the last update…
Patience 🧘
Stops remain as is. I have zero allowance on this one.
$126,800 still the target for me with a high end extension into $131,200!!!
🫣
