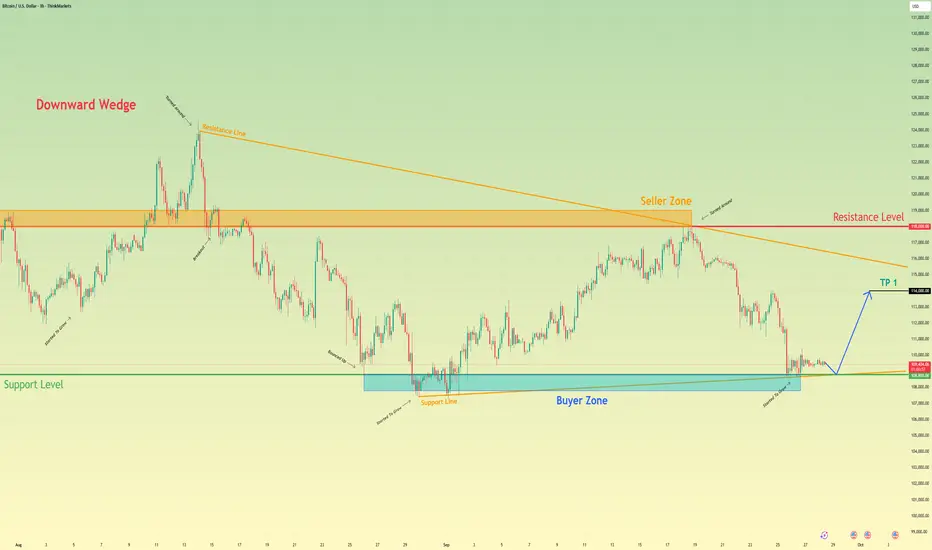
Bitcoin can Bounce from Support and Start to GrowHello traders, I want share with you my opinion about Bitcoin. The price structure has been defined by a complex and volatile consolidation following a prior downtrend. After initially forming a downward wedge, the price action has seen multiple breakouts and reversals, testing both the major 108800 buyer zone and the 118000 seller zone. This prolonged period of indecision has established a solid support base at the 108800 support level. Currently, after a recent sharp drop was absorbed by this support, the price of BTC has started to show signs of a renewed bullish attempt, moving up from the lows. In my mind, this successful test of the major support is the most critical recent event. I expect that the price will first make a final small dip to re-test this 108800 support level to confirm buyer strength. I think a confirmed bounce from this area will lead to a significant rally, as sellers appear to be exhausted. Therefore, I have placed my TP at 114000, targeting a key area of prior price congestion located near the resistance line of the larger wedge structure. Please share this idea with your friends and click Boost 🚀
Disclaimer: As part of ThinkMarkets’ Influencer Program, I am sponsored to share and publish their charts in my analysis.
BTCUSD.P trade ideas
September 29 Bitcoin Bybit chart analysisHello
It's a Bitcoin Guide.
If you "follow"
You can receive real-time movement paths and comment notifications on major sections.
If my analysis was helpful,
Please click the booster button at the bottom.
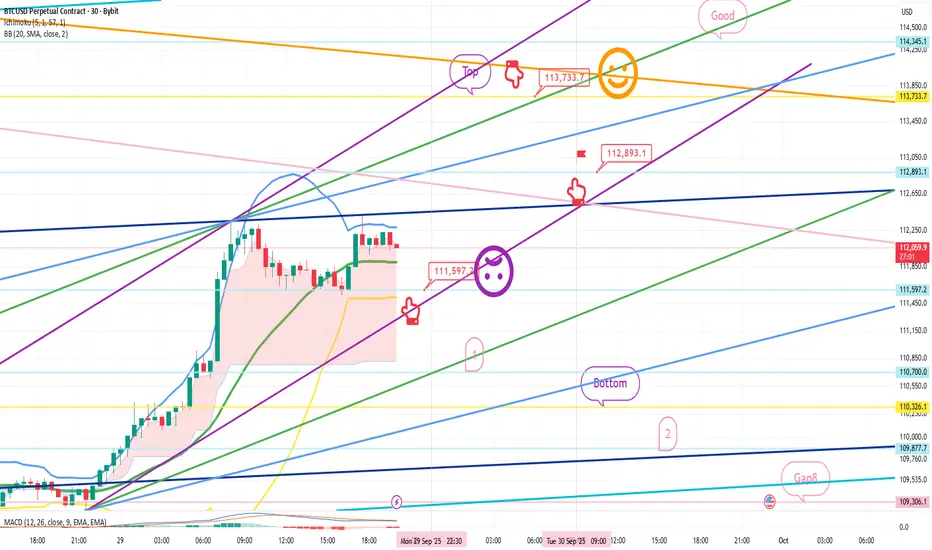
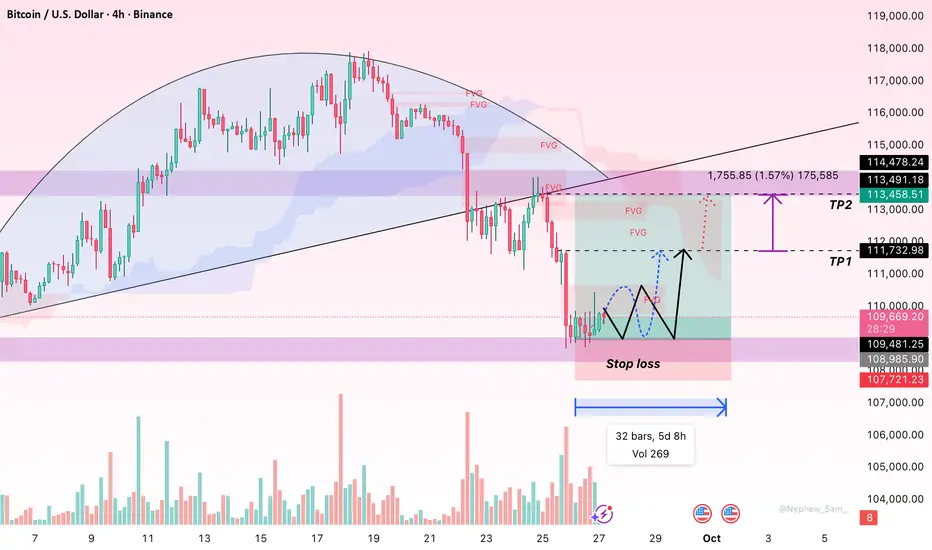
This is a Bitcoin 30-minute chart.
There are no Nasdaq indicators released today.
I developed a strategy based on the rising pattern.
*Red finger movement path:
One-way long position strategy
1. $111,597.2 long position entry point / Stop loss if the purple support line is broken
2. $113,733.7 long position first target -> Good second target
If the strategy is successful, the 112,8K level indicated
can be used as a long position re-entry point.
Up to the first section below, the price is moving sideways to the right.
From the bottom section touch, there's a high probability of a decline to the Gap 8 retracement level.
Please check the bottom support line and section 2 indicated below.
Up to this point,
I ask that you use my analysis for reference only.
I hope you operate safely, with a focus on principled trading and stop-loss orders.
Thank you.
Cryptocurrency : The New Normal & The World of Leverage Trading.📌 Cryptocurrency: The New Normal & The World of Leverage Trading ⚔️ ( A Sweet Killer! )
🌍 Why Are Traders Shifting to Crypto? COINBASE:BTCUSD BITSTAMP:ETHUSD COINBASE:SOLUSD
✔️ Lower capital required compared to stocks
✔️ Fewer gaps (24/7 market = no overnight gap-up/down shockers)
✔️ High leverage opportunities (control bigger trades with smaller margin)
✔️ Global accessibility (Binance, Bybit, OKX, CoinDCX, Mudrex etc.)
📊 Types of Trading in Crypto
💠 **Spot Trading** → In India, 30% tax on capital gains ( check according to your country ).
💠 **Options & Futures** → Taxed as *Business Income* ( like F&O in stocks ). No flat % rule.
⚡ What is Leverage?
👉 Leverage means using *small capital* to control a *large trade size* , because the exchange lends you money.
Think of it like **margin trading** in stocks — but much more aggressive.
🔹 Example 1 : Normal Trade style ( No Leverage )
suppose you have 💰 Capital = $10,000
Bought BTC at Price = $10,000,000
* You can buy 0.001 BTC ( 10000 ➗ 10,000,000 ).
* If BTC rises 10% → Profit = $1,000 (+10%)
* If BTC falls 10% → Loss = $1,000 (-10%)
👉 Risk & reward move in proportion to your capital.
🔹 Example 2 : Leverage Trade style ( 10x Leverage )
suppose you have 💰 Capital = $10,000
opted Leverage = 10x
New Trade Size ( margin ) = $1,00,000 ( you can now utilize this margin amount for trading )
* You can buy 0.01 BTC ( 10000 ➗ 10,000,000 ).
* If BTC rises 10% → Profit = $10,000 (+100% return)
* If BTC falls 10% → Loss = FULL $10,000 ( Liquidation 🚨 )
👉 A 10% move = your account will be blown.
🔹 Example 3:
suppose you have 💰 Capital = $10,000
opted Leverage = 50x (Extreme ⚠️)
New Trade Size ( margin ) = $5,00,000 ( you can now utilize this margin amount for trading )
* You can buy 0.05 BTC ( 50000 ➗ 10,000,000 ).
* If BTC rises just 2% → Profit = $10,000 (+100% return)
* If BTC falls just 2% → FULL $10,000 loss ( Liquidation 🚨 )
* If BTC rises just 10% → Profit = $50,000 (+500% return)
* If BTC falls just 10% → FULL $10,000 loss ( Liquidation 🚨 )
👉 Tiny moves in high volatile asset class = jackpot or wipeout/blown.
⚔️ Key Takeaways :
1️⃣ Leverage multiplies profits 💸 but also multiplies losses too💀 ( a sweet killer! )
2️⃣ Crypto is *highly volatile* (10–20% daily moves are common) → High leverage is extremely risky, if not managed well.
3️⃣ Beginners should **never use more than 2x–3x leverage**
👉 In simple words: **Leverage is a double-edged sword ⚔️**
Used wisely → You’re a king 👑
Used recklessly → You’re broke 🥀
---
🚘 Liquidation Explained ( ex: Car Analogy )
Imagine you pay $10,000 ( as a security ) to rent a car worth $1,00,000. (That’s 10x leverage).
* The car is in your hands, but $90,000 still belongs to the owner of car (exchange).
* If the damage goes beyond your $10,000 margin → the owner takes back the car immediately.
👉 That’s liquidation: when your loss = your margin.
🔹 Case 1: Normal Trade style ( No Leverage )
Margin = $10,000 → Buy BTC.
If BTC drops 10% → Loss = $1,000.
You still have $9,000 left.
✅ No liquidation. Just a normal loss.
🔹 Case 2: 10x Leverage Trade style
Margin = $10,000
New Trade Size ( margin ) = $1,00,000
* BTC rises 10% → Profit = $10,000 (+100%)
* BTC falls 10% → Margin wiped = Liquidation 🚨
🔹 Case 3: 20x Leverage Trade style
Margin = $10,000
New Trade Size = $2,00,000 ( margin )
* BTC rises 5% → Profit = $10,000 (+100% return)
* BTC falls 5% → Margin wiped = Liquidation 🚨
👉 Just 5% against you = Account gone.
🔹 Case 4: 50x Leverage Trade style (High-Risk Zone ⚠️)
Margin = $10,000
New Trade Size = $5,00,000 ( margin )
* BTC rises 2% → Profit = $10,000 (+100% return)
* BTC falls 2% → FULL $10,000 loss = Liquidation 🚨
👉 Just 2% against you = Blown account = Game over.
🎯 Final Word
Leverage = Power ⚡
But in crypto’s volatile world, it’s also a **trap for the impatient**.
* Liquidation is directly proportionate to Leverage.
* Smart traders use small leverage.
* Impulsive traders burn out with high leverage.
💬 Question for you: What’s the **highest leverage** you’ve ever used in a trade? Drop it below 👇 (Be honest—we’ve all been tempted!)
If this Idea gave you a value information then please, Boost it, share your thoughts in comments, and follow for more practical trading!
Happy Trading & Investing!
@TradeWithKeshhav and team

The 4 year cycle, will it hold?BTC's path to 400k$+ by end of 2025/early 2026
The Big wave 3 (Purple fibs) gives a target of around 310k$
wave 3 of 3 (yellow fibs) coincides. wave 3 of 3 of 3 is forming.
Timing is just an idea, but lets see if the 4 year cycle holds up or not.

Bitcoin To 103,792$ within 10 days - options king!As the title says, you can easily place options trades with my analysis, don't bet a lot though, small amounts for you to hedge your normal portfolio, but you can see great returns from it.
you can also place some 30+ day options for longer term outlooks such as BTC to 80K.
I am the person that has predicted every twist and turn of this market, and more financial meltdown is coming your way.
see my linked ideas for how we predicted the collapse of bitcoin from ATH and we expect further collapse.
You should see BTC at 40k within the next 8-9 months.

BITCOIN HIGH PROBABILITY SETUP SOON!!!🚨 BTC HIGH PROBABILITY BUY SETUP 🚨
* Here We Can See Clearly The Next Potential Moves For BTCUSD Coming Hours/Days.
* Keep Your Eyes Close On Your Trading Positions.
* Happy PIP Hunting Traders.
FXKILLA.

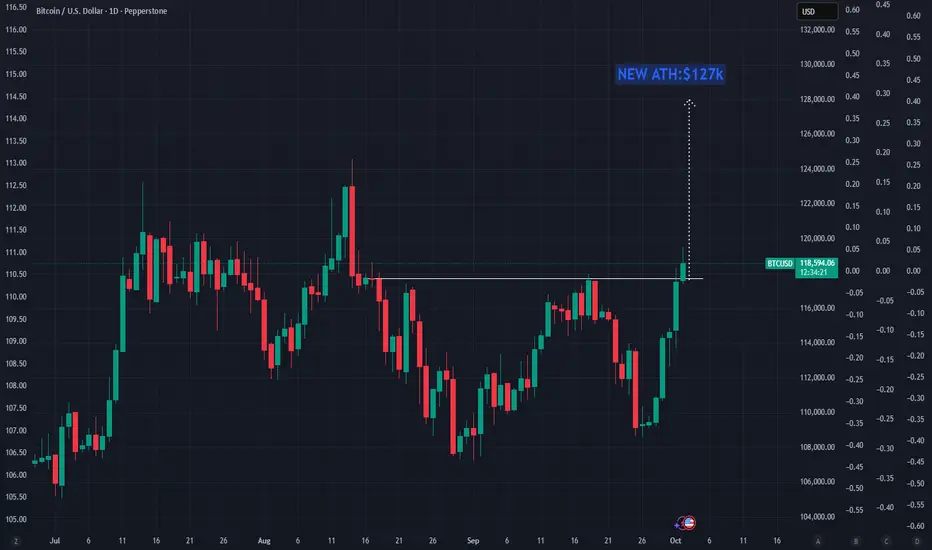
BTC Target $ 130.000Bitcoin has consolidated in a base region for a possible push to new highs, this consolidation could take it to prices in the $130,000 region.
Today considered a safe haven asset, with the sharp fall of the Dollar, it is gaining prominence, as is Gold in new flights.
Important regions marked may be key points for a new ATH as well as the structure that supports this movement
We have some Pullback regions that can be good triggers for long, remembering that there is a structure driving this price, breaking it we can have a stronger correction

Why Zcash pump signals the end of the cycle? Back testing Zcash pump for past 3 cycles indicates that every time the cycle topped, Zcash will do a late pump within 21 days at most.
Zcash did a 2x in 5 days since September 29. this indicates that the cycle top is very close (mid october)

BTCUSD Long Idea: Bullish Breakout and Retest of Key LevelHello TradingView Community,
This post outlines a potential long trade setup on the Bitcoin / U.S. Dollar (BTCUSD) pair, based on the 15-minute timeframe.
Technical Analysis:
The chart is currently demonstrating a strong bullish trend, with the price making consistent higher highs. A key horizontal level has been established at approximately $118,341.02. This level previously acted as a resistance area, where the price consolidated before the breakout.
We have now witnessed a decisive breakout above this level, which is a strong bullish signal indicating continued buying pressure. The trading idea is based on the classic "resistance-turned-support" principle. We are looking for a pullback to this broken resistance, anticipating that it will now act as a new support floor, providing an opportunity to join the uptrend.
Trade Setup:
The long position tool on the chart visualizes a potential trade plan for this scenario:
Entry: Approximately $118,341.02 (at the retest of the new support).
Stop Loss: $115,988.47 (placed below the support structure to invalidate the idea if the level fails to hold).
Take Profit: $127,619.03 (targeting a new potential swing high).
This setup offers a structured plan with a favorable risk-to-reward ratio for a potential bullish continuation.
Disclaimer: This analysis is for educational and discussion purposes only and should not be considered financial advice. Trading cryptocurrencies involves significant risk. Please conduct your own due diligence and manage your risk appropriately.

Bitcoin (BTC) Bulls Face Critical Test at 120K Resistance
Bitcoin (BTC) Bulls Face Critical Test at 120K Resistance
Bitcoin (BTC) is currently exhibiting strong bullish momentum on the 4-hour chart, having rallied significantly from a confirmed "Double Bottom" around the "Strong Support 108K" level and now trading at 118,949.27.
The price is actively challenging the "Current Resistance 120K level" and a crucial ascending "Trend line" (blue dotted) around 121K-122K, indicating a pivotal test for the ongoing upward movement.
Failure to decisively break above these immediate resistance levels could trigger a retracement, with the "117K to 118K - Immediate Support" zone being the first critical area to watch for buyers to step in.
Maintaining price action above the "115K Good Support" and the "112K- 113K Important Level" is essential for the bullish structure to remain intact and for further upside potential.
Disclaimer:
The information provided in this chart is for educational and informational purposes only and should not be considered as investment advice. Trading and investing involve substantial risk and are not suitable for every investor. You should carefully consider your financial situation and consult with a financial advisor before making any investment decisions. The creator of this chart does not guarantee any specific outcome or profit and is not responsible for any losses incurred as a result of using this information. Past performance is not indicative of future results. Use this information at your own risk. This chart has been created for my own improvement in Trading and Investment Analysis. Please do your own analysis before any investments.

AI forecast suggests consolidationAfter the big energetic move we just saw, the AI suggests the market needs to catch it's breath
Don't expect too much excitement over the next couple of days

BTC Digital Asset Amid #Bitcoin? $150,000 Target in Sight? BTC: Undervalued Digital Asset Amid #Bitcoin? $150,000 Target in Sight? 🚀
BTC at $111,000 (-1%), undervalued with growing adoption amid X buzz on wealth and upward moves—analysts project $125,000-$200,000 for 2025, average $150,000 implying 35% upside, pondering if institutional inflows drive surge. 📈
**Fundamental Analysis**
Market cap $2.21T with circulating supply 19.93M; undervalued as hedge against inflation with high ROI potential from ETF inflows and central bank interest, fundamentals bolstered by halving-reduced supply.
- **Positive:** Store of value appeal; institutional adoption rising.
- **Negative:** Volatility; regulatory uncertainties.
**SWOT Analysis**
**Strengths:** Limited supply scarcity; global liquidity.
**Weaknesses:** Energy consumption concerns; price swings.
**Opportunities:** ETF expansions; sovereign reserves.
**Threats:** Government bans; alternative cryptos.
**Technical Analysis**
Chart consolidating post-rally with building momentum. Price: $111,000, VWAP $110,500.
Key indicators:
- RSI: 55 (neutral with upside room).
- MACD: Positive crossover signal.
- Moving Averages: Above 50-day $100,000, 200-day $80,000 (bullish).
Support/Resistance: $100,000/$120,000. Patterns/Momentum: Bull flag targeting $150,000. 📈 Bullish | ⚠️ Bearish.
**Scenarios and Risk Management**
- **Bullish:** Sentiment rebound to $120,000; DCA on support tests for cost averaging.
- **Bearish:** Market correction drops to $100,000.
- **Neutral:** Ranges $110,000 on volume buildup.
Risk Tips: 1% risk per trade, stops at $100,000, diversify holdings, DCA to mitigate swings. ⚠️
**Conclusion/Outlook**
Bullish on regulatory tailwinds. Watch ETF flows. Fits #Bitcoin theme with adoption upside. Take? Comment!

BTC Traders Are About to Learn the Hard WayMost traders are celebrating BTC pushing through 113,524… but here’s what most of them don’t see coming.
If price holds, we’ve got clean air to 117K.
If it slips into 111,642, the dominoes line up for 109K… and possibly a flush toward 100K.
This is the kind of setup that wipes out overleveraged traders—and hands opportunities to those who know how to position.
👉 I’m not here to tell you what to do with your money. But I will say this: how you prepare in the next few days could decide whether you’re the one getting liquidated… or the one profiting from the liquidation.
I’ve mapped out the exact levels I’m watching and the playbook I’ll be using if BTC chooses either path.
DM me if you want to see it.

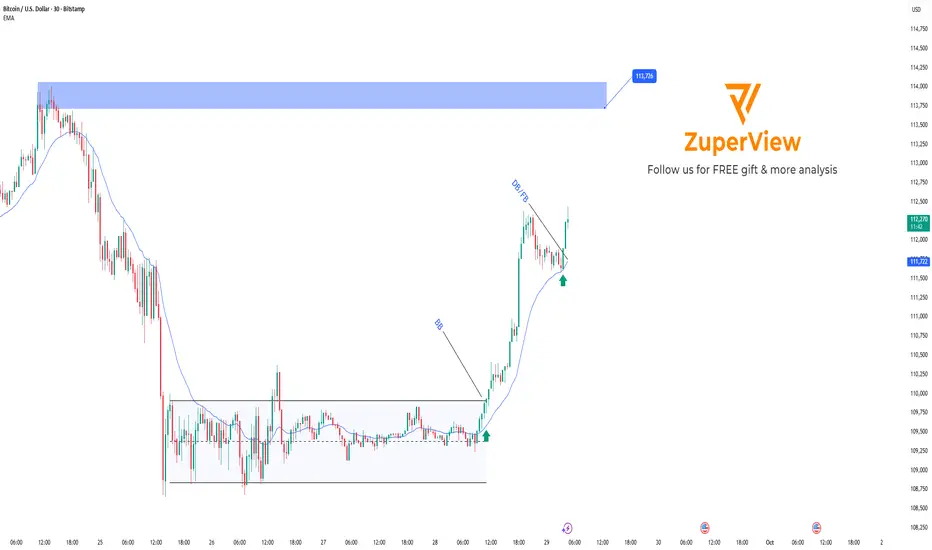
BTC escapes consolidation, shifting into an uptrend
Price has broken out of the sideway range 108,500 – 109,800, shifting from bearish to bullish.
After the BB (Block Breakout), BTC surged to 112,500 – 113,000 before consolidating.
Currently, price is trading far from the EMA (around 111,100), implying a possible pullback.
Strategy:
Wait for price to retrace toward EMA (111,000 – 111,200) or consolidate in this zone.
If patterns such as DD (Double Doji) or FB (First Breakout) form within 111,000 – 111,500, consider long entries.
Please like and comment to support our traders. Your feedback motivates us to produce more analysis in the future 🙏✨
BTCUSDPreferably suitable for scalping and accurate as long as you watch carefully the price action with the drawn areas.
With your likes and comments, you give me enough energy to provide the best analysis on an ongoing basis.
And if you needed any analysis that was not on the page, you can ask me with a comment or a personal message.
Enjoy Trading ;)

BTCUSD buy setupPrice has reached a significant support and now is consolidating at it, of course this is a counter trend, buying the correction. but i think if this work, then it is going to be a resumption of the old uptrend. pay attention to what price will do here. i would be more confident if the current low get swept first then a a good close with volume above it. lets see if bulls can show up to defend the zone!

BTC Q4 soonThere is a lot of confluence for the 3 to 8 Oct timeframe for a low to be set on BTC and crypto market.
Will update accordingly

BTC/USD – Holding Support | Upside Targets 112K & 115K Bitcoin is respecting the support zone near $109,500 after a liquidity grab.
As long as this support holds, market structure suggests a potential bullish reversal.
First upside target: $112,000.
Extended target: $115,000–$115,200 near resistance zone.
If buyers lose momentum and support breaks, further downside could be seen. For now, momentum favors the bulls.
👉 Do you think BTC can reach $115K this week? Drop your view in the comments.

Report: Bitcoin (BTC / USD) — September 27, 20251) Asset Overview
Description: Bitcoin is the first decentralized cryptocurrency (launched January 2009, whitepaper by Satoshi Nakamoto). Proof-of-work protocol with UTXO model, primary uses: store of value and peer-to-peer medium of exchange.
Tokenomics: Max supply 21,000,000 BTC; circulating supply ~19,925,781 BTC (27/09/2025). Emission decreases via halvings (~every 4 years; last halving 2024). No native burning mechanism.
Governance & development: Open-source development (Bitcoin Core and related clients); protocol changes via community, miners and maintainers consensus.
2) Key On-chain Metrics & Economic Data
Price (snapshot 27/09/2025): ~$109,400 per BTC (spot average).
Market cap: ~$2.18T (approx).
Circulating supply: ~19.93M BTC.
Hashrate & security: Network hashrate at all-time highs (strong security and miner participation; varies with difficulty and price).
Active addresses / transactions: Daily active addresses and transactions remain elevated; moderate growth post-ETF adoption.
Average fees: Volatile — spikes during congestion; Lightning Network absorbs some micro-payments.
Value metrics: MVRV and SOPR indicate episodic profit realization during price swings; NVT remains relatively high versus alt-season.
Concentration: Significant holdings by early adopters and large addresses (“whales”); liquid supply limited relative to market cap.
Market liquidity: Deep liquidity on major exchanges (Coinbase, Binance, Kraken, Bitstamp, etc.) and derivatives markets; slippage increases for very large orders.
Sources: exchanges available in TradingView.
3) Price & Market Analysis (last 12 months)
12m performance: BTC exhibited wide volatility; current level ~$109k (snapshot date). Specific 12m highs/lows available from exchange feeds.
Volatility: Historically higher than traditional assets; recent volatility reduced relative to speculative peaks but still elevated vs. gold/equities.
Benchmarking: Partial correlation with S&P 500 and macro risk sentiment; generally correlated with ETH during rallies but retains market leadership.
Trading & volumes: High spot and derivatives volumes; occasional large liquidations during strong moves.
Primary venues: Widespread trading across centralized exchanges and OTC desks; growing influence from spot ETFs.
4) Technical Analysis (brief)
Trend (daily/weekly): Price action above many medium-term moving averages after rallies/mean reversion; key levels cited around $104k (support) and $112k (resistance).
Indicators: Daily/weekly RSI oscillates between neutral and bullish; MACD shows variable momentum. 50/200 MA crosses inform short/medium-term bias.
Suggested supports/resistances: Supports: $95k–$100k, $80k. Resistances: $112k–$120k, psychological $150k.
5) Fundamental & Network Analysis
Adoption & infrastructure: Growing institutional integration (ETFs, custody), extensive Lightning Network infrastructure. Adoption as a store of value and portfolio diversifier.
Competitors / substitution risk: Ethereum and other L1s provide smart contract functionality and DeFi; they do not directly replace BTC’s primary “digital gold” function but compete for investor capital.
Primary risks: Regulatory restrictions, market events (leveraged liquidations), supply concentration, exchange/custody operational risks; 51% attack is theoretically possible but costly given current hashrate.
Security & audits: Mature protocol with extensive open-source review; main risks are in layer-2s, custodial solutions and external smart contracts.
6) Outlook & Scenarios (1–3 years)
Conservative: Institutional adoption stable, moderate volatility, price range-bound $60k–$120k if macro conditions worsen.
Base: Gradual adoption via ETFs and payment rails; price target $120k–$200k over 2–3 years if institutional demand persists.
Optimistic: Strong institutional demand + restricted liquid supply + favorable macro → potential to exceed $200k within 1–3 years.
Key drivers: ETF/custody adoption, favorable regulation, macro (inflation/rates), layer-2 development, retail sentiment.
Risk mitigation: Diversification, secure custody (cold storage/multisig), position sizing and stop-loss, hedging with options/futures.
7) Conclusion & Recommendations
Risk/return profile: BTC is a high-volatility asset with medium-to-long-term store-of-value potential; suitable for investors with risk tolerance and multi-year horizon.
Recommendations (non-financial):
Long-term holders: dollar-cost averaging, secure custody (cold storage, multisig).
Traders: follow support/resistance levels, manage leverage carefully, consider options for downside protection.
Example take-profit / stop-loss guidance: partial profit-taking on rallies >20–30% from entry; dynamic stop-loss below key supports ($95k–$100k referenced).
Strengths: First-mover advantage, deep liquidity, robust network security, strong institutional recognition.
Weaknesses: High volatility, supply concentration, limited native programmability versus other L1s.
Summary statistics — 30 days (2025-08-27 to 2025-09-26)
Price (USD, close)
Min: $87,320
Max: $112,950
Mean: $101,430
Median: $102,100
Volume (USD, daily spot volume)
Min: $12.8B
Max: $48.3B
Mean: $28.6B
Median: $26.4B
Average on‑chain fee (USD per transaction)
Min: $1.12
Max: $6.45
Mean: $2.84
Median: $2.31
MVRV (z-score %)
Min: -2.1%
Max: 18.4%
Mean: 6.3%
Median: 6.9%
SOPR (realized profit ratio)
Min: 0.91
Max: 1.28
Mean: 1.07
Median: 1.05
NVT (network/value ratio)
Min: 35
Max: 68
Mean: 47
Median: 45
Notes:
Values rounded. On-chain metrics (fee, MVRV, SOPR, NVT) calculated from indicated sources; NVT based on market cap / on‑chain volume normalization.

Bitcoin to Surge? Price Forecast and Key News You Can't Miss!Hello everyone, let's go through some important information regarding Bitcoin recently.
Technical Analysis:
The 109,000 USD support level is a key point as FVG zones have appeared, and there has been a clear recovery response. If Bitcoin holds above this level, there is potential for it to continue rising, with nearby resistance levels at 110,000 USD and 112,000 USD. If these levels are broken, Bitcoin may expand its rally towards 115,000 USD. The candlestick chart currently shows positive reversal signals, and technical indicators are supporting the uptrend.
News Impact:
Several factors are influencing the market:
PCE Data and US Inflation: The August PCE showed a slight increase to 2.7%, higher than 2.6% in July. This indicates that inflation pressure isn't easing quickly, which could lead the Fed to maintain high interest rates. This may put short-term pressure on Bitcoin, but if subsequent data shows inflation isn’t accelerating, Bitcoin could maintain its bullish momentum.
US Government Shutdown Risk: The market is closely watching the potential for a government shutdown on 1st October 2025. If this happens, investors might reduce their holdings in risky assets like Bitcoin. Conversely, if the situation is resolved, it could create a positive market sentiment.
Large Liquidations in Derivatives: On 22nd September 2025, the crypto market saw more than 1.5 billion USD in long positions liquidated, creating significant volatility and driving Bitcoin down temporarily. However, as the liquidation wave subsides, it could present an opportunity for fresh capital to enter at support levels.
Bitcoin ETFs and Coinbase Forecast: Bitcoin ETFs, such as BlackRock’s iShares Bitcoin Trust and Fidelity’s Fund, continue to attract institutional investment. Additionally, Coinbase CEO Brian Armstrong forecasts Bitcoin could reach 1 million USD by 2030, driven by clearer regulatory frameworks and increasing demand from financial institutions. This presents a long-term support factor for Bitcoin.
US Strategic Bitcoin Reserve Fund: President Trump’s executive order to establish a national Bitcoin reserve fund has sparked new expectations. If implemented, this could provide a major catalyst for Bitcoin’s price as it becomes part of the strategic national reserves.
In conclusion, Bitcoin is showing signs of recovery if it maintains support at 109,000 USD. Factors such as inflation data, Fed policies, the risk of a government shutdown, ETF inflows, and the US Bitcoin reserve fund will all play a crucial role in shaping its upcoming trend.
Do you think Bitcoin could reach 112,000 USD in this recovery phase? Feel free to share your thoughts.
btc Ready for PUMP or what ?The price is at the channel's bottom, and if it follows the previous Pump from bottom of thechannel pattern, the price could reach the channel's top.

BTC USD HI GUYS,
Btc has presented a test area for continuation sells. we are bearish as we form a complete cup and handle RT H8, H6, H4.
these are inner structure sell entries as we move
