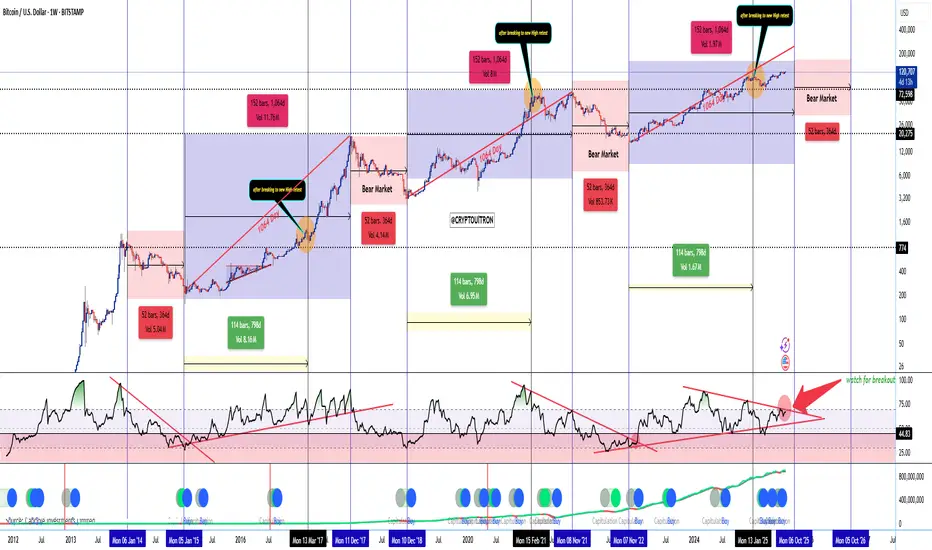
BTC 1W Cycle Map — 1064-Day Cadence Intact (update)📊 BTC 1W Cycle Map — 1064-Day Cadence Intact
🎯 Top window: Week of 06 Oct ’25 (± 1–2 weeks)
🧩 Cycle structure (from chart):
1064-day rhythm to macro top has played out in 2013, 2017, and 2021.
From the Nov ’22 cycle low, the next 1064d lands on Oct ’25 → that’s my projected cycle top zone.
Each cycle shows ATH break → retest → terminal leg before topping. Orange circles = retests. We’ve completed ours.
Bear markets have been rhythmic: ~52 weeks / 364 bars of decline post-top. Marked in red for all past cycles.
📈 RSI setup:
1W RSI downtrend break has always preceded the final blow-off leg.
Currently coiling just under that trendline (big red arrow). A confirmed breakout is my ignition trigger.
🔍 Key chart signals:
Blue/green capitulation buy dots (hash ribbon + cycle models) historically cluster before major legs up, not at tops.
Volume cycles also show ~114 weeks (798 days) of expansion phases between retest and top.
📌 My read:
If RSI fails and price closes <95–100k weekly, I’ll treat it as an early-top scenario.
⏳ Post-top expectations:
~1 year of decline/mean reversion → likely retrace to prior breakout demand (mid-70s to low-80s).
Chart from 2023
BTCUSD.P trade ideas
BTCUSDT Cut n Reverse Area? what's next??#BTCUSDT - perfect holdings upside as we discussed in our last idear regarding Bitcoin and now market just reached at his ultimate area/region, that is around 107500-700
keep close that region because that is market full n final region for buyers.
dont hold your buying positions below that.
NOTE: we will go for cut n reverse below that that region.
good luck
trade wisely

Bitcoin Bullish Continuation Backed by Weak Dollar and Shutdown BTC/USD is currently trading around 114,300, maintaining its bullish momentum after successfully breaking through the key resistance level at 113,600. This breakout signals growing market confidence and a potential continuation toward the next upside target at 116,200.
🔍 Technical Overview:
Resistance Turned Support: The 113,600 level previously acted as a strong resistance zone but now appears to be providing support, reinforcing the bullish structure.
Trend: The pair remains in a short-term uptrend, supported by higher highs and higher lows on the 4H chart.
Target: Immediate upside target remains at 116,200, where traders should monitor for potential profit-taking or reversal signs.
🌍 Fundamental Drivers:
Weakening US Dollar: A softening dollar is providing broad support to crypto markets, with DXY showing signs of exhaustion amid concerns over interest rate stability.
US Government Shutdown Fears: Investors are beginning to price in the risk of a potential US government shutdown, contributing to increased demand for alternative assets like Bitcoin as a hedge.
Sentiment & Market Outlook:
Market sentiment remains cautiously optimistic, with on-chain data showing steady inflows into BTC. The macroeconomic backdrop, particularly concerns over US fiscal policy and a weaker dollar, is creating a supportive environment for BTC's continued rally.
⚠️ Risk Management:
Watch for any rejection near 116,200, which could prompt short-term consolidation.
A confirmed break back below 113,600 would invalidate the current bullish thesis and may open the door to a deeper pullback.

Treasury General Account MAJOR Impact on $BTC PriceI’ll be the first to admit I failed to closely follow and analyze the impact of the Treasury General Account (TGA).
We all know it’s a liquidity suck on ₿itcoin and cryptocurrencies, which are the most highly sensitive assets to liquidity, but have you ever dove into the data to see just how impactful it is?
I went through all the refills and calculated how much it drew down the CRYPTOCAP:BTC price.
Note how TGA refills also marked cycle tops in 2017 and 2021.
This really is something to closely monitor going forward alongside Total Global Liquidity (TGL).
What I have found is when TGA refills are occurring, they have more impact on the price of BTC than TGL.
We can see this in the current state of market, where TGL is at an ATH and the TGA is currently being refilled.
GOOD NEWS: The TGA refill is just about complete 🏁
Moon on brave soldiers 🌛

Uptrend or strong correction?Bitcoin’s move toward 117,000 looks strong. If it can break through the 117,000 resistance and move higher, we’ll see a trend reversal. But as long as it stays below 117,000, the trend remains bearish. ✅

Watching For Bullish Continuation Towards Supply ZoneThe current market structure on the 15-minute chart shows a potential shift in momentum, with price attempting to break above a key resistance zone after forming a support base. If bullish momentum persists and price successfully breaks and holds above this resistance area, we could see a continuation of the upward move. The next key level to watch is the supply zone above, which aligns with a previously formed weak high. This zone may act as a magnet for price, drawing it in as buyers aim to fill the imbalance left behind during the previous sell-off. A confirmed breakout above resistance would validate a bullish bias in the short term, with the potential for price to rally toward the upper supply zone, where we may see reactions or a possible reversal depending on market sentiment.

Exit Psychology 4/5: The Profit Target - Certainty vs. PotentialNOTE – This is a post on Mindset and emotion. It is NOT a Trade idea or strategy designed to make you money. If anything, I’m taking the time here to post as an effort to help you preserve your capital, energy and will so that you are able to execute your own trading system as best you can from a place of calm, patience and confidence.
This 5-part series on the Psychology of Exits is inspired by TradingView’s recent post “The Stop-Loss Dilemma.” Link to the original post at the end of this article.
A familiar scenario:
Price is moving your way. You’re edging closer to your profit target. An internal debate begins:
“Should I book it now? What if it turns?” . Your pulse quickens. Thoughts circle:
“What if it turns now?”
“Should I take it here? It’s good enough…”
“But what if I exit and it keeps running?”
One voice says “bank it before it disappears.” Another whispers “hold, the real move is still ahead.”
You exit early, relief for a moment - until you watch the chart run far beyond where you got out. Next time, you hold on longer… only to see your winner evaporate.
Most traders know this dance. It’s not about charts. It’s about the pull between certainty and potential.
How behaviour shows up with profit targets:
The way we take profits tells us more about our beliefs than about the market itself. :
Cutting trades too early: The belief that profit can vanish at any moment, so you must grab it while it’s there.
Holding too long: Rooted in the hope that “one big trade will make the month.” or erase prior losses.
Moving targets mid-trade: Reflects the belief that adjusting = control, even if it means inconsistency.
Ignoring targets entirely: Suggests discomfort with closure - “If I don’t exit, I haven’t missed out yet.”
The psychology underneath:
What looks like “profit management” is often emotional management in disguise:
Loss aversion in reverse: Protecting unrealised gains feels safer than risking them for more.
Regret aversion: The fear of “what if”- too soon or too late - shapes every decision.
Scarcity belief: “Opportunities are rare - I must squeeze every drop.”
Over-attachment: Treating one trade as if it carries all the weight, rather than one of many in a series.
Identity layer: For some, banking profit = validation; missing the bigger move = failure.
At the heart of it is this tension: Do you seek the certainty of closing now, or the potential of holding on? And which one do you believe defines your worth as a trader?
Why traders use profit targets:
Pre-defined targets do have value.
They provides clarity, structure and reduce decision fatigue.
Locks in gains and avoids paralysis at turning points.
They allow for consistent risk-reward planning.
But the challenge is sticking to those targets without rewriting them mid-trade based on emotion. That’s where the psychology is tested.
Practical tips … the How:
The aim is to separate strategy-based exits from emotion-based exits, namely to exit in line with your plan, while conserving psychological capital for the next trade: A few ways traders manage this:
Define profit targets in advance - structure, measured move, or R-multiple and write them down before entry so you are not improvising mid-trade.
Consider scaling out: partial profits banked, partial profits to satisfy the need for certainty, while leaving a portion to capture potential.
Journal post-trade: Did you exit where planned, or did emotion intervene? Track the pattern across multiple trades.
Build awareness: notice the urge to “grab it” or “stretch it.” Pause and label the feeling (fear/greed/doubt) before acting on it. Naming the emotion can reduce its grip on you.
Reframe:
A profit target isn’t a ceiling. It’s a decision point. The skill isn’t in guessing the high it’s in exiting consistently in line with your plan, while protecting your psychological capital for the next trade.
Closing thought:
Every profit exit is a mirror. It reflects not only what the market offered, but also how you relate to certainty, potential, and trust in your own process.
A link to Exit Psychology 3/5 : The Trailing Stop – Patience vs. Protection
A link to the original article as promised:
This is Part 4 of the Psychology of Exits series .
👉 Follow and stay tuned for Part 5: Tight vs. Loose - Personality, Context, and the Real Trap.

$BTC Wyckoff DistributionPreliminary supply, or PSY:
Occurs when significant interests start to sell lots of shares following a sharp upward trend. Volume increases and the price spread widens, indicating the possibility of a trend change.
BC:
buying climax, characterized by frequently significant rises in volume and price spread. The intensity of purchasing peaks, with professional interests filling heavy or urgent public demand at prices close to their peak. Since large operators require enormous public demand to sell their shares without reducing the stock price, a BC frequently occurs in conjunction with excellent earnings reports or other positive news.
AR:
Automatic reaction. After the BC, the strong buying significantly decreased, but the heavy supply persisted, and an AR occurred. The lower border of the distribution TR is defined in part by the selloff's low.
ST:
Stands for the secondary test, in which the price returns to the BC region to evaluate the demand/supply situation at the current price levels. Supply must exceed demand for a top to be confirmed, so volume and spread should decline as the price moves closer to BC's resistance zone. An ST could appear as an upthrust (UT), in which case the price goes above the resistance indicated by the BC and perhaps other STs before abruptly reversing to close below resistance. Price frequently tests the TR's lower boundary after a UT.
SOW—sign of weakness:
A downtrend to (or just barely past) the TR's lower border, typically accompanied by an increase in spread and volume, is an indication of weakness (SOW). The AR and the initial SOW(s) point to a shift in the stock's price movement, with supply now in control.
Last point of supply, or LPSY:
A weak rally on a tight spread following a test of support on a SOW indicates that the market is having significant difficulties advancing. Strong supply, low demand, or both may be to blame for this market's inability to recover. Before markdowns start in earnest, LPSYs signify the end of the demand cycle and the final distribution waves from large operators.

Bitcoin 1 000 000$ then 0$ !? // A Look into the Future... 📣 Hello everyone!
Here's my Bitcoin trading idea from a FIBOELLIOT perspective, very broadly. I won't explain it in detail to anyone; those who understand it will understand. Skeptics, watch from the sidelines.
🔹 Brief explanations:
1️⃣ Globally, Bitcoin is in a continuous impulse growth cycle; the renewal of historical highs in 2024 postpones the deadline for the completion of the cycle to 2030-2032.
2️⃣ It's already clear that the BTC price increase from 2021 to 2025 isn't impulsive. I believe that from 2021 to 2027, it's a WXY correction. This explains why the altcoin market has been dead since 2021 and why BTC is breaking new all-time highs, but there's no euphoria!
3️⃣ There's a 99% chance that Bitcoin's price won't fall below $15,479 by the end of this decade! There's a 75% chance that the Y-wave correction will end in the $30,000-$40,000 range.
4️⃣ After 2027, Bitcoin's price will explode and reach at least $1,000,000 by 2030, and a maximum of $2.2 million!
5️⃣ After the completion of the five-wave impulsive growth cycle, around 2030-2032, the fate of BTC will be decided – will it correct for $12-20 million or go to $0?
🔹 The biggest threat to Bitcoin in the next 3-5 years:
The most significant, real, and visible threat to Bitcoin is quantum computing. All industry trends and current achievements demonstrate that it is developing rapidly and poses a real threat to BTC not in 20-30 years, but perhaps even in 1-3-5 years! This is a real challenge for Bitcoin and I don't know how it will cope with it, the network requires a significant upgrade for BTC to become quantum-resistant!
⚠️ That's all I have for today. I wish you good luck in making your own trading decisions and profits. Please analyze the information I give you, and always use your own head!
Goodbye! ✊

BTC BULLISH MOMENTUM BUILDING UPOur analysis is based on a multi-timeframe top-down approach and fundamental analysis.
Based on our assessment, the price is expected to return to the monthly level.
DISCLAIMER: This analysis may change at any time without notice and is solely intended to assist traders in making independent investment decisions. Please note that this is a prediction, and I have no obligation to act on it, nor should you.
Please support our analysis with a boost or comment!

BTC PERPETUAL TRADE SELL SETUP Short from $114,200BTC PERPETUAL TRADE
SELL SETUP
Short from $114,200
Currently $114.200
Targeting $113K or Down
(Trading plan IF BTC
go up to $115,200 will add more shorts)
Follow the notes for updates
In the event of an early exit,
this analysis will be updated.
Its not a Financial advice

BTCUSD Short/Sell SignalBitcoin (BTC/USD) – Tactical Short/Sell Positioning Framework
From a technical perspective, Bitcoin is currently presenting a compelling short-side opportunity as the structure unfolds. After multiple failed attempts to sustain momentum above the $110,000 handle, price action has carved out a sequence of lower highs and retests of the same horizontal zone, a classic sign of weakening bullish conviction and potential distribution at elevated levels.
The current chart reveals several critical dynamics:
1. Stop-Loss Placement (Risk Management Discipline)
A prudent protective stop (SL) I have set at $112,800, just above recent resistance. This ensures adverse upside volatility is capped while preserving favorable risk-to-reward asymmetry.
2. Initial Breakdown Trigger
Bitcoin’s repeated interactions with the 200-day moving average highlight the significance of this level as both psychological and structural support. A clean break beneath it could catalyze accelerated downside flows, inviting systematic selling and liquidations.
3. Downside Targets (Profit Objectives)
Take Profit 1 (TP1): $100,070
This marks the first tactical support level, aligning with prior consolidation and offering a conservative initial profit capture.
Take Profit 2 (TP2): $89,566
A more ambitious level, representing the mid-range support where prior accumulation took place. A breach of this zone would likely confirm a broader bearish continuation pattern.
Take Profit 3 (TP3): $76,193
The ultimate downside objective in this framework, corresponding to deep structural support. Achieving this would imply a full retracement of the bullish leg initiated earlier in the year.
4. Strategic Interpretation
This sequence of measured downside targets aligns with a tiered scaling-out methodology, ensuring that profits are progressively locked in as price declines. Such an approach maximizes capital efficiency while allowing flexibility to ride the broader bearish trend should momentum persist.
My Conclusion
The technical confluence of repeated resistance rejection, weakening market structure, and clear downside liquidity targets positions Bitcoin as a sophisticated short candidate at current levels. Risk is well-contained above $112,800, while downside projections toward $100K, $89.5K, and ultimately $76K create a compelling asymmetric opportunity.

BTC Trade Setup: Dip Buy Zone at 113.8K, Breakout Above 115K1. Trend
BTC is currently in a short-term uptrend (multiple BOS and higher highs).
Price is stalling around Fib 0.5–0.618 zone (114,800 – 114,900).
The uptrend line is still holding for now.
2. Key Levels
Resistance: 114,800 – 115,000 (Fib 0.5–0.618).
Support zones:
113,800 – 114,000 (nearest FVG).
113,200 – 113,400 (previous structure + FVG).
111,800 – 112,200 (deeper FVG if correction extends).
3. Trading Plan (scenarios)
Scenario 1 – Buy with trend:
Wait for retracement into 113,800 – 114,000 zone.
Entry: Buy inside this zone.
SL: Below 113,600.
TP1: 114,800 – 115,000.
TP2: 115,500+.
Scenario 2 – Short-term Sell:
If price breaks below the trendline + closes under 114,000.
Entry: Sell on pullback.
TP1: 113,200.
TP2: 112,200.
4. Outlook
Short-term: Likely to retrace into 113,800 – 114,000 FVG before retesting 114,800 – 115,000 resistance.
If breaks above 115,000, next bullish target is 115,600 – 116,000.
If loses 113,800, a deeper correction toward 113,200 – 112,200 is expected.

Q4 2025 200k breach BTCBitcoin breaks out of crab market and continues its history of strong q4, and touches 200k before end of 2025. Boom shacka lacka. check my history. bullish gang

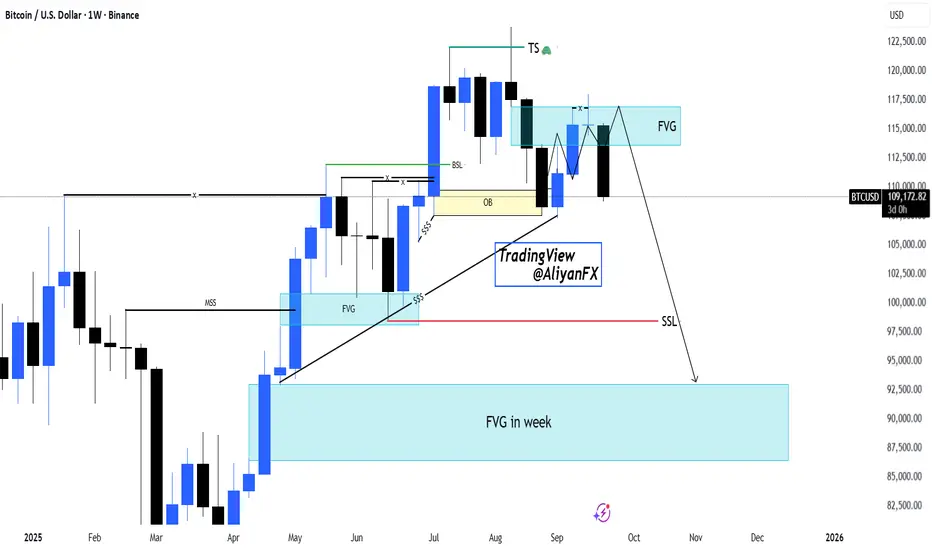
BTCUSD | Weekly FVG Rejection – Bearish Outlook Targeting SSLHello Billionaires!!
We All know that Bitcoin has tapped into a weekly Fair Value Gap (FVG) after sweeping Buy-Side Liquidity (BSL) and reacting from the Order Block (OB). Current price action shows rejection, suggesting bearish continuation.
🔹 Key Points:
BSL swept, confirming liquidity grab.
Price rejected from FVG + OB zone.
Short-term structure break hints at downside momentum.
Targeting Sell-Side Liquidity (SSL) and the weekly FVG demand zone around 90,000 – 92,000.
Outlook remains bearish unless price reclaims and sustains above the FVG rejection zone.
BTC Market Update – Bullish Trend RebuildingBTC Market Update – Bullish Trend Rebuilding
The market structure on Bitcoin highlights a sequence of expansion, consolidation, and sharp corrective phases. After reaching a peak around 115,000, the price shifted into a prolonged sideways phase, where liquidity built up before a decisive breakdown. This breakout introduced stronger bearish momentum, driving price toward lower ranges.
Currently, Bitcoin is stabilizing around 109,500 after the decline, with price action suggesting a potential extension into deeper liquidity zones near the lower range before regaining upward momentum. The projected flow reflects a scenario where downside movement acts as a liquidity sweep, providing the conditions for buyers to re-engage.
The broader outlook remains constructive. Even with short-term pressure favoring the downside, the long-term structure still supports recovery potential. A strong reaccumulation phase could lift Bitcoin back toward the 115,000 zone, aligning with the market’s tendency to reclaim imbalance after periods of sharp displacement.

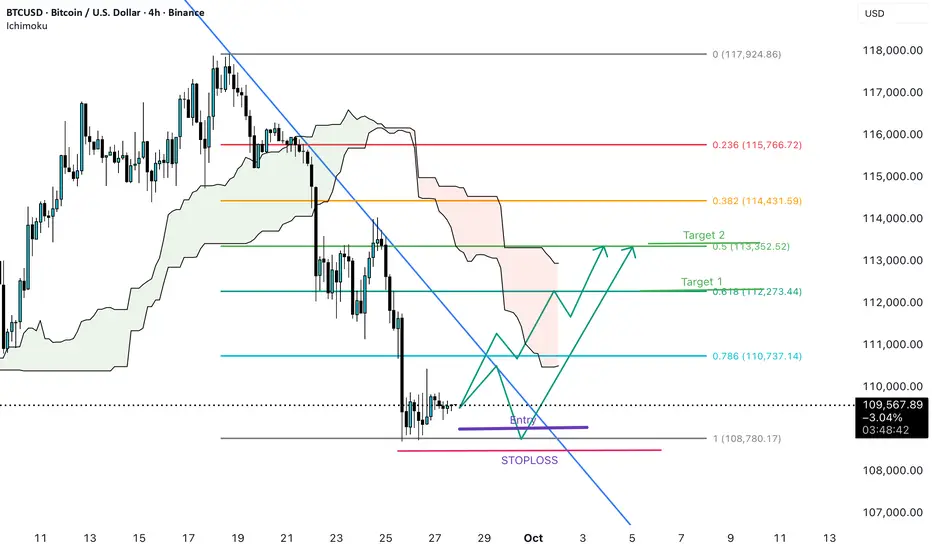
Btcusd healthy correction before it go up or further fall -levelBtc continuously falling from the resistance area of 118000 to 109000, before it further fall or go up health correction may be possible and price may go up to target 1 and target 2 which align with fib 0.5 and 0.618 level .Target 3 may also possible fib 0.382. Let us see how it plays out. SL .108500
Is is over for BITCOIN or new ATH is next ??Hi everyone.
Here is the summary of what i think about btc.
I expect a dip to mid 90s region. liquidity will be grabbed and then the path to new all time high in Q4 will be set.
I expect 130k - 140k region to be the top of this cycle for bitcoin.
meanwhile some altcoins will print massive pumps too.
I believe bear run can start in late Q1 2026 followed by a dip of a bear run in Q3 2026 where bitcoin can form bottom at 45k - 60k region.
follow me for more analysis and altcoins

BTCUSD – Last Chance to Go HigherOver the weekend, price found support just outside the white L-MLH. That’s where I previously mentioned the red Centerline — the target for the earlier short trade.
Now, however, price has jumped back into the fork. Tthis could be the last chance to break out of the down-sloping yellow fork to the upside.
P3 would be my next level to watch for support after the break of the red Centerline.

BTCUSD Another Bullish Impulse LoadingLooks like price is getting ready to break out again into another bullish impulse. Bullish flag and break of supply are my confirmations for going long.

Bitcoin top not is in. We can see that no local peak has yet been observed in terms of the cyclical logarithmic nature of Bitcoin.

BTCUSD My Opinion! SELL!
My dear subscribers,
My technical analysis for BTCUSD is below:
The price is coiling around a solid key level - 10923
Bias - Bullish
Technical Indicators: Pivot Points Low anticipates a potential price reversal.
Super trend shows a clear buy, giving a perfect indicators' convergence.
Goal - 11138
About Used Indicators:
By the very nature of the supertrend indicator, it offers firm support and resistance levels for traders to enter and exit trades. Additionally, it also provides signals for setting stop losses
Disclosure: I am part of Trade Nation's Influencer program and receive a monthly fee for using their TradingView charts in my analysis.
———————————
WISH YOU ALL LUCK

Bitcoin is ready for a vertical move and a stealthy surgeToday, let's examine why our work in this cycle isn't over yet, and why we haven't seen the peak or the cycle top. Key on-chain indicators still haven’t recognized the top, and we need to wait for its vertical move to begin. Every dip is just the market’s final slope and represents a buying opportunity. We are ready for the final phase of the market in Q4
