BTCUSDPreferably suitable for scalping and accurate as long as you watch carefully the price action with the drawn areas.
With your likes and comments, you give me enough energy to provide the best analysis on an ongoing basis.
And if you needed any analysis that was not on the page, you can ask me with a comment or a personal message.
Enjoy Trading ;)
BTCUSD.P trade ideas


BTC the definitive scenario : 134-135k then crashIn last days I supposed many targets for BTC (133k, 140k, 155k) but according to last price action my favourite scenario is a bull run to 134-135k area (138-139k area less probable) then massive crash and the beginning of the bear market.

BTCUSD — What to expect?Major Trend - Uptrend
Minor Trend - Downtrend
My EW counting review:
What do I see? My views are as follows:
1. Wave V completion is possible.
2- Possibly a new major wave is formed. Wave 1 (in the blue circle)
3- A correction wave 2 (in the blue circle) is in progress.
If this is correct, then the possible corrective waves are either zigzag or flat or complex (WXY or WXYXZ) to form new wave 2 in the blue circle. At this moment, I assume zigzag correction. Need more data and time for other possible waves.
4- Possible major wave V in the red circle completion.
If this is true, we are going to see major correction waves. Need more data and time to confirm the EW numbers.
Disclaimer:
My EW counting may be wrong, and this analysis is not recommended to buy or sell. Do your own technical analysis for confirmation.

Stress testing the latest in Trading-TechIt's taken man 100 years on the financial markets to be able to forecast on this level.
Now that I have the thinking structure of the latest AI models trained, I get to beta test them on live markets.
In this video I explain what it is I am testing and how I apply the predictions
The 30min chart is fast moving in comparison to the higher timeframes, so the structure of the price candles are messier. With that in mind, the AI models are holding strong... lets see if they can keep this up

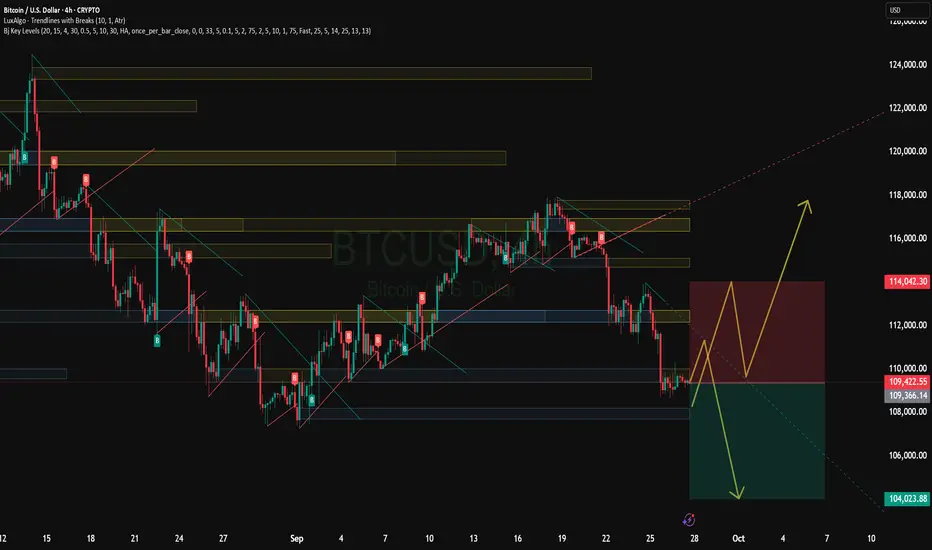
BTC Possible Scenarios for the WeekPossible Scenarios for the Week
Bullish scenario: BTC holds support at $110,000, breaks through $120,000, and heads toward $125,000-$130,000.
Sideways/consolidation: Movement between $110,000 and $120,000 without a clear direction.
Bearish scenario: Break below $110,000 — test of $105,000 and below.
Risks and factors to monitor
Fed policy and rate announcements can significantly influence the trend (as a driver for the USD).
Trading volumes: Weak volumes during breakouts may be false.
US macroeconomics, inflation, geopolitics — increased tensions could trigger volatility.
Is Btc STILL following this Eth Fractal? On Sept 9th I suggested Btc was following this Eth Fractal.
On Sept 12th I expressed concern for a lower low, and Btc seems to be heading lower now.
If Btc (on the 1 Day) is following this Eth (4 hr) fractal, then Btc may soon see a lower low (below 107). Alts may bleed harder.
I hope I'm wrong. But I am cautious for several reason, as also indicated in my other previously published charts.

I'm shocked at how good my AI forecasts are. I can't promise they'll always be like this, but as I feel the fails I too want to celebrate the WINS
This is the accuracy serious traders want to make money
(are you impressed yet?)

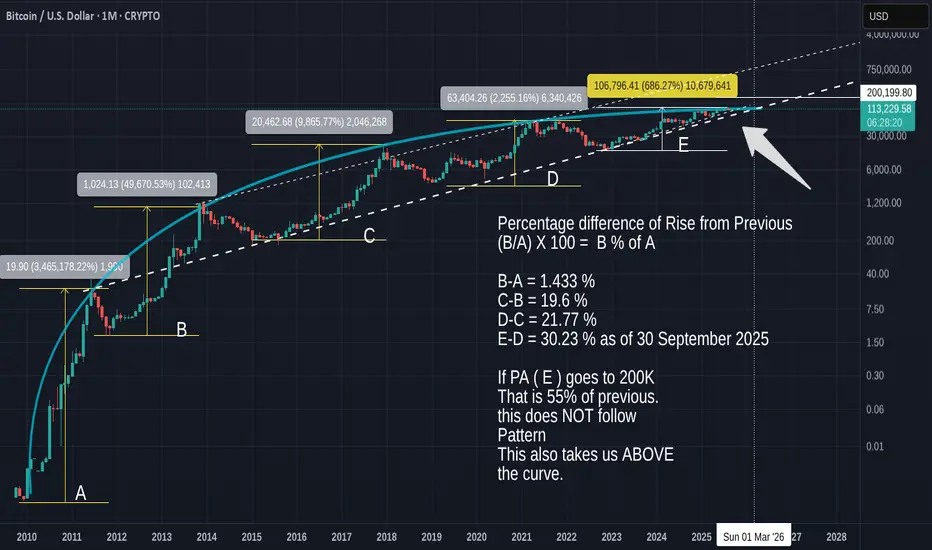
This BTC cycle has a higher % increase in PA than previous cycle
Many people are moaning about how Calm and Lazy Bitcoin is this cycle, all waiting for that mad parabolic push higher to ATH
And it may happen again, though I doubt it.
But as this post shows you, we have had already, a higher % increase over previous cycles
So, what is The % of increase over the previous cycles. Or, How much of the previous increase from Low to ATH was this cycle, in %. The same would be 100%, Half would be 50%
If you refer to the main chart for the letters.
(B/A) X 100 = B % of A
B-A = 1.433 % - The Rose from the Low to the Next ATH was only 1.4% of the previous increase.
C-B = 19.6 %
D-C = 21.77 %
E-D = 30.23 % as of 30 September 2025. A Larger increase that previously.
If PA ( E ) goes to 200K This cycle as many expect, That is 55% of previous increase.
This does NOT follow the last 2 [previous pushes that are in the long term channel of near 20 % on average.
This also takes us ABOVE the curve.
THE CURVE ( Blue) is a part of a Fibonacci spiral that has rejected every ATH since BTC began.
PA needs to rise above this Curve, as you can see, or we get pushed back down.
This Zoomed in Image of the same main monthly chart show this ckearly
PA has been trying to escape this Arc for a Long time now and is struggling a little but with the Strong line of support below, that has NEVER broken, we should be able to cross over and remain above this Arc.
We have till December 2025 before that arc begin to push PA back down in a negative Arc
I have explained in previous posts about this idea but here is the chart
So, the % increase of previous pushes WILL rise further
It has to
BTC one more probable scenarioBTC is falling from 124,5k ATH , if the falling stops @105k (0.618 fibonacci level) we could see last bullish leg targeting 155k new ATH and the end of bullish cycle

BITCOIN BUYERS WILL DOMINATE THE MARKET|LONG
BITCOIN SIGNAL
Trade Direction: long
Entry Level: 109,018.58
Target Level: 113,324.76
Stop Loss: 106,141.68
RISK PROFILE
Risk level: medium
Suggested risk: 1%
Timeframe: 9h
Disclosure: I am part of Trade Nation's Influencer program and receive a monthly fee for using their TradingView charts in my analysis.
✅LIKE AND COMMENT MY IDEAS✅

BTCUSD Short: Fading the Rally in a Bear ChannelHello, traders! The price auction for BTCUSD has been in a clear bearish phase since its rejection from the SUPPLY ZONE 2 near 115200. This has established a well-defined descending channel that has been guiding the price lower through a series of impulsive declines and corrective rallies, confirming that sellers have the initiative.
Currently, after testing the lower support line of the channel, the price is in the midst of a corrective bounce. This upward move is carrying the auction towards the upper boundary of the channel, which represents a major area of dynamic resistance.
My scenario for the development of events is that this corrective rally will fail upon testing the channel's resistance line, which aligns with the SUPPLY ZONE around the 111000 level. I expect this area to hold as strong resistance, causing a rejection and a continuation of the primary downtrend. The take-profit is therefore set at 107000, targeting a new lower low within the channel. Manage your risk!

$Btc Turning PointBitcoin has bounced from its lower low and is now pressing toward the upper wall, but here’s the catch — it still hasn’t printed a higher high. The market seems to be preparing for a potential higher low formation, yet the RSI slipping from the overbought zone hints at profit-taking.
What does this mean? If CRYPTOCAP:BTC confirms a new lower high and holds, we could witness a push upward as buyers regain control. But if that setup fails and a fresh lower low forms, a clear bearish phase might kick in. The coming sessions will reveal whether Bitcoin is setting up for a healthy continuation or a deeper downturn.
Keep a close watch — this zone could define the next big move.
#Bitcoin #CryptoMarket #BTCAnalysis #TradingView

Treasury General Account MAJOR Impact on $BTC PriceI’ll be the first to admit I failed to closely follow and analyze the impact of the Treasury General Account (TGA).
We all know it’s a liquidity suck on ₿itcoin and cryptocurrencies, which are the most highly sensitive assets to liquidity, but have you ever dove into the data to see just how impactful it is?
I went through all the refills and calculated how much it drew down the CRYPTOCAP:BTC price.
Note how TGA refills also marked cycle tops in 2017 and 2021.
This really is something to closely monitor going forward alongside Total Global Liquidity (TGL).
What I have found is when TGA refills are occurring, they have more impact on the price of BTC than TGL.
We can see this in the current state of market, where TGL is at an ATH and the TGA is currently being refilled.
GOOD NEWS: The TGA refill is just about complete 🏁
Moon on brave soldiers 🌛

BTC outlookThis is my outlook on BTC, derived solely from technical analysis with no consideration of fundamentals. I identify a potential buying opportunity within the green box area, with the most conservative take-profit target positioned at the 2.618 fibonacci level.

Will BTC come out of the downward channel?• In the chart you can see how we are close to the upper limit of the downward channel. This is a key signal - if the breaking persists, it may mean a change in the trend.
• We have several support levels from below (marked with red lines):
• 112,238 USD
• USD 108,981
• USD 107,040
• From the top you can see resistance (green lines):
• 115,266 USD (local resistance - the course is just approaching)
• 117 395 USD
• 119 404 USD
⸻
🔹 Medium walking (SMA/EMA)
• You can see EMA Cross 50/200 (yellow label) - a classic signal "Golden Cross" / "Death Cross". It seems that the average is raised recently, which the market often interprets as a signal of a potential change of trend.
• SMA #1 and #2 (red and green lines) - the course tries to stay above the average, which is positive.
• SMA #5 (blue line below) shows long -term support ~ 107k USD.
⸻
🔹 MacD (below)
• The histogram shows reversal - red posts decrease, and the lines (blue and orange) are approaching each other → possible buy signal.
• If the signal line is intersected up, this will be confirmed by the growth moment.
⸻
🔹 RSI (Relative Strength Index)
• RSI is currently around 40-50 →, i.e. a neutral level (neither purchase nor selling).
• It slightly reflects from below, which suggests that there may still be space for further growth before we enter the purchase zone (> 70).
⸻
📌 Summary
• Short -term (1-7 days): it looks like BTC is trying to stand out from the downward trend. If it pierces 115,266 USD and persists above, subsequent goals are 117 395 USD and 119 404 USD.
• Medium -term (weeks): support levels 112K - 108K are key. A decrease below 107k would negate a bull scenario.
• Technical signals: MacD and RSI give the first signs of reflection. The course balances on the border of breaking the trend.
👉 It looks at the beginning of a potential growth movement, but it will be crucial whether BTC will stay above 115K.


BTC BUYA double bottom is clearly visible and a bullish move has already started. Price has past a zone and is expected to continue moving upwards to complete the W pattern.
Your entry point is 113991,tp is 123441 and your stop loss at the dotted line which is at 111073.

BITCOIN Supply Area Ahead! Sell!
Hello,Traders!
BITCOIN price approaches the horizontal supply area, where SMC suggests bearish order flow may resume. Reaction from this zone could drive the pair toward the target at 113,300$. Time Frame 2H.
Sell!
Comment and subscribe to help us grow!
Check out other forecasts below too!
Disclosure: I am part of Trade Nation's Influencer program and receive a monthly fee for using their TradingView charts in my analysis.

BTCUSD Another Bullish Continuation PatternAnother bull flag has formed. Meaning another bullish impulse is loading.
Every time you see one of these, do not hesitate. Ride the trend.

Patience is Profit: The Unseen Poetry of Forex Risk Management⚠️ Shocking Truth in Forex Trading ⚠️
Most traders lose not because their strategy is wrong… but because they ignore risk management.
🛡️ Mastering Risk Management in Forex Trading
Risk management is the foundation of long-term success in Forex. Many traders spend their time perfecting entries and strategies, but the real edge comes from how well you manage risk, emotions, and capital. Without these, even the best strategy will fail.
📌 Position Sizing
📉 Never risk more than 1–2% of your account on a single trade.
📏 Adjust lot size according to your stop-loss distance.
⏳ Small, controlled risks keep you in the game long enough to let your strategy work.
🎯 Risk-to-Reward Ratio
⚖️ Always aim for 1:2 or higher risk-to-reward.
📊 Even with just a 40% win rate, a positive RRR keeps you profitable.
🔑 Focus on consistency rather than chasing quick wins.
🧠 Psychology of Risk
😨 Fear makes traders exit winning trades too soon.
💰 Greed convinces them to hold onto losing trades too long.
📝 Build a personal rule: “I follow my plan, not my emotions.”
✔️ Accept losses as part of the business—risk is simply the cost of trading.
📉 Drawdown Control
🚫 Avoid over-leveraging—it magnifies both profits and losses.
🛑 Cap your risk per trade to protect account equity.
🔄 Remember: a 50% loss requires 100% gain to recover. Capital protection comes first.
🔄 Consistency Over Perfection
🎲 No strategy wins every time.
🏦 Risk management allows you to survive losing streaks.
🎰 Think like a casino: edge + probability + discipline = profit.
🧘 Trading Psychology Habits
📖 Keep a trading journal to track results and emotions.
🧩 Detach from outcomes and focus on executing your plan.
☕ Trade only when your mindset is calm and focused.
⚖️ Golden Rule
💎 Protect your capital first—profits will naturally follow.
Discipline, patience, and controlled risk are the keys to turning short-term survival into long-term success.
✅ Final Thought: In Forex, your greatest weapon is not predicting every move but mastering risk management and emotional control. The market always rewards patience, discipline, and consistency—not reckless gambling.
📢 Follow me for more Forex insights, strategies, and trading psychology content.

Uptrend? what an interesting start to the week...
This trend didn't create a lower low on the dominant trend chart.
this either means some dodgy price action is going to fly in, or perhaps we've switched over to an uptrend.
I'm going to get to my AI forecasting upgraded to make daily predictions more frequent

LONG ON BITCON BTC/USDBitcoin has started its (New Downtrend) after it completed a change of character on the Daily on Aug 25th.
I am looking to catch the pullback to the next key level of supply before turning around and selling bitcoin to the next swing low.
On this buy trade I will be looking to make 5000 points.
