BITCOIN Is Going Up! Buy!
Take a look at our analysis for BITCOIN.
Time Frame: 9h
Current Trend: Bullish
Sentiment: Oversold (based on 7-period RSI)
Forecast: Bullish
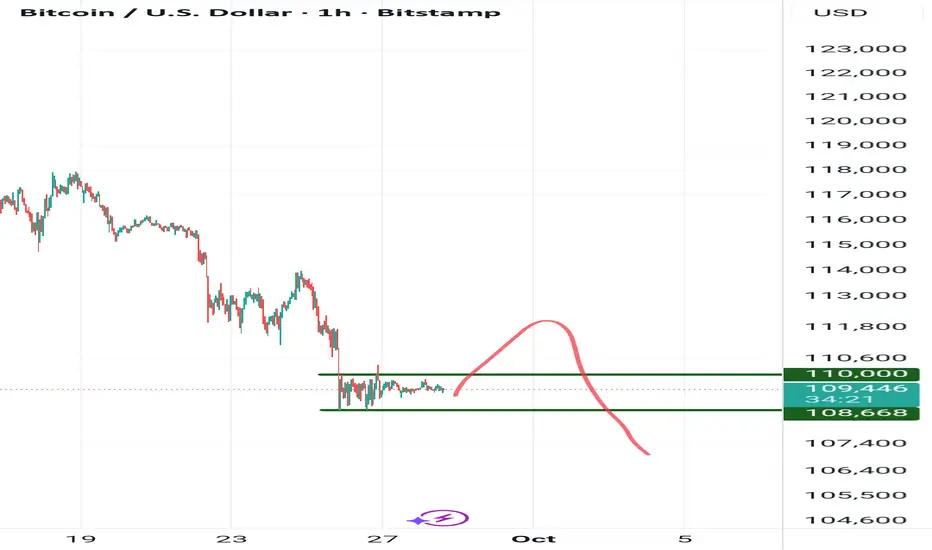
The price is testing a key support 109,230.63.
Current market trend & oversold RSI makes me think that buyers will push the price. I will anticipate a bullish movement at least to 112,035.52 level.
P.S
We determine oversold/overbought condition with RSI indicator.
When it drops below 30 - the market is considered to be oversold.
When it bounces above 70 - the market is considered to be overbought.
Like and subscribe and comment my ideas if you enjoy them!
BTCUSD.P trade ideas

BTCBitcoin has been trading between 3 main areas - $117K, 112K and 108K, for over a month. Yesterday’s move was encouraging, but found resistance (predictably) at $112K.
Not much to see here until we get a definitive move above 117K or below 108K (those zones, not exact numbers).

BTCUSD My Opinion! SELL!
My dear subscribers,
My technical analysis for BTCUSD is below:
The price is coiling around a solid key level - 10923
Bias - Bullish
Technical Indicators: Pivot Points Low anticipates a potential price reversal.
Super trend shows a clear buy, giving a perfect indicators' convergence.
Goal - 11138
About Used Indicators:
By the very nature of the supertrend indicator, it offers firm support and resistance levels for traders to enter and exit trades. Additionally, it also provides signals for setting stop losses
Disclosure: I am part of Trade Nation's Influencer program and receive a monthly fee for using their TradingView charts in my analysis.
———————————
WISH YOU ALL LUCK

Weekly Crypto Market Review: BTC, ETH, SOL, XRP, BNB, HYPEReview of trend structures and my expectations for the coming weeks on Bitcoin and key altcoins.
The key local support zones highlighted in the previous market outlook did not hold against selling pressure, increasing the likelihood of a more prolonged consolidation across the crypto space.
As long as prices continue to close below their local resistance areas, the base scenario remains in favor of further correction toward macro support levels.
Below is a brief summary of important resistance, support zones and potential trend structures I am following:
BITSTAMP:BTCUSD
Chart:
Resistance: 112–114.5k
Support: 103.5–101–98k
BITSTAMP:ETHUSD
Chart:
Resistance: 4115–4215
Support: 3700–3430
BINANCE:BNBUSD
Chart:
Resistance: 1020–1040
Support: 900–870–840
BITSTAMP:XRPUSD
Chart:
Resistance: 2.87–2.99 / 3.07
Support: 2.55–2.40–2.32
PYTH:HYPEUSD
Chart:
Resistance: 49–50–53
Support: 35.5–29–23
COINBASE:SOLUSD
Chart:
Resistance: 213–219
Support: 177–169
Thank you for your attention, and I wish you a successful week ahead.

Bitcoin - Bitcoin Left Behind the Stock Market!?Bitcoin is in its descending channel on the four-hour timeframe, between the EMA50 and EMA200. In case of an upward correction towards the specified supply zone, it is possible to sell Bitcoin with a better risk-reward.
It should be noted that there is a possibility of heavy fluctuations and shadows due to the movement of whales in the market and compliance with capital management in the cryptocurrency market will be more important. If the downward trend continues, we can buy in the demand range.
A group of U.S. lawmakers has called on the Securities and Exchange Commission (SEC) to enforce an executive order issued by President Donald Trump that opens the door for cryptocurrency investments within the $12.5 trillion 401(k) retirement fund market. Signed in August, the order authorizes 401(k) plans to offer cryptocurrencies as a new investment option.
Members of the House Financial Services Committee, in a formal letter, praised the order for its potential to help Americans boost their retirement savings. They urged the SEC to work with the Department of Labor to update existing rules and guidelines, with the aim of enabling millions of Americans to gain access to such investment opportunities for their retirement.
The letter further stated: “We also ask the SEC to review the bipartisan bills currently advancing in the 119th Congress regarding accredited investors. We hope these measures will allow the 90 million Americans who are currently excluded from alternative investments to secure a more dignified and comfortable retirement.”
Meanwhile, the Senate Finance Committee announced that it will hold a hearing this week on the issue of digital asset taxation, as industry stakeholders continue to press for greater clarity in federal regulations.
According to Committee Chairman Mike Crapo, the session—titled “Examining the Taxation of Digital Assets”—is scheduled for October 1. The official notice confirmed that Lawrence Zlatkin, Vice President of Tax at Coinbase, and Jason Somensatto, Policy Director at Coin Center, will testify at the hearing.
The committee had earlier invited public comments on how existing tax laws should apply to digital assets and whether new legislative frameworks are needed. The upcoming session is expected to draw heavily on the recommendations of the White House Digital Asset Working Group, which urged lawmakers to recognize cryptocurrencies as a distinct asset class and establish tailored tax rules separate from those applied to commodities and securities.
From a market perspective, liquidation heatmaps in the futures market highlight clusters of leveraged positions at key levels. When the price fell between $114,000 and $112,000, a wave of long liquidations occurred simultaneously, leading to heavy wipeouts and accelerating the downward momentum.
Risk pockets remain around the $117,000 level, making both sides of the market vulnerable to liquidity-driven volatility. Without strong demand at these levels, fragility persists, increasing the likelihood of another sharp downward move.

Bitcoin · The Next Leg Is LoadingBitcoin has been in a long consolidation, and I want to share a few things that stand out to me right now.
The Fed is lining up for a rate cut in December. Odds are now above 80% that rates will move down toward the 3.50%–3.75% range. Whenever liquidity opens up, Bitcoin tends to benefit. That’s one piece of the puzzle.
Another piece is regulation. Since the start of Trump’s second term, the U.S. has taken a friendlier stance. A strategic Bitcoin reserve, the Clarity Act, and crypto-friendly leadership at the SEC all point to a shift that gives institutions more confidence.
And then there’s Gold. It’s already at all-time highs. Historically, Gold runs first, Bitcoin follows. If the pattern holds, Bitcoin could be setting up for its next move higher.
On the chart, BTC is sitting around $111k. Price is under the 50-day MA but still well above the 200-day at $104k. That’s not a broken trend, that’s a pause. The real battleground is $111k–$108k. Hold that zone, and the path to $118k–$124k opens. Lose it, and we could be testing $104k next.
Sentiment is still cautious, even leaning toward fear. Funny enough, that’s often when Bitcoin starts building strength in the background. Meanwhile, altcoins are still enjoying liquidity while BTC moves sideways — the usual rotation we’ve seen many times before.
For me, the plan is simple:
Keep the BTC core position steady.
Trade alts tactically, don’t overstay.
Watch $118k — if we break through, it’s likely the start of Bitcoin’s next major leg.
Medium term, I’m looking at $150k–$180k this cycle. Long term, $200k+ isn’t unrealistic if the trend holds.
For now, it feels like the calm before the storm.
TheCryptoFire

Bitcoin: dip before the surge? BTC holds the lineBTC price entered into a stronger correction during the previous week as a combination of several topics. News is mentioning that whales (large holders) offloaded a significant volume of BTC which amplified downside momentum. At the same time, forced liquidations of leveraged positions additionally added to the downside. On the US macro side, posted PCE data of 2,7% y/y in August continues to build up investors expectations of two rate cuts till the end of this year. From the analysts point of view, this correction represents a normal move on markets, which is necessary in order to build a momentum to BTCs return toward the higher grounds.
Although BTC started the week around the $114K level, it soon reverted down, ending the week above the $109K level. The long term support stands at $110K, which is currently tested. The RSI dropped down to the level of 37. Clear oversold market side has not been reached on this occasion, indicating that there is still space for a price of BTC to move a bit lower, till the clear oversold market side is reached, where its reversal will start. The MA50 slowly converges toward the MA200, however, due to the distance between lines, the cross is still not in plan.
Monday trading session will set the sentiment for the trading week ahead. From the current point of charts, BTC might move toward the $108K to test this supporting line. This would also mark the end of the cycle, from where a new reversal toward the upside might start. On the opposite side, a break of $110K resistance would indicate a further move to the higher grounds, at least till the level of $112K. It should be also considered that Friday brings JOLTs job openings and Unemployment data in the US, which might be another volatile day on financial and crypto markets.

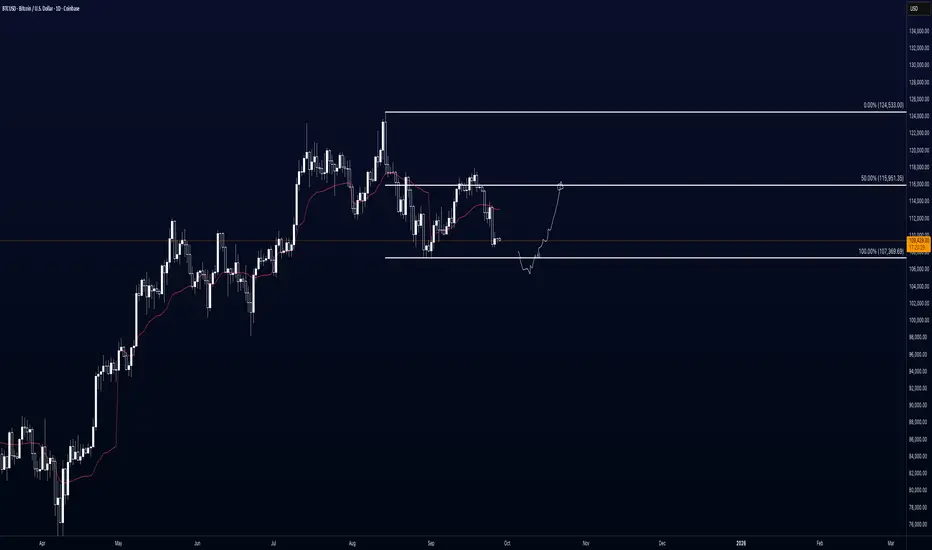
Bitcoin DROP & RISEThere is a possibility Bitcoin drop to daily 200MA at $104,700 and go up from that area to $138k

Saying goodbye isn't easy, but it's part of the journey.It was a good run. Play the small retraces if you dare, but be careful. See you next time.

Btc - Lower low incoming?Based on the "3 red week down rule" a lower low is expected (with high probability).
He's a simplified chart of what I am expecting in the short term.
May the trends be with you.

BTCUSD: Bearish Reversal on the Horizon?👋Hello everyone, what do you think about BITSTAMP:BTCUSD ?
Bitcoin is showing signs of a bearish reversal as it tests the lower boundary of its rising channel, with the likelihood of a breakdown below the trendline increasing. The diamond pattern also seems to be completing, signaling further downside potential.
Market sentiment remains cautious due to the recent rate hike by the Fed and a stronger dollar, both putting pressure on risk assets like Bitcoin.
A decisive move below the channel's support could trigger a sharp decline, targeting the $100,000 level. Keep an eye on these levels for trend confirmation.
💬What are your thoughts on BTCUSD’s outlook? Feel free to leave your comments below!
Good luck!

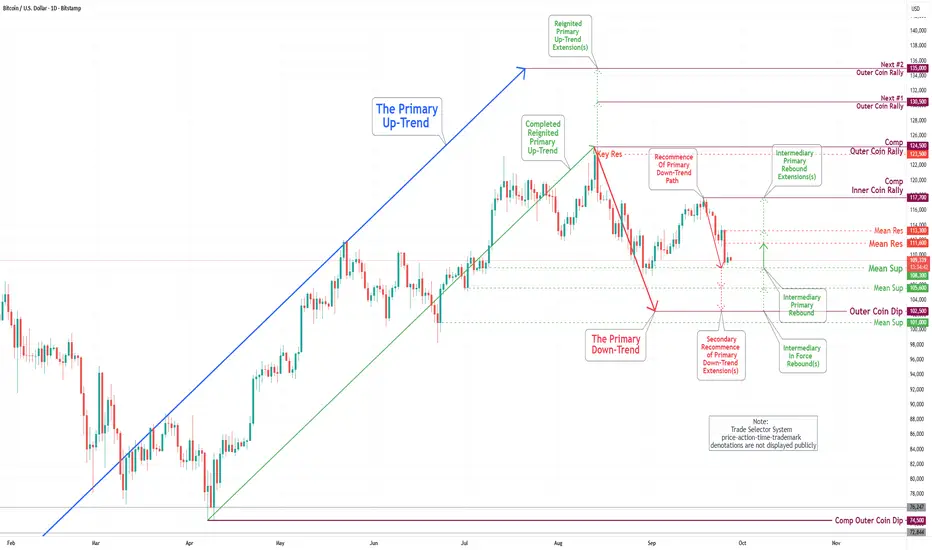
Bitcoin(BTC/USD) Daily Chart Analysis For Week of Sep 26, 2025Technical Analysis and Outlook:
In the most recent trading session, the Bitcoin market experienced a significant decline, surpassing Mean Support levels at 114500 and 111500, and is currently fluctuating around the Mean Support level of 108300. Consequently, Bitcoin is continuing its trajectory in a primary downward trend, with the primary target identified as the Outer Coin Dip 102500.
Current analysis suggests a modest likelihood that the continuation of the primary downtrend could lead to a retest of the Mean Resistance at 111600, potentially extending to the Mean Resistance at 113300.
Nevertheless, it is essential to acknowledge that the prevailing sentiment within the Bitcoin market remains bearish. Following the conclusion of the primary downtrend at the outer support level of 102500, it is anticipated that Bitcoin will resume its upward trajectory.
BTCUSD: Awaiting Rejection from the Seller ZoneHello everyone, here is my breakdown of the current Bitcoin setup.
Market Analysis
From a broader perspective, the price action for Bitcoin has been highly volatile, transitioning from a Downward Channel into the current Broadening wedge. This pattern is defined by higher highs and lower lows, indicating an ongoing battle between buyers and sellers with expanding volatility and no clear winner yet.
After failing to break the major Resistance at the 115800 level, the price has rotated down across the entire pattern. Currently, it is trading at a critical location, testing the ascending support line of the wedge, just above the major horizontal Support zone which starts at the 110000 level.
My Scenario & Strategy
My scenario is built around the idea of a potential 'fake breakdown' or a liquidity hunt below the wedge's trendline. I believe the market may make one final push down to test the major horizontal Support at the 110000 level. The key signal I'm watching for is a swift reversal after this potential dip.
Therefore, the strategy is to watch for this reversal. A successful reclaim of the wedge would validate the long scenario. The primary target for the subsequent rally is the 115800 Resistance, which represents a full rotation back to the top of the pattern.
That's the setup I'm tracking. Thank you for your attention, and always manage your risk.

Bitcoin Structure This Bull Cycle! Bitcoin Structure This Bull Cycle!
We are currently sitting at a very important support level, and in my opinion, we will most likely see a bounce to the upside, just as we’ve seen previously in this cycle.


BTCUSDBTCUSD needs sideways for few more days within this month and then will start a push up end of this month or early net month.
Disclosure: We are part of Trade Nation's Influencer program and receive a monthly fee for using their TradingView charts in our analysis.

107 the first target in downtrendSoon
After increasing price we can see another waves of downtrend to minimum 107000
BTCUSD - Bullish Bias🔹 Pair: Bitcoin (BTCUSD)
🔹 HTF Overview: Price remains strong and bullish, respecting higher-timeframe structure with clear upward momentum.
🔹 MTF Outlook: Waiting for midterm alignment—once a lower-high (LH) breach occurs, we’ll position for continuation with fresh OB areas.
🔹 LTF Setup: Currently in a deep anchor OB. Waiting for the hold and CHoCH switch before committing to long entries.
🔹 Targets: Higher liquidity zones above recent highs, aligned with bullish intent.
🔹 Mindset Note: Let smart money lead—patience ensures optimal timing and execution.

BTC (daily)- The second half of September has shown stronger red candles compared to the green candles in early September, indicating increased downward momentum.
- Based on the descending channel pattern, the price appears to be approximately halfway through its downward movement.
- The price is likely to clear the liquidity zones in Zone 1 and Zone 2 before advancing toward an order block.
- My target is where the lower border of the descending price channel converges with the price zone of the order block.

BTC Bias - HTF - Plan - 29.09-05.10BTC’s done basically nothing. We had a big reset on Thursday, then sideways into today. From here (Sunday) I’m expecting either more downside or a nasty pump into Monday that doesn’t take the lows - just enough to keep the hopeium alive. End of month and quarter make this tricky.
BitcoinOver the past four weeks, Bitcoin first returned above the local level of 112k before falling below it. Potentially, it could now head toward the 100k mark. The long-term trend remains upward, but a break below 100k would signal a potential reversal to the downside. In light of the above, we are keeping our outlook neutral.
Long-term trend: No
Resistance level: 125000
Support level: 100000

BITCOIN LOCAL LONG|
✅BTCUSD Price reclaims neckline support, showing ICT displacement from the demand area. Smart Money aims for higher liquidity toward 111,000$ to rebalance inefficiency. Time Frame 1H.
LONG🚀
✅Like and subscribe to never miss a new idea!✅

Bitcoin - MACD SignalLets look at the current bull run in Bitcoin from the Nov 2022 low around 16,000.
Major Support resistance - identified at 16000-20000 and at 66000-70000
Waves - there have been 4 impulsive waves and 4 corrective. The last 3 impulsive moves resulted in roughly 50K rise. The corrective moves have been Rectangles or Bull Flags.
Trendline - a supporting trendline can be identified , that has been touched on 3 occasions to date.
Moving Averages - since price has moved above the 200 period moving channel, the 20/50 MAV has stayed in a golden relationship. Note the more responsive 9 MAV has momentarily crossed below the 20 MAV at the low of the corrective cycle. Price also has tested the 50 MAV at each low.
MACD - The slow/fast signal lines crossed the Zero axis in March 23 and has stayed above for the duration. Each golden cross and dead cross approximates 4 weeks from a high or low in price. Additionally, if price moves outside the bollinger bands (signified by grey bars) , a consolidation soon follows. The bearish divergence of price and MACD signal is noted.
Where are we now ?
Primary Trend - Dow would suggest we are still in a Bull Market.
Signals - The MACD had a weekly dead cross on the 25th August 2025. Price been in consolidation since the 14th July 2025. The 9ema space to 20 ema is contracting, but it has not had a dead cross as yet. The 50 MAV sits at 98000. Trendline support 102000-107000.
Where to next ?
Bull Case - primary trend is up and until it bends down, Bitcoin appreciates. Support likely above 95000 and next leg to 150000. MACD golden cross comes in timely, so waiting for this confirmation would assist.
Bear Case - possibly a major correction if the trendline is broken comprehensively to the downside. MACD signal lines crossing below Zero would be the confirmation . The swing low of 75000 and the major support at 70000 would be the obvious projections.
