BTCUSDT weekly target get more link in bioBTC/USD | Short-Term Analysis
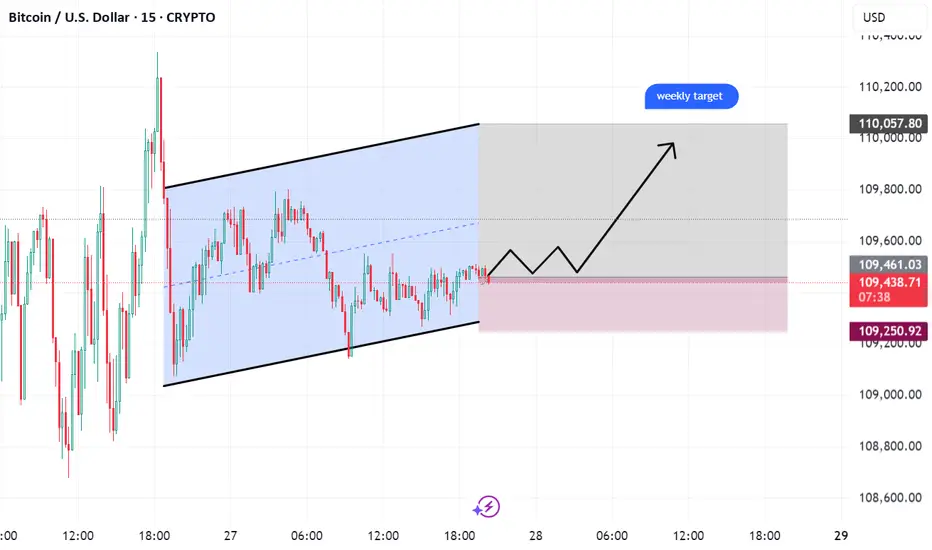
Bitcoin has bounced off the support zone and is now trading in an upward channel. Bullish momentum is expected in the next few hours after price consolidation.
Key Levels:
Support: 109,250 USD
Resistance / Weekly Target: 110,200 USD
✅ Trading Idea: Consider a buy setup when the price touches the lower channel, with a stop loss below support. Follow the upward trend to the weekly target.
Note: Be sure to apply risk management; the market is volatile.
BTCUSD.P trade ideas
$100,000 Bitcoin Might Not Be Far From Reality....“Fed Cut” was Already Expected
The 25bps cut had 99.7% probability priced in, so there was little surprise. Bitcoin needed more dovish forward guidance, not just a single cut.
This led to a “sell the news” effect: BTC jumped ahead of expectations and then hesitated.
Weak Spot Flows / ETF Pullbacks
Futures markets are active and leveraged, but spot volume is lagging, suggesting weaker real demand.
Although ETFs once fueled gains, some weeks show professional asset managers pulling back, slowing the rally.

BTCUSD Short Idea: Bearish Rejection at Former SupportHello fellow traders,
This is a technical analysis of a potential short setup on the BTCUSD 15-minute timeframe.
Analysis:
The chart shows that after a notable downward trend, the price of Bitcoin has been consolidating in a tight range. We are currently observing a retest of the key horizontal level around $110,425. This level previously acted as support, and the current price action suggests it may be flipping into a new resistance level.
The expectation is for the price to be rejected from this resistance and continue the prevailing bearish trend.
Trade Setup:
Based on the short position tool placed on the chart, the parameters for this trade idea are as follows:
Entry: Approximately $110,423.09
Stop Loss: $112,626.92 (This is placed above the recent consolidation high, providing a buffer against volatility).
Take Profit: $103,822.05 (This targets a lower price point, potentially a new swing low).
This setup presents a clear risk-to-reward profile.
Disclaimer: This is a trading idea for educational and discussion purposes only. It does not constitute financial advice. Please conduct your own research and manage your risk appropriately before making any trading decisions.

Saturday Bitcoin analysisSo far, Bitcoin’s trend is bearish, and the price is stuck in a range that seems to be getting tighter by the moment. Of course, in the next day or two we shouldn’t expect much movement because the Forex market is closed — unless some sudden major news comes out.
If the range breaks to the upside, we need to wait for a strong trigger, meaning clear signs of a trend reversal. But if the range breaks to the downside, we can enter a position even without a trigger, as long as risk management is applied. One important point: since the price has already dropped a lot, in case of a downside breakout we shouldn’t expect a high RR, because the trend could reverse at one of the support levels. ✅

I know you dont like me but.. but... the whole universe is a huge fractal. Repetition inside a repetition repeated over time. Trading and investing is not far away from philosophy.
Been showing this fractal for few years now :) its simple on point week by week.
Not an investment advice. Go to meditate.
BTS rules.

BTCUSD Bearish Flag Continuation: Short Setup Targeting $100,000Bearish Flag/Channel: The chart shows price action forming a downward-sloping, parallel channel after a prior drop (which isn't fully visible but implied by the setup). This pattern is commonly referred to as a bearish flag or descending channel, which is typically a continuation pattern.
Implication: A bearish flag/channel suggests that after this consolidation phase, the price is likely to break to the downside and continue the previous move lower.
Short Trade Plan
The chart outlines a specific short entry, stop loss, and profit target based on the potential bearish continuation:
Entry Point: $118,228.59
Interpretation: The trader is looking to enter the short trade on a retest of a previous resistance level or the top of the consolidation range, specifically a level around the potential breakdown area.
Stop Loss: $121,395.17
Interpretation: This is the price level where the trade would be closed to limit losses. It sits just above the entry point and the consolidation high, likely to protect against a false breakdown or a strong move back up.
Target Point: $100,481.05
Interpretation: This is the profit-taking level. It appears to be based on a measured move of the bearish flag pattern, projecting the distance of the "pole" (the move before the flag) downward from the breakdown point. It also aligns closely with the major psychological level of $100,000.
Risk/Reward
The setup, as drawn, shows a relatively favorable risk-to-reward ratio, which is generally a good characteristic for a trade:
Risk (from Entry to Stop Loss): $121,395.17 - $118,228.59 ≈ $3,166.58
Reward (from Entry to Target Point): $118,228.59 - $100,481.05 ≈ $17,747.54
Approximate R:R: 17,747.54/3,166.58≈ 5.6 to 1
Current Price Context
The current price at the time the chart was taken is $109,401.93.
This means the price is currently well below the proposed entry point of $118,228.59.
The price is sitting within the lower half of the drawn descending channel (bearish flag).
Possible Scenarios from Current Price:
Immediate Continuation: The price could break the lower boundary of the channel from its current position and head directly toward the target. In this case, the drawn trade setup would be missed, and the trader might look for a different entry on a retest of the broken channel.
Execution of Setup: The price could rally back up toward the upper boundary of the channel and the $118,228.59 entry point before reversing and heading down. This would allow the trade plan to be executed as intended.

3 Dangers of Trading DOUBT (Part 2)Trading isn’t just about charts, indicators, and strategies —
It’s a battle of the mind.
And lurking in the shadows is one of the most dangerous opponents you’ll face:
Doubt.
Doubt stops you from taking action.
Doubt kills confidence.
Doubt leads you to giving up.
So let’s go into why doubt is so dangers and how we can destroy this silent saboteur.
DOUBT #1: Search for Something “Better”
Doubt is where you don’t think something will help you achieve what you want to.
And so you’re on the perpetual quest of finding something new and “better”.
But you need to realise something.
There is NO such thing as the perfect system.
Strategy hopping will you to wasting money, time, effort and energy.
Instead, you need to embrace the imperfections in trading.
You need to perfect your strategy, execution and mind.
Keep at it and you will find that you always had the Holy Grail at your grasp.
Stick to a strategy long enough to learn its nuances and understand its strengths and weaknesses.
Remember, the grass isn’t always greener—it’s just different grass.
DOUBT #2: Failure to Take the Trade
Ever hesitated to take a trade.
Whether you’re trading gold, Dow Futures, JSE or Forex!
Then you end up watching the “imperfect” trade head straight to your profit target?
That’s doubt working its magic.
When doubt clouds your judgment, you start second-guessing yourself.
You start questioning.
“What if it is a loser?”
“What if I am in the wrong trading environment”
“What if my system stops working from here?”
Not taking the trade is one of the most subtle yet dangerous forms of self-sabotage.
To combat this, it’s crucial to develop a routine that instills confidence.
Preparation is key.
When you’ve done your analysis and the trade setup aligns with your plan, just take the trade (J.T.T.T).
Trust your process and let the trade play out.
You can’t win a game you don’t play.
DOUBT #3: Failure to Follow Your Risk and Reward Criteria
Every trader knows that managing risk is paramount.
Yet doubt can lead even the most seasoned traders astray.
When doubt creeps in, it whispers dangerous ideas.
“Maybe I should move my stop loss further”.
“Maybe I should risk more in this trade”
“Maybe I should risk less in this trade”
“Maybe I should drop my take profit to lock in a premature profit”.
When you deviate from your established risk and reward criteria, you’re going against your one and only proven and profitable strategy.
Your risk and reward criteria are there to protect you.
They are the guardrails that keep your trading on track.
Conclusion
Trading doubt is a silent killer.
It can creep into your mind, and sow seeds of uncertainty.
Let’s sum up issues with Doubt.
Stop Searching for Perfection: Embrace the strategy you have and focus on mastering it rather than endlessly searching for a mythical “better” one.
Take the Trade: Don’t let doubt freeze you into inaction—execute your plan and trust the process.
Stick to Your Risk and Reward Criteria: Discipline in following your rules will protect you from doubt-driven decisions that can derail your success.

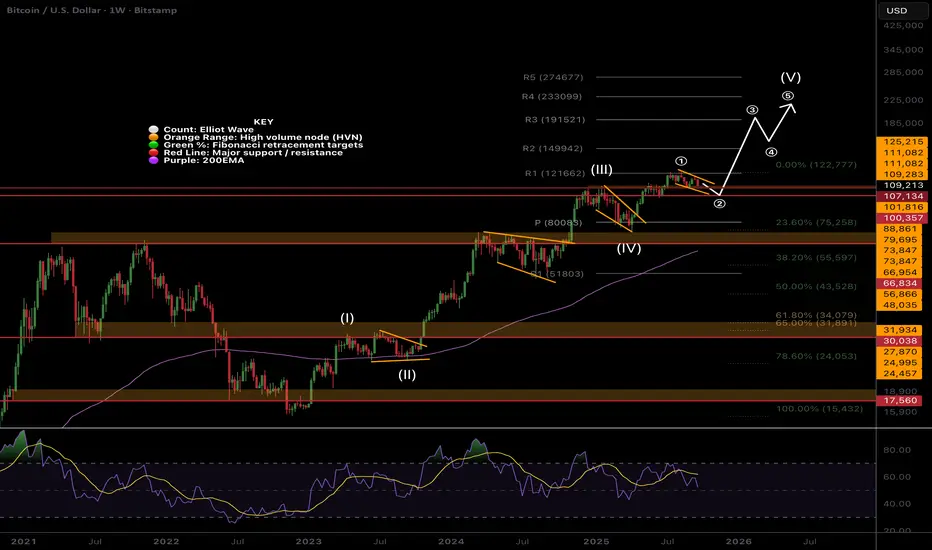
BTC Macro Outlook, Why all the Worry?When you zoom out CRYPTOCAP:BTC looks fantastic, sitting in a range at all time high, but the sentiment is extremely negative, a winning combination for continued upside!
Wave (1) of V into all high appears complete at the R1 pivot. Wave 2 has a downside target of the next High Volume Node at $107k the previous all time high range.
A deeper pullback to the weekly pivot would not be surprising and hit investors hard into capitulation, reminiscent of 2017. Price would meet with the rising weekly 200EMA around $80k. This move could present an excellent buy opportunity and would still have the same terminal targets in the long run!
For now the trend is up with price so far doing a x8 from bottom. TradFi dream of returns like this.
Weekly bearish divergences are dropping away as RSI is back at the EQ.
Safe trading
Do you think I'm joking ???Bitcoin, as you can see, is within a descending wedge. If it breaks down, the price could drop below $100k, but we should wait for the breakout confirmation.

[BTCUSD][Sep 26th, 2025] BTC start to go down from now BTC start to go down from now
Coin market exists a cycle: 4 years, but maybe in this cycle, its will go down sooner the previous cycles.
Maybe we have a chance: short from 110k to 70k

BTC REMAINS BULLISH!The bullish trend in BTCUSD remains bullish meanwhile, we can see that the price is consolidating from the daily timeframe forming a wedge pattern which signals possible bullish trend continuation. In couple of months to come. We’d likely see a breakout of the wedge pattern and price May attain a new all time high.

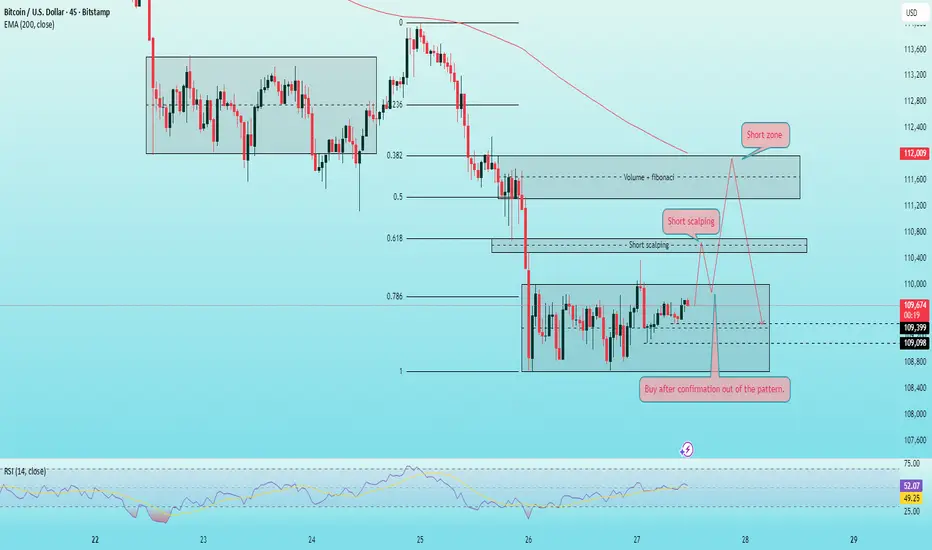
Bitcoin – Short-Term Trading Setup Into the WeekendBitcoin – Short-Term Trading Setup Into the Weekend
Technical Analysis
On the 45-minute chart, BTC has been moving sideways inside a rectangular range. This consolidation phase often precedes a strong directional move, and the eventual breakout will provide the confirmation for the next short-term trend.
Recent lows indicate that sellers are struggling to extend pressure, suggesting a higher chance of a relief move upward.
However, there is still the possibility of a fake downside break to sweep liquidity before price resumes higher.
110,000 is the key level to monitor for potential long entries – but only after a clear breakout confirmation.
For short opportunities, the 110,700 and 111,900 zones line up with both Fibonacci retracements and Volume Profile resistance, making them attractive areas for scalping or countertrend plays.
RSI (14) is sitting around 52, reflecting neutral momentum and reinforcing the need for confirmation before committing to a position.
Trade Scenarios
Long: wait for a confirmed breakout, entry near 110,000, SL below the nearest swing low.
Short: scale in around 110,700 and 111,900, SL ~400 points.
📌 I hope this outlook proves useful for your weekend trading. I share real-time signals within my community to help traders follow the market more closely.
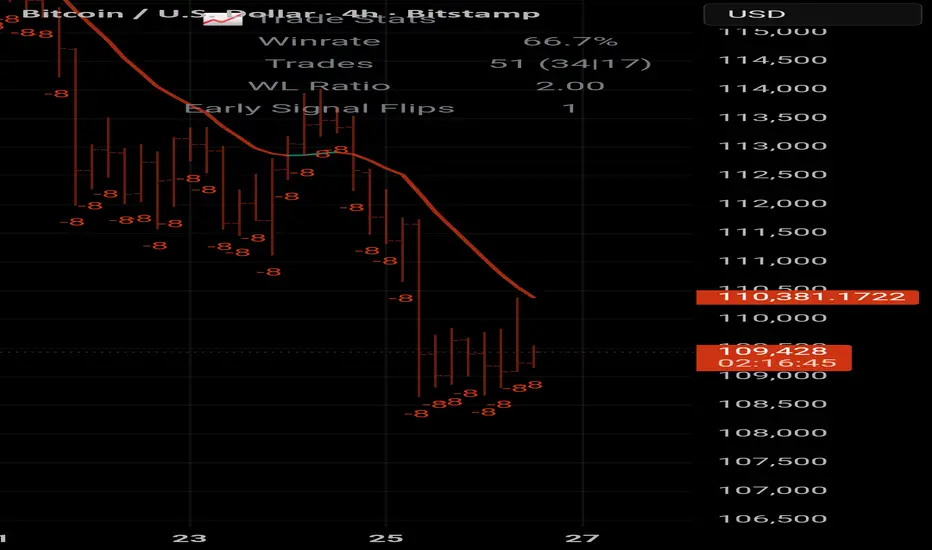
BTCUSD – Short-term Downward Channel.....BTCUSD – Short-term Downward Channel, Accumulation Before a Potential Rally
Good day traders,
On the H4 timeframe, BTC is moving within a short-term descending channel. After testing a strong support level, selling pressure has started to ease. That said, the 107.4k zone has yet to be retested, and it is quite likely the price will revisit this level once again.
Technical Outlook
Over the past week, BTC has traded in a highly technical manner – with clear ranges, precise reversal points, and a sustained channel structure.
Key Support: around 107.4k, coinciding with the Long Entry Zone.
Short-term Resistance: 110k – 111k, an area where price has frequently reacted during recovery moves.
Fundamental Perspective
From a fundamental standpoint, there are currently few factors pointing to a deeper decline in BTC. Furthermore, historical patterns suggest that October is often a month where BTC and the wider crypto market tend to recover. This underpins the likelihood of a strong rebound once support has been fully tested.
Trading Scenarios
Short towards support
Entry: 110.3k
SL: 110.8k
TP: 109k – 107.6k
Long at strong support
Entry: 107.4k
SL: 106.8k
TP:Strong reaction: hold the trade, adjust SL to breakeven, and aim for higher levels in line with the broader uptrend.
Weak reaction: close around 109k for a short-term gain.
Conclusion
Short-term: preference is to look for short opportunities near 110.3k, targeting a move back towards support.
Medium-term: watch for long entries around 107.4k, with the expectation that BTC could resume an upward phase into October.
Risk Management
Adhering to stop-losses is essential, particularly for longs at support, as this is the pivotal level that may determine BTC’s next direction.
This represents my personal outlook on BTC heading into the weekend. Please take it as a reference and adapt it to your own strategy.
👉 Follow me to share scenarios and receive the quickest updates when price structure shifts.

BTCIn the short term, Bitcoin is expected to move lower. The market is showing signs of weakness, suggesting a potential bearish wave in today’s session. Traders should be cautious with long positions and look for short opportunities while monitoring key support zones for possible rebounds.

BTC FALL BEFORE TAKING ANOTHER SHOT AT ATHJust my take on what MIGHT happen in the coming weeks
Feel another fall is likely before consolidating and taking another shot at ATH
Lets see what happens
(NFA - Trade at your own risk, don't blame me if you blow your account 😘)

#Bitcoin SELL SIGNAL Hello group. As of today we have a target at $105,000.00. We hit the last target of $109,00 to $108,009.
Just updating from our AI system model. Please use this as a guideline.
It one heck of a game to play. Please be very careful as Institutionals are also involved.
BTC Cycle PennantDoes anyone else see the MASSIVE wedge that has formed from the present and previous cycle? It is coming to a point and could create some very interesting price action in coming weeks to months of Q4 2025 into Q1 2026. Oh boy, this could be telling us that BTC is about to go parabolic, or completely NASDAQ:HIT the bed lol


BTC?
Hi,
Been flat quite some time. 20hrs exact.
Now time to make another move down
All the best
NB/ breaks = ready.. no.. wait
All the best again
Not a guru

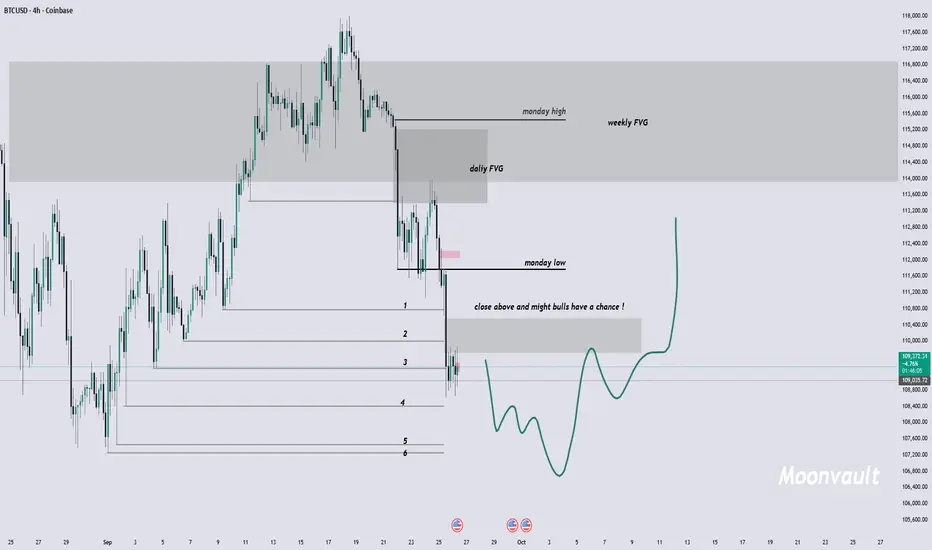
6line all you need $BTC Update: Always take those lines seriousCRYPTOCAP:BTC Update: Always take those lines seriously! 3 down, 3 more to go. Market's chilling at the 0.786 Fib level—not worth shorting here. Bulls could step in any moment, but definitely hold out to buy on that 6th line.
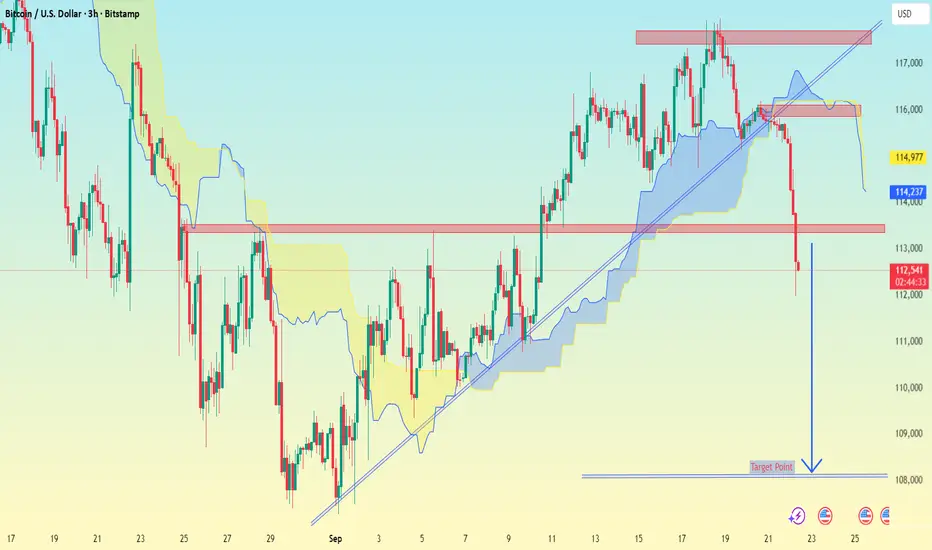
BTCUSD (Bitcoin / USD) chart on the 3H timeframe:BTCUSD (Bitcoin / USD) chart on the 3H timeframe:
Current price: 112,663.
BTC has broken below the trendline and Ichimoku cloud, confirming strong bearish momentum.
A major support at 113,000 has been broken.
The chart clearly marks a downside target.
📉 Target: Around 108,000 – 108,200 (as per your chart’s marked “Target Point”).
⚠ Key zones to watch:
Resistance (turned from support): 113,000 – 114,500.
If BTC retests this zone and fails, the move toward 108,000 becomes more likely.
If BTC closes back above 115,000, it could invalidate the bearish move.
👉 So my chart’s main target = 108,000 zone.

BTCBitcoin is expected to extend its bearish move with a potential target around 101,000. This level stands as a significant downside zone in the current Elliott Wave structure. Traders should maintain a cautious bearish bias, watching for short opportunities while monitoring key support areas for possible reversals.
