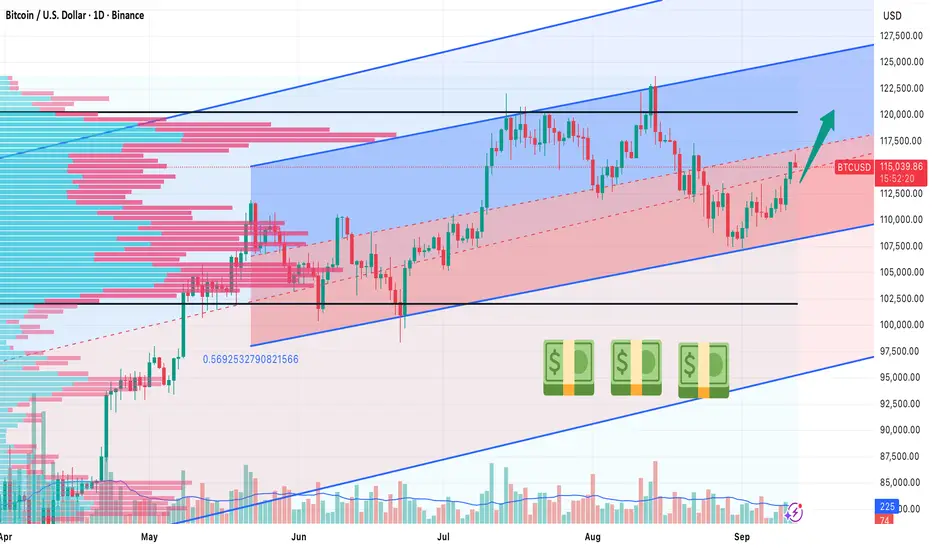
BTC/USD Near the Median of Weekly and Daily Regression TrendsHow to Approach the Setup
Long‑term bias: bullish (weekly regression channel slopes upward, daily channel is flat‑to‑slightly bullish).
Typical trader mindset: wait for an upward breakout with strong volume or place a buy‑limit order around the round‑number level of 115,000 USD and aim for an initial target near 120,000 USD (+4%).
Price action and technical context
BTC is currently trading close to the median line of two overlapping regression‑trend channels:
Weekly Timeframe: Channel slope Upward - Interpretation : Long‑term bullish pressure
Daily Timeframe: Channel slope Flat‑to‑slightly up - Interpretation : Short‑term equilibrium, slight upside bias.
The price sits in a narrow corridor bounded by the upper and lower regression lines. Because the weekly channel is tilted upward, the overall market structure still favors higher highs. The daily channel’s flatness suggests that any move will need a catalyst—typically a surge in buying volume or a breakout above the weekly upper trend line.
Key technical reference points
Upper daily regression line: ~125,000 USD – the first resistance level that, if breached with volume, could trigger a sustained rally.
Median (current price area): ~117,000 USD – a psychologically clean round number that also aligns with the median of both channels.
Lower daily regression line: ~108,000 USD – a safety net; a break below would invalidate the bullish bias.
Trade‑the‑setup options
1. Wait for a breakout – Enter the trade when the price closes above the weekly upper regression line and the accompanying volume is at least 1.5 times the 20‑day average. This condition confirms that the bullish bias is actually materialising and helps avoid false “whipsaw” moves. In practice, traders use a market order or place an aggressive limit order just above the breakout level (around 118,600 USD).
2. Buy‑limit at 115,000 – Set a limit order at the round‑number median of 115,000 USD. The round number acts as a natural “magnet,” and because the price is already near the median, this approach works well in a range‑bound market. The typical execution is a limit order at 115,000 USD with an initial profit target of 120,000 USD, representing roughly a +4 % gain.
Both methods assume the trader will monitor volume and short‑term momentum (RSI, MACD) to confirm that the move is not a temporary spike.
Momentum and volume cues
RSI(14): Values climbing above 55 support the bullish bias; a dip below 45 warns of potential reversal.
MACD: A bullish crossover (MACD line crossing above the signal line) on the daily chart adds confidence to a breakout or limit‑order fill.
Volume: A surge to at least 150 % of the 20‑day average on the day of the breakout dramatically raises the probability of a sustained move.
Risk considerations
Stop placement: If the price falls below the lower weekly regression line (≈111,000 USD) or breaches the median downward with a sharp volume spike, exit the position.
Position sizing: Because BTC’s volatility can be extreme, allocate a modest percentage of the portfolio (e.g., 2‑3 % of equity) to this speculative play.
Alternative defined‑risk structures: Traders uncomfortable with outright exposure can use a debit call spread (e.g., buy the 115,000 USD call, sell the 120,000 USD call) to cap downside while preserving upside to the first target.
Bottom line
When BTC/USD hovers near the median of a bullish weekly regression channel and a flat‑to‑slightly bullish daily channel, the market is in a neutral‑to‑bullish equilibrium. The prudent approach is either:
Patience: Wait for a volume‑driven breakout above the weekly upper trend line, or
Precision: Place a buy‑limit order at the clean 115,000 USD level and target the first upside milestone at 120,000 USD (+4%).
Both strategies rely on confirming momentum and volume before committing capital, while keeping a tight stop below the lower weekly regression line to protect against a sudden reversal.
BTCUSD.P trade ideas
Wow, looks like our new AI Support model really showed UPThe way it caught the initial little downward swoop caught my attention...
However it showing the place in where it was going to breakout from, man!! Just AWESOME

BTC 01.10Yesterday, I retested the 113k zone without confirmations or a decent loy, so I couldn't get a decent long run. Today is the beginning of the month + Wednesday, so they could beat up in both directions pretty well. The price is currently grinding along pdVAH and building liquidity from above without localized highs, with a high probability of withdrawals in the near future. The price is already above the main local resistance zones + yesterday's retest of 113k - which is basically a bull run.
The next resistance zone, R1, is in the 115600-115900 range (with a potential liquidity squeeze at 116150).
The closest normal support zone is S1, 111860-112240.
I'll be looking for trades from these two zones.
Support zones:
112240-111860
110780-111175
109980-110985
108200-108350
103.8-105.3
Resistance zones:
115635-115940
116770-117090
119.8-120.8

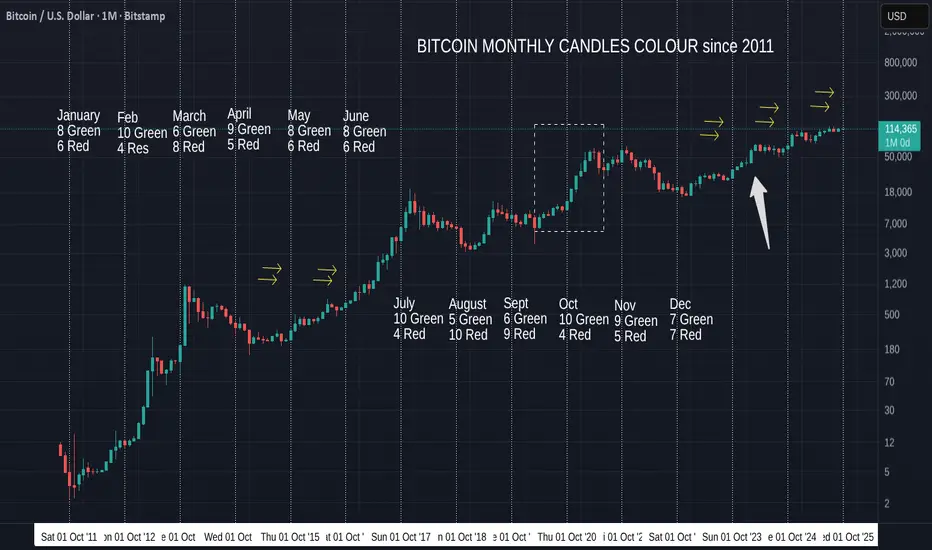
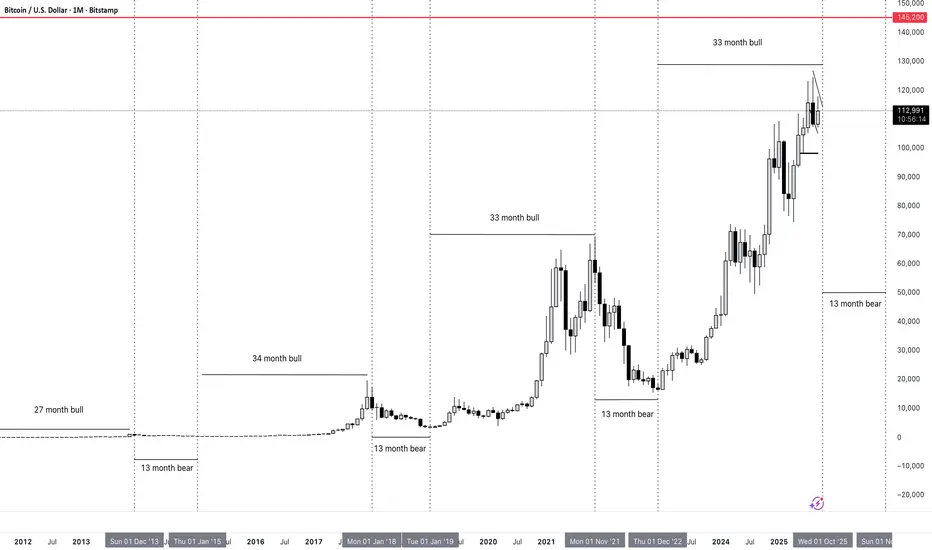
Bitcoin Monthly Candle Close colour & Patterns since 2011Septemer Closes GREEN
Where you see 2 Arrows is where we had a Green September after Red August Closes, as we have just had again.
All had Green Octobers Following.
Note those double arrows on the left are in the 2016 build up to 2017 ATH and the ones on the right are in the Current cycle.
Past October closes are 10 Green to 4 Red, so the Odds are we will see another Green October close, though it may not be a large candle.
InFacr, there are a few charts that point towards a Red start till around Second week, 12th - 15th October.
This of course can change but it maybe worth understanding that we may get a bloody month start.
However, given where we are in this Bitcoin cycle, assuming this one will continue as others have, we do not have a year plue left to reach ATH as the 2016 set of arrows would imply.
So my eye is now drawn to the Dashed box that leads up to the 2021 ATH in March 2021.
To many extents, that PA is very similar to that in 2023 (arrow) and if that is to be repeated, we could see a large recovery this month.
One thing that reslly needs to be mentioned is also how small the candles are now.
The pressure is on Bitcoin right now.
Of the 4 Red Octobers, only 1 was in a Bull run.
This months Candle Close Will certainly let us know where we are in a cycle.
That is IF we are still in a Cycle.
As mentioned in a number of posts now, the idea that Bitcoin will Drop away after the next ATH is possibly flawed.
But we have to wait and see what happens.
We can certainly look forward to a positive number of monthsd ahead for Bitcoin and this should take PA above a Long temm line of resistance that has rejected EVERY ATH since Bitcon started.( please refer to previous posts to learn more )
Happy October everyone and do not Panic if we do Dip further to start with
Btcusd h&s shortThe price action on btcusd is forming a head and shoulders pattern on the hourly timeframe.
Entry on the break of th neckline and tp to the next H4 demand zone.

possibility of uptrend Considering the price behavior at the current resistance range, possible scenarios have been identified. If the price breaks through the resistance range, the continuation of the upward trend is likely.

Bitcoin Approaching $114,500 Resistance, Breakout OR Rejected?At $114,500, the price of Bitcoin is currently getting close to the Classic Resistance level. As a result, there are several situations to think about. According to the Bull Case, the price of Bitcoin may continue its short-term upward trend if it breaks out of $114,500 with strong volume support. Nonetheless, there is still a chance that the price of Bitcoin will continue to drop to at least the $112,700 region if it can sustain trade and refuses the $114,500 region.

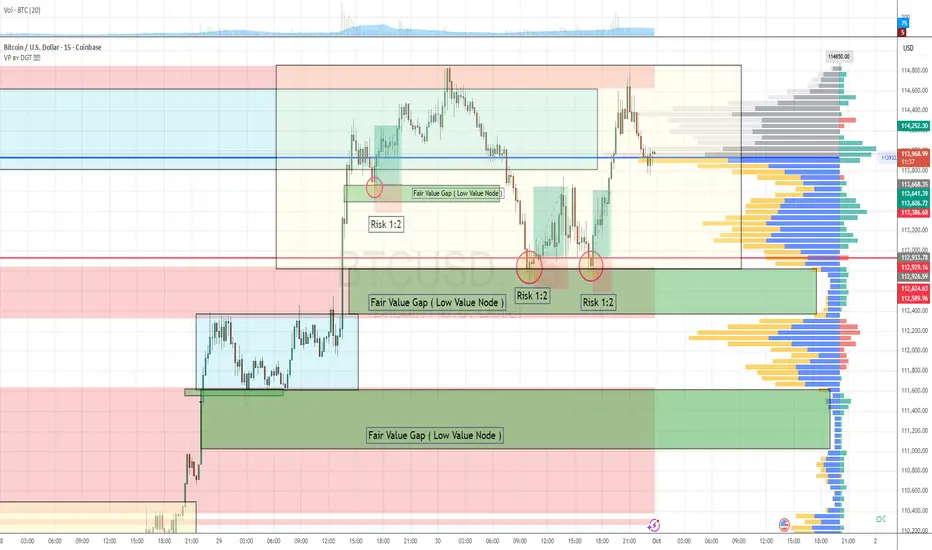
Order Flow & Fair Value Gap Approach 3 Setups in the last 48hourThis strategy leverages order flow analysis and the concept of fair value gaps, operating on the principle that the market behaves as an auction—constantly seeking areas of balance and imbalance.
Over the past 48 hours, BTCUSD has presented three high-probability scalping setups aligned with this methodology.
Market Context
Trend: Bullish
The market has shown clear bullish momentum over the last 48 hours.
Breakout Event:
Price broke out of a consolidation zone with strong, aggressive buying activity, indicating a shift in market sentiment and the initiation of a new leg in the trend.
Imbalance Creation:
During this breakout, two fair value gaps (FVGs)—also referred to as low value nodes (LVNs)—were formed as a result of inefficient price movement.
Trade Setup Criteria & Checklist
To validate each setup, we apply the following checklist:
Criteria Status
1. Trend is bullish ✅ Confirmed
2. Breakout from a consolidation zone with aggressive buy orders ✅ Confirmed
3. Fair value gap created by impulsive buying ✅ Confirmed
4. Retracement into the fair value gap ✅ Confirmed
5. Confirmation of strong buyers defending the FVG zone ✅ Confirmed
6. Defined risk with favorable R:R (1:2 or better) ✅ Confirmed
Risk Management
Each trade setup followed a 1:2 risk-to-reward ratio, maintaining consistency with our strategy's risk parameters.
This sequence illustrates how combining order flow with structural imbalances like fair value gaps can produce high-quality scalping opportunities. Always remember: context, confirmation, and confluence are key.
Was October Bitcoin's strongest month?BTC rose nearly $4,000 intraday, breaking through the $114,000 mark, but subsequently retreated lower. The 1-hour chart shows BTC trapped in a narrow range, fluctuating between $107,000 and $127,400. If the price falls below $107,000, a bearish double top pattern could form, leading to a further drop below $110,000. If the price rises above the moving average, selling pressure could weaken, potentially testing the all-time high.
Exchange reserves fell to 2.4 million Bitcoin in September, indicating increasing market accumulation and over-the-counter storage, and continued institutional support for Bitcoin.
Trading strategy: In the short term, Bitcoin prices remain uncertain. If they fall below the $113,200 support level, further declines are possible, so consider shorting. If the price rises above $117,500, consider entering a long position. For specific trading advice, please follow and contact us.

Bitcoin Under Pressure: Bearish Momentum BuildsBitcoin recently transitioned from a corrective decline into a consolidation phase, where price activity showed reduced volatility and market indecision. The breakout from this range has introduced renewed momentum, highlighted by strong bullish candles and a clear shift in trend dynamics. This move reflects fresh capital entering the market, suggesting growing investor confidence and positioning for potential continuation.
Despite this momentum, the structure also shows signs that rapid acceleration could invite short-term profit-taking, which may create phases of corrective retracement before the broader trend direction is reestablished. The market remains sensitive to global financial sentiment, liquidity cycles, and broader adoption narratives, meaning volatility should be expected even within an upward bias.
Overall, current conditions reflect a shift toward renewed optimism, with momentum favoring buyers while maintaining the likelihood of temporary corrections as part of a healthy market cycle.

BTC 1DLet's consider as the most probable scenario, a bullish movement, after liquidating the leveraged longs positioned at 112k.👁️👁️

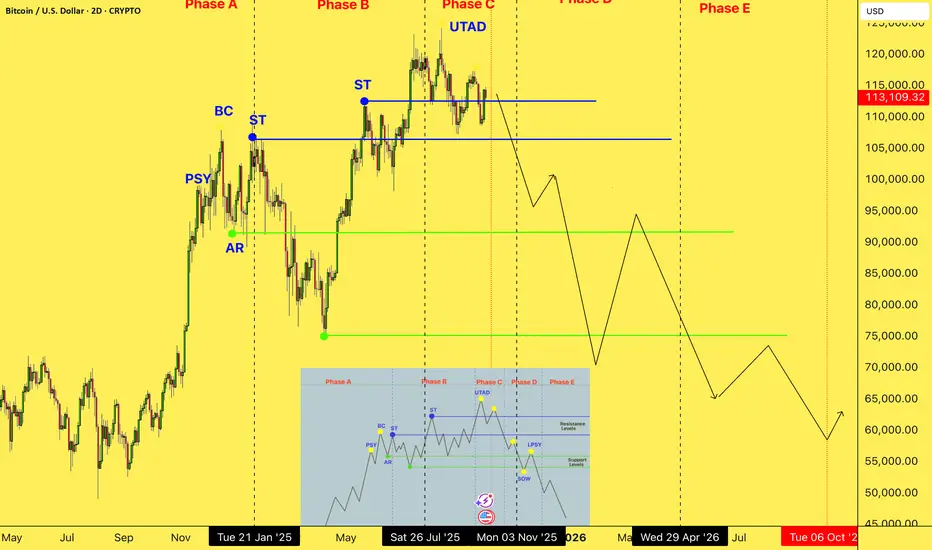
What do you think about it ? A Phase-by-Phase Breakdown of the Bitcoin Chart
(Refer to your chart, which will be the main feature of the post)
Now, look at the Bitcoin chart. The resemblance to a textbook example is striking:
Phase A (Stopping the Trend): We saw the Preliminary Supply (PSY) and the Buying Climax (BC), where the uptrend began to lose momentum.
Phase B (Building the "Cause"): A prolonged consolidation range where "smart money" began to carefully distribute their positions without crashing the price.
Phase C (The Final Trap): The most critical phase. We witnessed the UTAD (Upthrust After Distribution)—a final push upward that created the illusion of a continued rally. This is the moment of peak euphoria, designed to trap the last buyers. This is precisely where we are now.
Phase D & E (The Markdown): As the schematic shows, after Phase C, a sustained decline (the Markdown) begins, which marks the start of the bear market. The projected trajectory on the chart aligns perfectly with my plan to stay out of the market until September 2026.
BTCUSD corrective pullback support at 111,180The BTCUSD remains in a bullish trend, with recent price action showing signs of a corrective sideways consolidation within the broader uptrend.
Support Zone: 111,180 – a key level from previous consolidation. Price is currently testing or approaching this level.
A bullish rebound from 111,180 would confirm ongoing upside momentum, with potential targets at:
114,880 – initial resistance
115,480 – psychological and structural level
116,116 – extended resistance on the longer-term chart
Bearish Scenario:
A confirmed break and daily close below 111,180 would weaken the bullish outlook and suggest deeper downside risk toward:
109,840 – minor support
108,980 – stronger support and potential demand zone
Outlook:
Bullish bias remains intact while the BTCUSD holds above 111,180. A sustained break below this level could shift momentum to the downside in the short term.
This communication is for informational purposes only and should not be viewed as any form of recommendation as to a particular course of action or as investment advice. It is not intended as an offer or solicitation for the purchase or sale of any financial instrument or as an official confirmation of any transaction. Opinions, estimates and assumptions expressed herein are made as of the date of this communication and are subject to change without notice. This communication has been prepared based upon information, including market prices, data and other information, believed to be reliable; however, Trade Nation does not warrant its completeness or accuracy. All market prices and market data contained in or attached to this communication are indicative and subject to change without notice.

Bitcoin completing fourth bull cyclebtcusd completing 4th bull cycle fo 33 months.
Oct is the last month of this bull cycle
after it will retrace for 13 month as it did before 3 time
Oct target is around 145k
BTCUSDPreferably suitable for scalping and accurate as long as you watch carefully the price action with the drawn areas.
With your likes and comments, you give me enough energy to provide the best analysis on an ongoing basis.
And if you needed any analysis that was not on the page, you can ask me with a comment or a personal message.
Enjoy Trading ;)

BTCUSDHere we have BTCUSD in 30 minutes timeframe and is currently breaking the long bearish run. important of this new trend are already marked whenever the market reaches that marked zones awe will shift to smaller timeframe and look for a trend shift in smaller time frame.Once we have all the confirmations we will then look for a buy side trade.
IMPORTANT ZONES
50 percent area(111746)
75 percent area (110220)

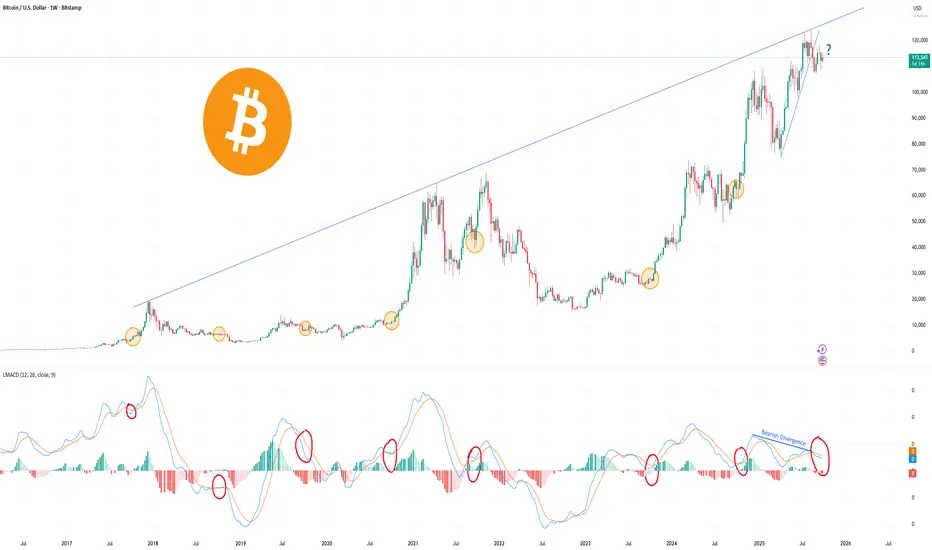
Is Uptober Coming for Bitcoin or Not? A Comprehensive AnalysisHello everyone, how are you doing? This morning I noticed something interesting. As you can see from the chart, I highlighted all the months of October with an orange circle, and I marked in red the corresponding MACD during October in previous market cycles.
As you can see, in almost all of these cases when the MACD is bullish in Q4, a strong price rally tends to follow. On the other hand, when it is bearish, the opposite happens.
In this Q4 the MACD looks similar to October 2019, and besides being bearish, there is also a strong bearish divergence on the weekly chart, highlighted with the (Blue Line).
Now, I’m not saying the bull market is over. I believe this market cycle is different from the previous ones. I think you’ve noticed it too, especially regarding altcoins and the altseason we’ve all been waiting for. Probably because many institutions have adopted Bitcoin and cryptocurrencies in general, with ETFs and many other factors coming into play.
As we can see, Bitcoin is becoming more and more “stable.” Personally, I think there’s a good probability that Bitcoin will continue its retracement downward, this retracement would be very healthy for the overall market, of course, not for altcoins.
What’s your take? Let me know in the comments, I’m very curious.
Thanks for reading this post. Feel free to share it with your trader friends, and don’t forget to hit like and follow. Thanks again, and I wish you a great day!
Bitcoin Bull Market Support Band!Bitcoin Bull Market Support Band!
Bitcoin is bouncing from the bitcoin bull market support band.

$Btc Turning PointBitcoin has bounced from its lower low and is now pressing toward the upper wall, but here’s the catch — it still hasn’t printed a higher high. The market seems to be preparing for a potential higher low formation, yet the RSI slipping from the overbought zone hints at profit-taking.
What does this mean? If CRYPTOCAP:BTC confirms a new lower high and holds, we could witness a push upward as buyers regain control. But if that setup fails and a fresh lower low forms, a clear bearish phase might kick in. The coming sessions will reveal whether Bitcoin is setting up for a healthy continuation or a deeper downturn.
Keep a close watch — this zone could define the next big move.
#Bitcoin #CryptoMarket #BTCAnalysis #TradingView

The beauty of the Sine WaveWhen using the Sine Wave as a validation to time , it can add the extra bit of information needed for where price would like to turn around at.
To give us the edge, I am making the AI system more robust so that it's easier to use on the TDV charts...
More on that in the next videos

Bitcoin Stalls as Shutdown Fears Meet Rate UncertaintyBitcoin hasn’t broken out just yet — it’s hovering in a tight range, waiting for signals to decide whether to sprint or stall. Amid talk of a U.S. government shutdown and fading clarity around rate cuts, traders seem hesitant to commit.
That said, institutional interest remains alive: U.S. Bancorp recently relaunched its institutional Bitcoin custody service, signalling banks are still gearing up for more crypto inflows.
Meanwhile, the broader macro backdrop — monetary policy expectations, dollar strength, and regulatory tone — continues to be the real tug-of-war behind each move.

correct again :)It's awesome watching the price action follow my predictions like this
it makes me feel the markets aren't real sometimes

check the trend Considering the price behavior within the current support level, possible scenarios have been identified.
If an upward trend is formed, it can advance to the resistance trend line.
