Fintradix Smashes Industry Benchmarks in Client ProfitsFintradix has announced record-breaking performance across its crypto trading platform, reinforcing its position as a leader in advanced market technology. The milestone underscores how a structured, research-driven approach can help traders navigate volatility while unlocking new benchmarks for profitability.
Surpassing Industry Standards
The cryptocurrency sector remains defined by rapid swings and persistent uncertainty. Fintradix has approached this challenge with proprietary trading systems engineered to identify opportunity with a high level of precision. By combining data-driven signals with risk-aware execution, the platform has consistently enabled traders to outperform widely used industry benchmarks.
Recent performance highlights demonstrate both resilience and scalability, showing how technology can turn market turbulence into measurable results. This outcome reflects a commitment not only to innovation but also to sustainable trading practices that emphasize long-term portfolio stability.
Algorithmic Power Meets Strategic Design
At the heart of this growth lies Fintradix’s algorithmic engine. Built on machine learning and predictive analytics, the system continuously adapts to market shifts in real time. This adaptability ensures responsiveness to new conditions, allowing clients to act decisively in fast-moving markets.
Accessibility has also been a key part of the design. Whether traders are managing modest portfolios or operating at higher volumes, the platform’s tools scale effectively without compromising speed or reliability.
Reinforcing Trust in a Competitive Market
Trust is a decisive factor in digital asset trading, and Fintradix has prioritized clarity in how signals and strategies are presented. Each recommendation is backed by transparent logic, enabling users to understand the reasoning behind trades rather than relying on opaque calculations.
Risk management protocols further strengthen confidence. Volatility indicators, stop-loss suggestions, and diversification metrics help mitigate downside exposure. This balance between growth potential and protection is central to the company’s approach and is consistently recognized as a differentiating factor within the sector.
Expanding Reach and Influence
Growth at Fintradix has extended beyond technology into broader market reach. With increasing global adoption, the platform has scaled to support diverse traders across multiple regions. Its infrastructure is designed to handle rising volumes while maintaining stability, allowing more investors to participate effectively in crypto markets.
This expansion aligns with a broader trend of mainstream financial engagement in digital assets. By focusing on both innovation and accessibility, Fintradix has positioned itself at the forefront of this transition.
Building for Long-Term Success
While short-term performance records are noteworthy, Fintradix continues to focus on long-term sustainability. The platform’s roadmap emphasizes ongoing research, algorithm refinements, and integration of advanced AI techniques to anticipate future investor needs.
By reinforcing transparency, adapting to regulation, and scaling responsibly, Fintradix demonstrates how technology can serve as a stabilizing force in an often unpredictable environment.
Looking Ahead
The company’s momentum signals that crypto trading platforms can evolve beyond promises of high returns into reliable ecosystems built for consistency and resilience. Fintradix’s trajectory reflects a growing maturity in the digital asset sector, where traders demand both performance and professionalism.
As global financial markets continue to embrace digital assets, Fintradix’s results illustrate how innovative systems, clear strategies, and a client-centric approach can redefine success in 2025 and beyond.
BTCUSD.P trade ideas
Could we see a bullish reversal from here?The Bitcoin (BTC/USD) is reacting off the pivot which is a pullback support that aligns with the 61.8% Fibonacci retracement and could rise to the 1st resistance which acts as a pullback resistance.
Pivot: 111,273.51
1st Support: 109,394.29
1st Resistance: 114,518.42
Disclaimer:
The above opinions given constitute general market commentary, and do not constitute the opinion or advice of IC Markets or any form of personal or investment advice.
Any opinions, news, research, analyses, prices, other information, or links to third-party sites contained on this website are provided on an "as-is" basis, are intended only to be informative, is not an advice nor a recommendation, nor research, or a record of our trading prices, or an offer of, or solicitation for a transaction in any financial instrument and thus should not be treated as such. The information provided does not involve any specific investment objectives, financial situation and needs of any specific person who may receive it. Please be aware, that past performance is not a reliable indicator of future performance and/or results. Past Performance or Forward-looking scenarios based upon the reasonable beliefs of the third-party provider are not a guarantee of future performance. Actual results may differ materially from those anticipated in forward-looking or past performance statements. IC Markets makes no representation or warranty and assumes no liability as to the accuracy or completeness of the information provided, nor any loss arising from any investment based on a recommendation, forecast or any information supplied by any third-party.

: DXY & BTC – Macro Calendar Meets Key LevelsThe macro tape stays busy this week:
• Powell’s latest comments cooled equity risk.
• The Bank of England announced changes to its foreign-currency reserve management.
• OECD interim report flagged resilient but uneven global growth.
• Gulf central banks cut rates while the Fed stays cautious.
My Technical View
Price action shows weekly buyers losing momentum while the dollar still presses higher.
We’re trading around the volume-range midpoint, so expect chop, but momentum favors the dollar for now.
Key DXY Levels
Support: 110.600 – a decisive close below opens the path toward the 107-ish range.
Deep liquidity zone: 102-area remains a magnet for market-maker discounting if selling accelerates.
Higher-timeframe bias: still bullish range, so any short plays are tactical, not “hold forever.”
Bitcoin
BTC tracks macro flows closely; watch how it reacts if DXY tests those supports. A sustained dollar breakout could pressure BTC’s recent strength, while a DXY fade would give crypto another tailwind.
Plan
Stay patient around the mid-range chop. Let the daily closes decide if the 110.600 break is real before scaling positions.
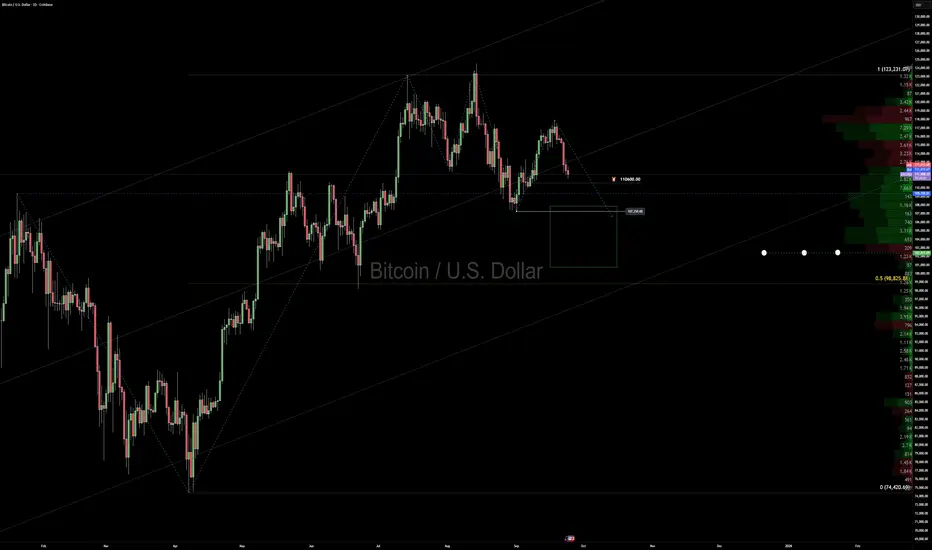
Cycle Over...Looks like this cycle is over and the top may be in - should expect quite a large retracement if this is correct.

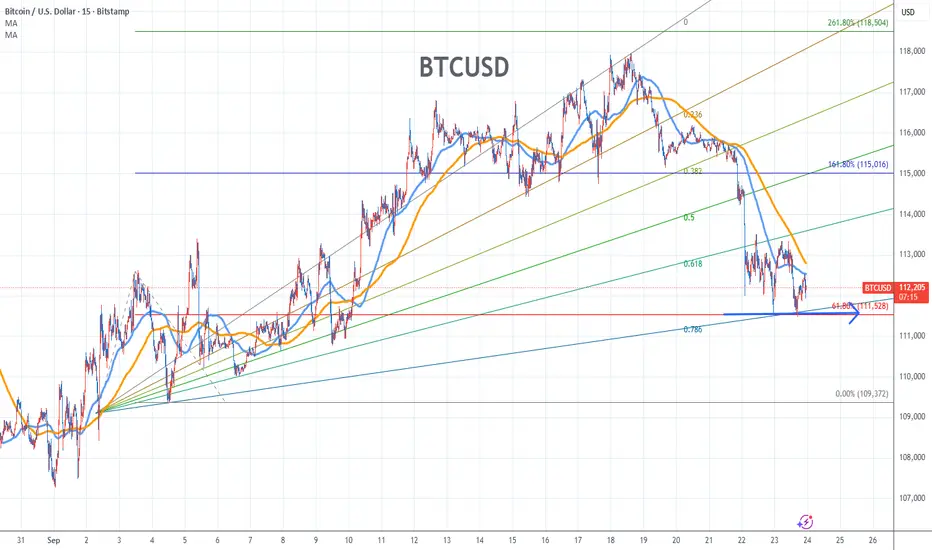
BTCUSD Chart Fibonacci Analysis 092325Trading Idea
1) Find a FIBO slingshot
2) Check FIBO 61.80% level
3) Entry Point > 111,528/61.80%
Chart time frame:B
A) 15 min(1W-3M)
B) 1 hr(3M-6M)
C) 4 hr(6M-1year)
D) 1 day(1-3years)
Stock progress:C
A) Keep rising over 61.80% resistance
B) 61.80% resistance
C) 61.80% support
D) Hit the bottom
E) Hit the top
Stocks rise as they rise from support and fall from resistance. Our goal is to find a low support point and enter. It can be referred to as buying at the pullback point. The pullback point can be found with a Fibonacci extension of 61.80%. This is a step to find an entry-level position. 1) Find a triangle (Fibonacci Speed Fan Line) that connects the high (resistance) and low (support) points of the stock in progress, where it is continuously expressed as a Slingshot, 2) and create a Fibonacci extension level for the first rising wave from the start point of the slingshot pattern.
When the current price goes over the 61.80% level, that can be a good entry point, especially if the SMA 100 and 200 curves are gathered together at 61.80%, it is a very good entry point.
As a great help, TradingView provides these Fibonacci speed fan lines and extension levels with ease. So if you use the Fibonacci fan line, the extension level, and the SMA 100/200 curve well, you can find an entry point for the stock market. At least you have to enter at this low point to avoid trading failure, and if you are skilled at entering this low point, with the fibonacci6180 technique, your reading skill of to chart will be greatly improved.
If you want to do day trading, please set the time frame to 5 minutes or 15 minutes, and you will see many of the low points of rising stocks.
If you prefer long-term range trading, you can set the time frame to 1 hr or 1 day
Towards 111.000?These are just my thoughts, based on my knowledge on technical analysis, this is not financial advice.

BitcoinHere's the setup on Bitcoin's 4H chart: We've got a clear RSI bullish divergence forming, which typically signals an incoming upside reversal in price action.
That said, don't front-run it—divergences often precede a final shakeout, like a retest of lower support or a quick dip to flush out weak hands before the real pump kicks in.
Based on historical patterns I've traded through, expect resolution within 3-6 days, possibly sooner. Stay vigilant for a clean breakout above key resistance; that's your confirmation to position long. Risk manage accordingly—stops below the divergence low.

BTCrend & Technicals
Trend: Neutral/bearish short term, but still inside rangebound action.
Support Zones: Key support at 111,463 (recent Lows).
Resistance Zones: Short-term resistance near the 112,199—112,248 region.
Indicators:
Bollinger Bands: Price near lower band, indicating possible oversold or breakdown risk.
MACD: Likely turning negative; watch for cross confirmation.
RSI: Mildly oversold conditions, but not extreme.
EMA (Exponential Moving Average): Price near the EMA; a loss below may escalate selling.
Trading Setups & Recommendations
Bullish Case:
If price holds above 111,463 and reclaims 112,199 on a closing basis, a move toward 112,750 (next supply) is probable.
Watch for RSI/MACD divergences for early reversal signals.
Bearish Case:
Loss of 111,463 opens up for more liquidations and strong downside momentum.
Volume spikes or sell-side clusters could trigger sharp moves to lower supports.
long entry
111,500
112,000
profit
112,400
112,700
113,000
stoploss: 111,200

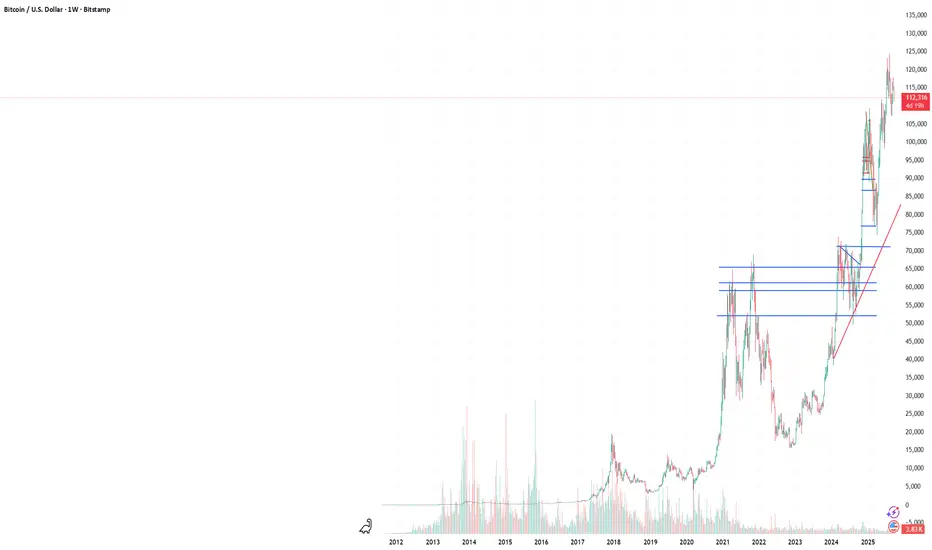
GROUND SHAKING: $BTC must breach $127K+ to keep the bull alive.🚨GROUND SHAKING: CRYPTOCAP:BTC must breach $127K+ to keep the bull alive.
It's the 2017 -> 2021 top-to-top trendline acting as final boss.
Break it = blue sky.
Fail = distribution risk.
Your move #Bitcoin ⚡️

Bitcoin near the end of a bull run (part 2)I want to show you something in the Bitcoin chart that not everyone will want to see, but it is worth considering...If Bitcoin retreats below 108k, then it may not go above 142k anytime soon. This comparison is with late 2020 earl 2021 bull run. A cool down is implied, at least.
Near the end of a bull run for BitcoinI want to show you something in the Bitcoin chart that not everyone will want to see, but it is worth considering...If Bitcoin retreats below 108k, then it may not go above 142k anytime soon. This comparison is with late 2020 earl 2021 bull run. A cool down is implied, at least.

Is Bitcoin Preparing for a Swing Buy Setup?Bitcoin is currently trading near the 111,500 level, where buyers have shown interest after a recent decline. This zone aligns with short-term support, making it a potential area for a rebound. A swing buy entry at 111,500 offers a favorable risk-to-reward setup, targeting 114,000 while keeping risk controlled with a stop at 110,500.
Key Levels
Buy Entry: 111,500
Take Profit: 114,000
Stop Loss: 110,500
Reasoning:
The 4H chart shows BTCUSD testing a support level after an extended pullback. Price rejection around this area suggests demand may step in. The stop loss below 110,500 protects against deeper downside, while the upside target at 114,000 matches the next resistance cluster. This provides a structured trade idea with balanced risk management.
Disclaimer:
This analysis is for educational purposes only and not financial advice. Trading involves significant risk; please manage your capital responsibly and follow your own judgment before entering any trade.

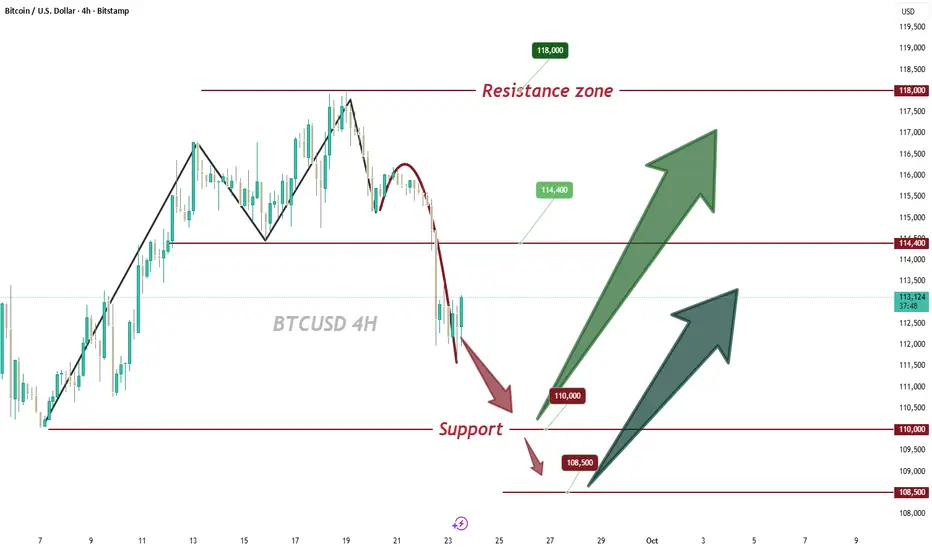
BTCUSD 4h ShortTerm Chart1. Main Trend
The chart clearly shows a descending channel – the recent upward breakout failed to hold, and the price has returned to resistance.
The pattern of lower highs (LH) and lower lows (LL) continues, likely indicating a break to a lower low.
The recent high at ~$118.3k has been rejected, and the market is heading down.
2. Key Levels
Support (red lines):
$111.426 – currently being tested.
$109.408 – stronger support, previous local lows.
$108.100 and $107.356 – further potential targets if the decline deepens.
Resistance (green lines):
$115.775 – the nearest significant resistance.
$118.322 – the upper boundary of the channel and the previous LH.
USD 122,367 – a key breakout level that would reverse the trend.
3. EMA/SMA
The 50 and 200 EMAs (blue/yellow) show a bearish cross, with the price below the averages → a negative signal.
The 200 SMA (~USD 114,137) acts as strong resistance, currently unbroken.
4. Indicators
MACD: lines strongly below the line, histogram rising in the negative zone → a downtrend with a predominance of supply.
RSI: ~33, close to the oversold zone (<30), which could result in a short-term rebound, but there is no upside divergence yet.
5. Scenarios
🔴 Bearish (more likely)
Continuation of the downward move towards 109.4k → 108k → 107.3k.
A break below 107k opens the way to 103–105k (LL2 on the chart).
🟢 Bullish (less likely)
A defense of 111.4k and a return above 114.1–115.7k.
A break above 118.3k would negate the downtrend and open the way to 122k+.

Bitcoin Reward – Bullish Thieves or Bearish Bandits?🚨💰 BTC/USD "Bitcoin vs U.S. Dollar" Crypto Market Grand Heist Plan 🎭🚨
🕵️♂️ Dear Thief OG’s, Money Makers & Market Bandits 💎💰
It’s time to lock & load the Bitcoin Heist Plan with both sides of the robbery open (Bullish & Bearish)! ⚡
🔑 Entry Zones (Where the Robbery Begins)
📉 Bearish Bandits: Any price level! Rob the upside liquidity & run it down!
📈 Bullish Thieves: Pullback entry 108,000.0 and above – sneak in with style & power.
🛑 Stop Loss (Escape Route)
🔒 For Bullish: Thief SL @ 105,000.0 🚨
⚠️ Reminder, OG’s: Adjust your SL with your own strategy & risk plan. Don’t get caught by the market police 👮♂️💥.
🎯 Target (The Loot Bag)
🏆 Bullish Robbery Target: 124,000.0 💸
🏴☠️ Bearish Robbery Targets:
1️⃣ 110,000.0
2️⃣ 104,000.0
📜 Thief’s Market Note
This isn’t just a trade, it’s a crypto robbery blueprint – choose your side, Bullish or Bearish, and execute like a true Thief Trader. Always plan your entries in layers, stack the loot, and manage your risk like a pro bandit. ⚡💼
🔥💥 If you love the heist style, Boost this idea 💥🔥
Every boost adds fuel to the Thief Trading Crew 🚀💎.
Stay alert, stay sharp, and remember… the market is the biggest bank, and we are here to rob it! 🤑🎭💰

Important Bitcoin SupportBitcoin’s drop currently has both strong momentum and a solid trend. If this momentum continues, there’s a chance that the support could break, with the next targets being 110, 109, and 107 respectively.
There’s also the possibility that this level holds as support, or that after a period of ranging, it gets broken with a whale move. In such situations, a sell stop can be a good option to avoid missing out if a whale candle breaks the level. ✅

Continue waiting for a reboundFor BTC, stick to buying low as we suggested yesterday 🐂. As long as the support level between 110000 and 111000 holds 🛡️, we can continue waiting for a rebound 📈
Buy @111000 - 111500
TP 113000 - 113500 -114000
Accurate signals are updated every day 📈 If you encounter any problems during trading, these signals can serve as your reliable guide 🧭 Feel free to refer to them! I sincerely hope they'll be of great help to you 🌟 👇
Btc is STILL following this Eth fractalIf Btc continues to follow this Eth fractal, one might anticipate a Btc bottom no less than 102K.
What are your thoughts?
May the trends be with you.

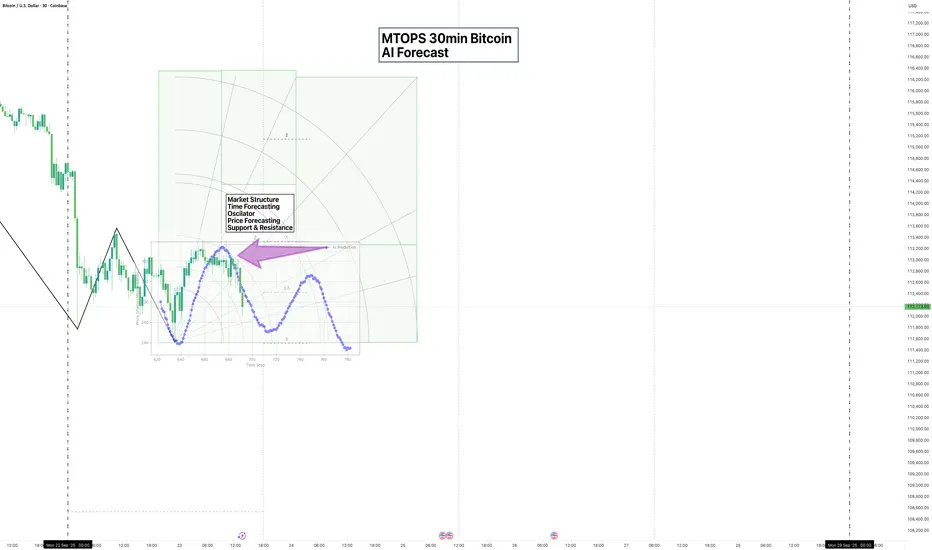
The AI predicted that move, and it nailed it! SO good to have itI have been without my AI for a couple of months because of a database migration which wrecked havoc on the code.
I finally got it stitched back together again...you don't know what you;ve got until it's gone...and man I'VE MISSED IT!!
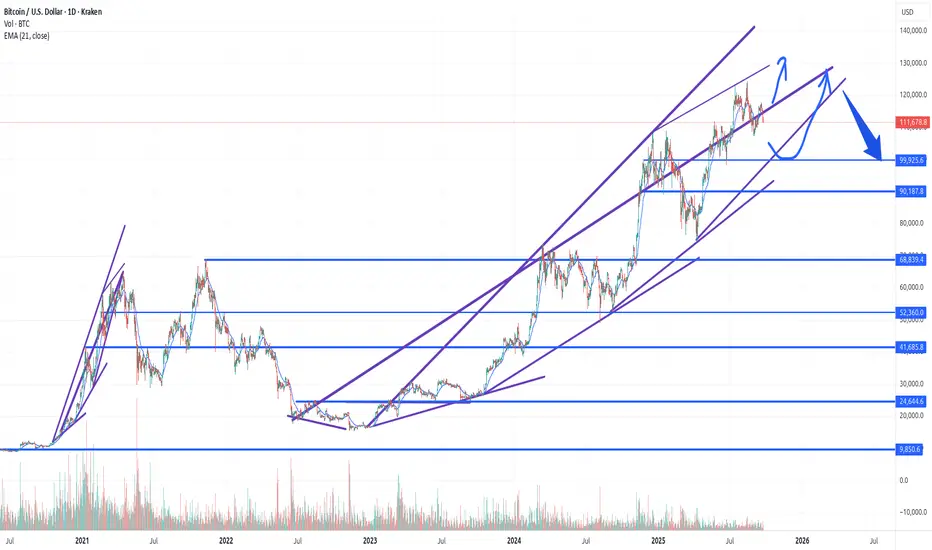
BITCOIN The hidden pivot of the Bollinger Bands (140k or 100k?).Bitcoin (BTCUSD) is testing again the basis (black trend-line) of the 1W Bollinger Bands (BB), just 3 weeks after it held and initiated a rebound.
On this chart you can see that since July 2023, every time BTC closed a 1W candle below the BB basis level, the price pulled-back to its 1W MA50 (blue trend-line) and then rebounded. That is its ultimate long-term Support so far.
As a result, all eyes should be on this week's closing. Below the BB basis, we should most likely seek the 1W MA50 a little above the $100000 mark. Ideally, it should coincide with a 1W RSI Support Zone test (holding since September 2023).
If the BB basis holds though, we should extend the BB top within the $130-140k Zone.
What do you think will come first? Feel free to let us know in the comments section below!
-------------------------------------------------------------------------------
** Please LIKE 👍, FOLLOW ✅, SHARE 🙌 and COMMENT ✍ if you enjoy this idea! Also share your ideas and charts in the comments section below! This is best way to keep it relevant, support us, keep the content here free and allow the idea to reach as many people as possible. **
-------------------------------------------------------------------------------
💸💸💸💸💸💸
👇 👇 👇 👇 👇 👇

Bitcoin Bearish Path Toward 110K📉 BTC/USDT Analysis
The market has been under continuous pressure after the earlier bearish divergence played out, leading to sustained downside momentum. Right now, Bitcoin is at a decisive zone, and three possible scenarios can unfold:
1️⃣ Dump Continuation:
Price could extend its fall toward the 110K area. From there, a small bounce toward 115K is possible before further moves unfold.
2️⃣ Rejection at 115K:
If the bounce to 115K faces rejection, BTC will likely form a new higher low and then resume its downward trend.
3️⃣ Break Below 107K:
If the crucial 107K support is lost, this confirms a new lower low, opening the path for a sharper correction, possibly down to the 90K zone.
🔎 Current Outlook:
The bearish pressure is dominant, and a dump looks likely in the immediate short term (within the next 1–2 days). The coming sessions will decide whether Bitcoin holds higher support or sets a new lower low.
⚠️ Key Levels to Watch:
Support: 110K / 107K
Resistance: 115K
Downside Target if breakdown confirms: 90K

Following BTC’s retracement and corrective phaseBTC underwent a sustained retracement yesterday, yet it failed to breach our downside support level at 111000. Subsequent price action formed a range-bound consolidation phase above this support zone. Consequently, we assess that following yesterday’s sharp pullback and corrective phase, BTC is now in a state of short-term oscillatory movement within the context of its broader uptrend.
Buy 112000 - 112500
TP 113000 - 113500 -114000
Daily-updated accurate signals are at your disposal. If you run into any problems while trading, these signals serve as a reliable reference—don’t hesitate to use them! I truly hope they bring you significant assistance

BTCUSD – Dealing with Surprise Pockets of VolatilityCryptocurrency markets can be susceptible to large swings in sentiment that can arrive out of nowhere and lead to outsized moves with potentially little rational behind why they have happened. These moves may be due to large one-off flows, reaction to news events, or just the liquidation of excessive positioning when a move may have run its course in the short term.
It seems that yesterday’s drop could have been one of those days. BTCUSD opened Monday around 115500, right in the middle of its recent 110-118k trading range of the last 3 weeks. Then, at the start of trading in Europe the price dropped quickly to touch a low of 111533 before rebounding. This type of surprise move can catch traders unaware or worse can evoke an emotional response that can lead to making a rash decision regarding the execution of a new or existing position.
To help protect against this type of reaction, from a risk management perspective it can be helpful to assess the charts at the start of each day to get a feel for market sentiment and positioning, as well as to try and identify some relevant support and resistance levels to monitor, alongside the current BTCUSD trend on the particular timeframe that you are trading.
In the technical assessment below, we provide examples of this type of approach that you could adapt to fit your own style.
While, BTCUSD prices have edged back higher again this morning, this pre-trading routine can become a quick and useful way to assess cryptocurrency markets.
Technical Update: Assessing the Technical Backdrop
Monday’s sharp decline might well have caught many traders off guard, prompting emotional reactions and potentially rash decisions. As experience shows, emotion-driven trades often lead to poor timing - buying near session highs or selling near market lows.
While sharp price moves are unpredictable, preparing ahead of the trading day or week may help manage the emotional challenges that come with trading.
Forearmed is Forewarned
Before starting your trading day, build a routine that includes reviewing charts across multiple timeframes, such as 15 minute, 1 hour, 4 hour, daily or even weekly, for the assets you plan to trade. This broader perspective might help you spot key trends and make more informed decisions.
This doesn’t need to be a deep analysis, just note the trend direction across different timeframes to get a clearer picture before trading.
For a quick trend check, you can consider using the Bollinger Band mid-average (typically the 20-period moving average). If it’s rising, the asset is likely to be in an uptrend; if its falling, a downtrend; and if flat, it suggests a sideways range.
When analysing multiple timeframes, keep in mind that longer-term trends may carry more weight. For example, a trend on a 1 day chart is perhaps more significant than one on a 5 minute chart. Short-term trends can reverse quickly, while longer-term moves tend to be more stable and influential.
Consider using your trend assessment to shape your trading bias for the session. You may find it’s more effective to trade with the dominant trend rather than against it, at least until there's clear evidence of a price reversal.
Be Aware of Support and Resistance Levels
In addition to identifying the current trend direction, it's important to pinpoint key support and resistance levels for the session. These levels can help guide entry and exit decisions, highlight potential turning points, and provide structure to your trading plan.
Keep these levels close to you throughout the day. Perhaps identify one key support and one resistance level, if either is breached, it may signal your initial assessment was incorrect and a trend reversal is underway.
Support is often marked by prior lows or areas where buyers previously halted a price decline and helped restore the prevailing uptrend. Consider placing sell stop losses below a support level you have identified.
Resistance is typically identified by prior highs or areas where sellers previously capped a rally and reinforced the prevailing downtrend. Think about placing buy stop losses above a resistance level you have outlined.
A rising Bollinger mid-average also often serves as support, while a falling mid-average can signal resistance.
Fibonacci retracement levels - 38.2%, 50%, and 61.8% - can also highlight potential support levels during pullbacks in an uptrend or resistance levels during recoveries in a downtrend. These may also be useful additions to be included in your pre-trading routine.
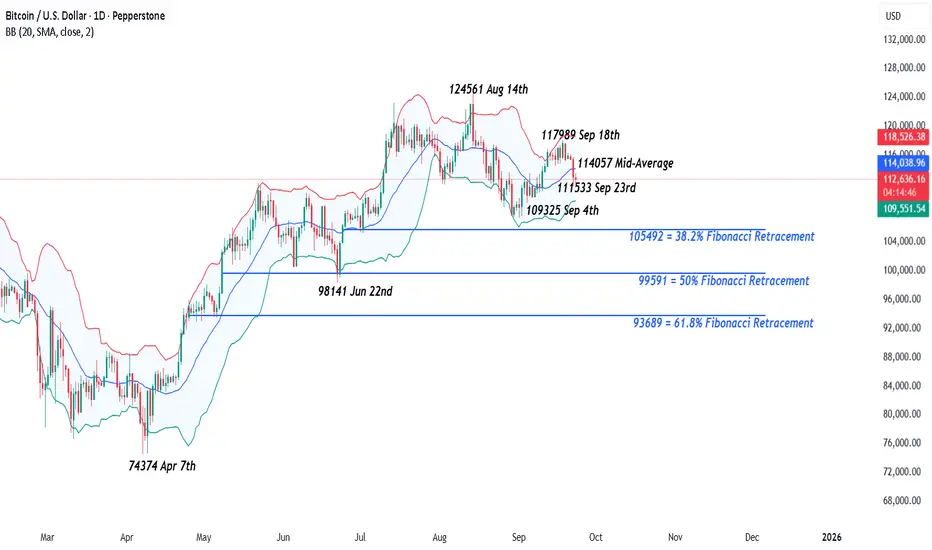
The chart above highlights examples of possible support and resistance levels for Bitcoin within the daily timeframe.
Let’s now look at what might be the current daily trends and support/resistance levels for Bitcoin for the daily perspective
Potential Daily Trend:
Monday’s sharp sell-off did see a break below what at the time was potential support, marked by the Bollinger mid-average, and price action staying below the average may suggest risks of a downtrend.
However, as shown in the above chart, the daily Bollinger mid-average is currently flat, indicating Bitcoin may be in a daily sideways range. A downturn might suggest a developing downtrend, while an upward shift in the average could signal a renewed uptrend.
Potential Daily Support and Resistance Levels:
The Bollinger mid-average currently at 114057 may suggest an initial daily resistance. A break above this level might lead to further strength, with the September 20th high at 116205 and the September 18th peak at 117989 as potential next resistance levels.
The recent low at 111533 may now be considered as an initial daily support level. A close below here could shift the focus to the September 4th low at 109325 as the next support to monitor.
You can of course refine these levels by analysing shorter timeframes to match your trading style and perhaps spot near-term opportunities.
However, by understanding key trends and support/resistance zones across various timeframes before the trading day begins, you may well find you are better equipped to deal with unexpected price swings with more balance and less emotion.
The material provided here has not been prepared accordance with legal requirements designed to promote the independence of investment research and as such is considered to be a marketing communication. Whilst it is not subject to any prohibition on dealing ahead of the dissemination of investment research, we will not seek to take any advantage before providing it to our clients.
Pepperstone doesn’t represent that the material provided here is accurate, current or complete, and therefore shouldn’t be relied upon as such. The information, whether from a third party or not, isn’t to be considered as a recommendation; or an offer to buy or sell; or the solicitation of an offer to buy or sell any security, financial product or instrument; or to participate in any particular trading strategy. It does not take into account readers’ financial situation or investment objectives. We advise any readers of this content to seek their own advice. Without the approval of Pepperstone, reproduction or redistribution of this information isn’t permitted.