Bitcoin to 150kThe head and shoulders pattern is a chart pattern that signals a change in trend. This pattern is identified by three consecutive peaks, with the middle peak being higher than the others. This pattern rarely occurs on larger time frames such as daily, weekly, or monthly, but when it does, we experience very strong movement, in this case, for Bitcoin, upward movement. We could easily reach the 150,000 mark, a 33.33% change. We have the 112,500 range as the first support of August, and a breakout of 120,000. This will be a significant increase!
BTCUSD.P trade ideas

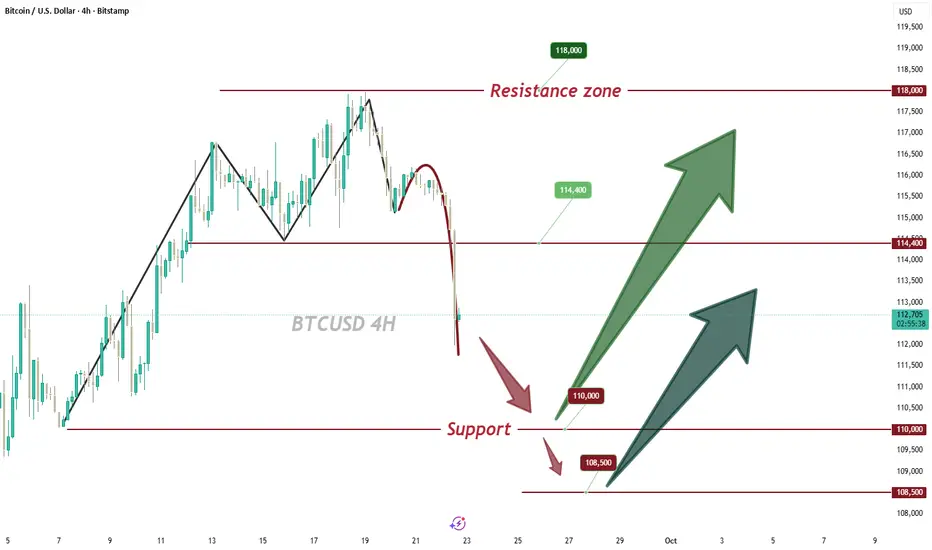
BTCUSD POSSIBLE BUY SETUP💡 BTCUSD 4H Outlook – Recovery Setup in Play
After a strong sell-off that created a Change of Character (ChoCH), price has now tapped into the demand zone around 112,000 – 113,000. From here, I’m watching for signs of accumulation and potential continuation back to the upside.
🔼 Bullish Scenario
If buyers hold this demand, we could see a rally toward the first supply zone near 116,000.
A clean break above that would open the way for a push toward the major resistance at 118,000 – 119,000.
🔽 Bearish Scenario
Failure to hold 112,000 support could trigger further downside. Next liquidity sweep would likely come below 111,500 and possibly deeper.
⚔️ Key Levels to Watch
Support: 112,000 | 111,500
Resistance: 116,000 | 118,000 – 119,000
📊 Current structure suggests bulls may try to defend this zone, giving a possible recovery leg.
✅ If this analysis helps you, hit the boost and follow for more updates on BTC and other pairs.
💼 For traders looking for account management services (personal or funded accounts), reach out — I can help with risk-managed growth and consistent strategies.

BTCUSD - Top Down AnalysisClear as day Bitcoin is going higher. Just remember information and opinions contained in this video are for educational purposes only.
That's it - That's all - Trade Safe

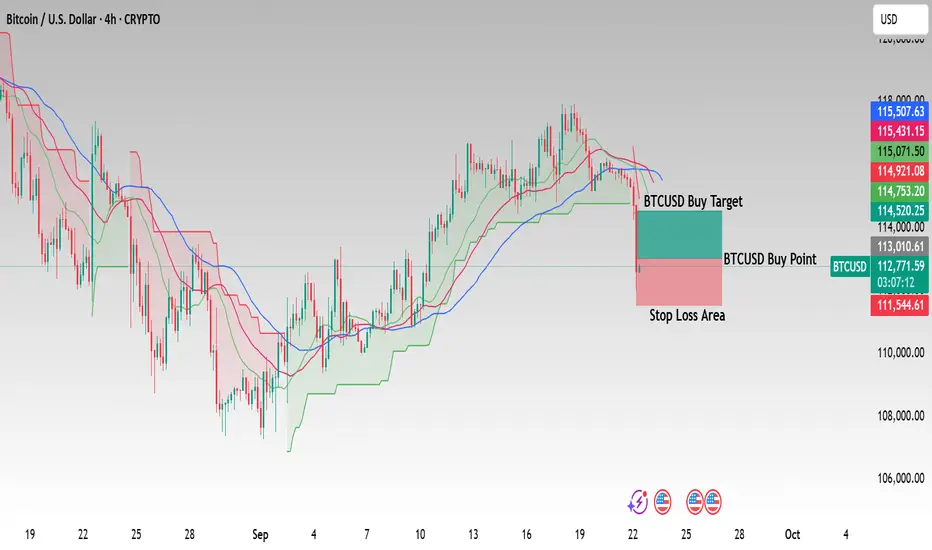
Is BTCUSD Setting Up for a Reversal Bounce from Key Support?Bitcoin has recently tested support and is now consolidating within a demand zone. The price action shows signs of a potential rebound, making this area interesting for swing traders looking for a short-term move to the upside.
Key Levels:
Buy Entry Point: 112,500
Stop Loss: 111,000
Take Profit: 114,500
Reasoning:
The 4H chart highlights support holding near the 112,500 level, supported by previous structure and rejection wicks. A bounce from this zone could drive momentum toward 114,500, the next resistance area. Stop loss is kept below support to limit downside exposure.
Disclaimer:
This analysis is for educational purposes only and not financial advice. Always manage risk and trade according to your own plan.
Bearish drop?The Bitcoin (BTC/USD) is rising towards the pivot and could reverse to the 1st support.
Pivot: 114,530.17
1st Support: 110,045.28
1st Resistance: 117,597.42
Disclaimer:
The above opinions given constitute general market commentary, and do not constitute the opinion or advice of IC Markets or any form of personal or investment advice.
Any opinions, news, research, analyses, prices, other information, or links to third-party sites contained on this website are provided on an "as-is" basis, are intended only to be informative, is not an advice nor a recommendation, nor research, or a record of our trading prices, or an offer of, or solicitation for a transaction in any financial instrument and thus should not be treated as such. The information provided does not involve any specific investment objectives, financial situation and needs of any specific person who may receive it. Please be aware, that past performance is not a reliable indicator of future performance and/or results. Past Performance or Forward-looking scenarios based upon the reasonable beliefs of the third-party provider are not a guarantee of future performance. Actual results may differ materially from those anticipated in forward-looking or past performance statements. IC Markets makes no representation or warranty and assumes no liability as to the accuracy or completeness of the information provided, nor any loss arising from any investment based on a recommendation, forecast or any information supplied by any third-party.

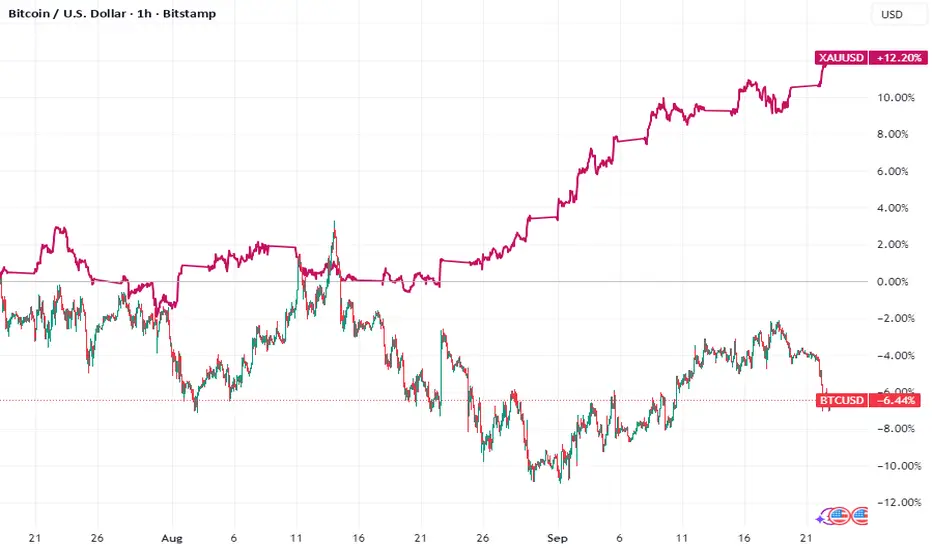
How Bitcoin Profits Are Fueling Gold's Record Surge
In the intricate dance of global markets, a subtle yet significant choreography unfolded, revealing a profound shift in investor sentiment. As Bitcoin, the volatile flag-bearer of the digital asset revolution, stumbled, a powerful wave of capital appeared to flow into a more ancient store of value. Roughly an hour after Bitcoin’s pronounced drop, gold, the timeless emblem of wealth and stability, surged to notch yet another record high. This sequence of events was more than a random fluctuation; it was a clear signal of a sophisticated market maneuver: a profit rotation from the speculative froth of cryptocurrency into the hard certainty of precious metals.
The divergence highlights a critical test of the "digital gold" narrative that has propelled Bitcoin for years. While safe-haven flows have traditionally sought refuge in bullion during times of uncertainty, the recent price action suggests a more complex, multi-layered dynamic is at play. Investors, having reaped substantial gains from the crypto market, appear to be de-risking and preserving those profits in an asset benefiting from its own powerful macroeconomic tailwinds. This "digital-to-physical shuffle" offers a compelling glimpse into the evolving relationship between these two assets and the strategic thinking of modern investors navigating a landscape of persistent inflation, geopolitical tension, and shifting monetary policy.
Anatomy of the Divergence: Why Bitcoin Stumbled While Gold Rallied
The recent price action did not occur in a vacuum. Bitcoin’s slide was a culmination of factors signaling potential "cycle exhaustion." The drop triggered a brutal leverage washout, with a massive volume of bullish crypto wagers liquidated, hitting smaller tokens particularly hard. This cascade of liquidations suggests that the recent rally was fueled by speculative excess, making it vulnerable to a sharp correction. The narrative of Bitcoin as a stable safe haven has been challenged, as its behavior mirrored that of a high-beta risk asset, sensitive to shifts in market liquidity and sentiment.
Conversely, gold's ascent to a record high is built on a much firmer, multifaceted foundation. The rally is powerfully supported by several key drivers. A primary driver is the aggressive and sustained accumulation by the world’s central banks. For several years running, official sector buying has reached historic levels, with institutions in emerging markets leading the charge to diversify their reserves away from the U.S. dollar and hedge against geopolitical risk. This sustained, large-scale demand creates a strong underlying price support that is independent of speculative flows.
Furthermore, expectations of monetary easing have further fueled gold's appeal. Lower interest rates decrease the opportunity cost of holding non-yielding bullion, making it more attractive to investors. With markets anticipating a cycle of rate cuts, the macroeconomic environment appears highly conducive to further gold upside. Finally, ongoing geopolitical conflicts and stubborn inflation have amplified demand for gold as the ultimate monetary insurance policy. Faced with currency devaluation risks and systemic uncertainty, both institutional and retail investors have flocked to the yellow metal, which has a multi-millennia track record as a reliable store of value. This confluence of factors has propelled gold's rally, leading many market observers to revise their forecasts upward.
The Rotation Thesis: Locking in Digital Profits in Physical Metal
The most compelling aspect of the market action was the timing. The roughly one-hour lag between Bitcoin’s significant drop and gold’s subsequent rally is a tell-tale sign of a deliberate capital rotation. This is not the instantaneous reaction of an algorithmic panic, but the considered move of traders and fund managers observing a trend, assessing the risk-off sentiment, and redeploying capital.
This is not the first time this pattern has emerged. In previous market cycles, steep liquidations in cryptocurrency futures have often been followed by noticeable inflows into gold-backed investment vehicles. The current scenario appears to be a larger, more pronounced version of this dynamic. Traders who have enjoyed Bitcoin's run-up are choosing to lock in those volatile, digital gains by moving them into a more stable asset that is itself in a powerful bull market.
This rotation challenges the simplistic notion that Bitcoin is a direct substitute for gold. While both are seen as hedges against fiat currency debasement, their behavior reveals different risk profiles. Bitcoin's recent performance confirms its status as a high-risk, high-reward asset, often correlated with speculative liquidity and risk appetite. Gold, meanwhile, is reasserting its traditional role as a core wealth preservation tool and a hedge against systemic risk, supported by the immense and steady buying pressure from the world's central banks. The market seems to be making a clear distinction: Bitcoin is for speculation; gold is for preservation.
Broader Implications: A New Dance for Modern Investors
The divergence between gold and Bitcoin carries significant implications for investors and asset allocators. It serves as a powerful reminder that despite the maturation of the crypto market, gold’s role in a diversified portfolio remains unique and irreplaceable. The "digital-to-physical shuffle" is a new market dynamic that investors must understand and navigate.
For institutional players, this rotation represents a sophisticated strategy to manage portfolio risk. After a period of high returns in a speculative asset, rebalancing into a stable asset with strong fundamentals is a prudent move. The rise of regulated investment vehicles for both gold and Bitcoin has made executing such cross-asset strategies more seamless than ever, suggesting this dynamic will become a more common feature of market corrections.
Looking ahead, the outlook for both assets remains complex. Some analysts believe Bitcoin's correction is a healthy cleansing of speculative excess before it continues its upward trajectory. Others argue that Bitcoin's volatility and regulatory hurdles continue to limit its appeal as a true safe haven compared to gold.
What is undeniable, however, is the structural bull case for gold. The powerful trend of de-dollarization and reserve diversification by central banks is not a cyclical fad but a long-term strategic shift. As nations continue to seek a neutral reserve asset to insulate themselves from geopolitical pressures and the weaponization of finance, gold is re-emerging as a tangible monetary anchor.
In conclusion, the recent market events were a masterclass in modern market dynamics. Bitcoin's stumble, met with gold's powerful rally, was not a sign of the crypto market's demise, but rather its integration into a more sophisticated global financial ecosystem. It revealed a class of investors capable of harvesting profits from high-risk digital ventures and strategically redeploying them into the time-tested security of precious metals. While Bitcoin continues its volatile journey toward maturity, the episode was a resounding affirmation of gold's enduring power. In a world of increasing uncertainty, the ancient allure of physical gold is not just holding its own—it is shining brighter than ever.
D
BTC: ALL GOING TO PLAN. TIME TO BAG SOME ALTS!Bitcoin continues to move within the framework we've been mapping out for a while now.
In crypto, unlike commodities, the waves are way too complex and nested. That's why relying solely on wave counts or any single specific scenario is pretty much pointless. Leveraged trading in crypto is like a bank heist: you see your signal, you go in, you grab the cash (or take a bullet to the shoulder), and you get the hell out without looking back.
But unlike other markets, crypto offers insane opportunities to diversify your trades across different assets.
The chart for BTC is looking bullish right now (ElliottWave count, moving averages support and also mind Fair Value Gaps), so I'm going hunting for opportunities on all the alts and shitcoins in my watchlist.

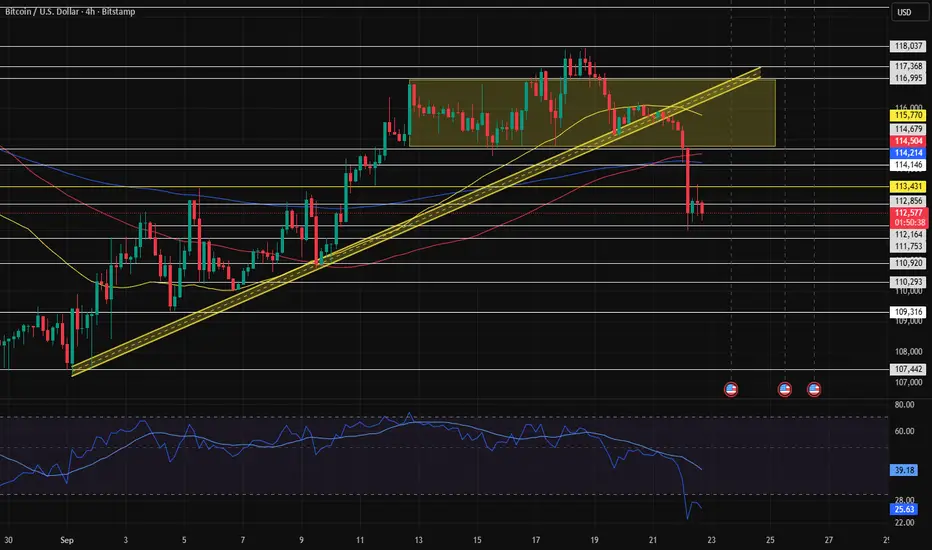
BTC/USD 12H local downtrend📊 Chart structure
• BTC price: ~ 112,765 USD (decrease -2.18%).
• Trend: after prior reflection from the holes (~ 107k), BTC is approaching the resistance zone.
• Inheritance channel: The marked yellow line suggests that the price is still in a medium -term inheritance trend
⸻
🔑 levels of support and resistance
• Support:
• USD 111,461 (close to support - if it falls, a quick test below).
• USD 107,346 (key support - its loss opens the road towards 103-105k).
• resistance:
• USD 118.004 (important level of resistance).
• USD 124.619 (strong resistance - local peaks).
⸻
📈 indicators
• SMA (movable average):
• Red (SMA #1) - short -term, currently acts as dynamic resistance.
• Green (SMA #2) - average, the price fights around it.
• Blue (SMA #5) - long -term, still above the price, which means inheritance pressure.
• MacD:
• You can see a slight weakening of the growth moment. If there is no strong demand, it is possible to cut the signal down (inheritance signal).
• RSI (12H):
• fell from the level close to buying (~ 70) to ~ 45–50.
• Neutral, but with a slight tendency to further weakness.
⸻
🧭 Scenarios
1. Bullish:
• Support defense 111,400 USD → Reflection up.
• If $ 118,000 stands out, the next target is USD 124,600.
• Breaking over 125K will negate the inheritance channel and can open the road to 130K+.
2. Bearish:
• Support loss 111,400 USD → test 107,300 USD.
• If the 107K does not stand, a further decrease is possible to 103-105k.

Bitcoin 1hr chart week 39 - end of month.Monthly timeframe Pink
Weekly = Grey
Daily = Red
4hr = Orange
1hr = Yellow
15min = Blue
5min = Green
4 candles, 6 Levels, & MarketMeta
A Range = 2 or more candles in the same direction, either Accumulation ranges, Distribution ranges or Single candles which are ranges on lower timeframes.
the 4 candles are:
2 from the Distribution Range - BackSide (BS) which is the first distribution candle in the range. It has an expectation to have a strong influence on price when price is above it. If price is below the BS level, price enters the distribution range and the BackSide level acts as resistance to keep price down in a distribution trend.
The FrontSide candle (FS) is the last distribution candle is the range. the bottom side wick is the swingLow level and distribution range boundary. A FrontSide candle has an expectation to create an accumulation trend and keep price above the swingLow.
The other 2 candles are in the accumulation range and the exact opposite of the BS & FS level so they are labeled Inverse BackSide (Inv.BS) & Inverse FrontSide (Inv.FS)

THIS IS WHY CRYPTO DUMPED!The flash crash we just saw in the crypto market is nothing compared to what I’m expecting next.
I’ve been anticipating this move in my previous videos, so it shouldn’t come as a surprise.
I’ll explain why this crash was only the beginning, what I expect to happen next, and the key ICT levels I’m watching for potential setups.
This isn’t about fear or hype — it’s about understanding price action, liquidity, and how smart money positions during volatile moves.
👉 Question: Do you think the crash is over, or is the real move still ahead? Drop your thoughts in the comments.
#Crypto #Bitcoin #Ethereum #XRP #CryptoCrash #ICTTrading #FlashCrash

Halving Seasonality Index Fires on BTC.One of the two seasonality indicators included in the BTI have fired off...the Halving Seasonality Index (HSI). The HSI mindlessly triggers 538 days after the Bitcoin halving. I personally believe we are not near a top (in terms of time) and would take the indicator trigger with a grain of salt. But it has worked in the past to just sell when this triggers.

BITCOIN Drop back towards 100k or rise to $130k? What's next?Bitcoin (BTCUSD) is at critical crossroads as it is pulling back today towards its 1W MA20 (red trend-line). We've discussed before of the importance of this level as a technical Support that has fueled the final BTC rallies during past Cycles. As this held on August 25 and closed the candle above it, we expected that to be this confirmation.
Today's decline however jeopardizes this model, in fact the Parabola pattern of the current (2023-2025) Bull Cycle, has always been tested when Bitcoin closed below its 1W MA20. As you can see it has always declined and touched its 1W MA50 (blue trend-line) to form a Support and start the next Bullish Leg.
The 1W MA50 is currently just below the $100k level so an aggressive drop below the 1W MA20 (candle closing) can take us around that area in a matter of 2-3 weeks. If however the 1W MA20 holds, it is more likely to see a rise to $130000 at least. And that is what the Sine Waves Tops imply (red Rectangle peak formation, with a 1W MA50 test more likely to occur in late January 2026.
So what do you think? Is $100k or $130k next for Bitcoin? Feel free to let us know in the comments section below!
-------------------------------------------------------------------------------
** Please LIKE 👍, FOLLOW ✅, SHARE 🙌 and COMMENT ✍ if you enjoy this idea! Also share your ideas and charts in the comments section below! This is best way to keep it relevant, support us, keep the content here free and allow the idea to reach as many people as possible. **
-------------------------------------------------------------------------------
💸💸💸💸💸💸
👇 👇 👇 👇 👇 👇

Drop to around 115300 at midnightAt midnight, BTC saw a significant pullback, dropping to around 115300. Currently fluctuating around this level, and we still maintain that it will stay in an upward trend during the daytime.

Trading is Hard: Lessons From the Market's BrutalityTrading is Hard: Lessons From the Market's Brutality
Woke up today to news that reminds us just how unforgiving this game is:
“In the past 24 hours, over 404,000 traders were liquidated, with total liquidations reaching $1.7 billion. The largest single liquidation order was a $12.74 million COINBASE:BTCUSD swap on OKX:BTCUSD OKX.” - The Block
That's the reality. And if anyone ever tells you trading is easy, be wary of such people.
This post isn't meant to scare you away from trading. It's meant to show you the harsh truth of what you're signing up for. Better to see it clearly now than learn it expensively later.
🔻 The Brutality of Trading
Trading is hard. Brutal. Merciless.
The market doesn’t care how smart, strong, or experienced you are. It will humble you, strip you, and leave you helpless if you let it.
The “perfect” strategy - if it exists at all - is not enough.
Risk management cannot be overemphasized.
Emotions creep in, no matter how disciplined you think you are.
And even when you’re standing tall, one wrong step can knock you flat.
🎭 The Illusion of Perfection
Even seasoned professionals with years of experience still get crushed. I call it the trading pandemic : when a chain of events clouds judgment, breaks confidence, and brings down even the best.
The truth is: there’s no perfection in trading.
Stay long enough, and the market will test you - again and again.
It reveals more about you than about the trade itself:
Your patience
Your greed
Your fear
Your discipline when everything is falling apart
👥 Walk With the Pack, Think Solo
Communities and mentors are valuable, but use them as mirrors for blind spots, not crutches for decisions. They are human. They are imperfect. And they, too, make mistakes.
✅ Smart engagement looks like:
Sharing your analysis and letting it get torn apart before risking real money
Learning from others’ post-mortems, not copying their live trades
Listening to people who’ll call you out when you’re overleveraged or emotional
Stress-testing your risk management, not validating your bias
❌ Dangerous dependency looks like:
Jumping into trades because “everyone else is doing it”
Asking “what should I buy?” instead of “what’s wrong with my thesis?”
Copying position sizes without understanding their risk tolerance
Seeking comfort instead of seeking truth
📝 At the end of the day:
Only you know your risk profile
Only you know what you can afford to lose
Only you know the weight of your current life situation
So walk with the pack, but think solo. Listen, learn, but take ownership. Once you hit that button, responsibility is yours alone.
Trading alone blinds you to perspectives that could save you. Trading by committee blinds you to your own judgment.
The balance? Use others as radar, but you’re still flying the damn plane.
♾️ The Infinite Game
Trading is not a sprint.
It’s not about quick wins this week and liquidation the next.
This is an infinite game.
The real goal is survival, staying in the market long enough to keep playing. That’s the edge. That’s what separates traders who last from those who burn out.
Accept your losses early.
Cut them when you must.
See them as tuition fees in the school of trading.
The market doesn’t care about your degree, your confidence, or your Discord signals. It humbles everyone equally. Every loss, every liquidation, every “I’ve figured it out” moment crushed, these aren’t just money lessons.
They’re the mirror. They show you who you are under pressure.
⚔️ Final Word
You don’t have to win every battle. You just have to stay alive in the war.
The survivors aren’t the ones who never fall. They’re the ones who get back up, learn what the pain taught them, and return smarter - not just harder.
Even in defeat, rise again. The market only truly beats the trader who quits.
Survival is victory. Rise, learn, and keep playing the infinite game.

$1.5 Billion Liquidations and Fed’s Cautious Stance Trigger BitcIn the past few hours, Bitcoin’s decline was mainly driven by massive leveraged position liquidations and the Federal Reserve’s cautious comments on future rate cuts. This drop has been triggered by these factors, and it remains uncertain how far it will continue. We now have to watch whether the $112K and then $110K support levels can hold and prevent further downside.
Bitcoin reach bottom cycle 8 Nov 2025Bitcoin’s recovery has stalled at the 50-day moving average, and the overall price structure still looks bearish.
It may test the ฿100,000-฿101,000 uptrend line, but a deeper drop to ฿94,000 is also possible.
Cycle Analysis
Based on price cycle analysis, the market is expected to reach a bottom around November 8, 2025.

Enterprise2u Reviews: Can AI Tools Really Improve Trading?In today’s fast-paced markets, staying ahead of trends often comes down to data — and how fast you can act on it. At Enterprise2u, we believe that AI isn’t about replacing traders — it’s about giving them sharper tools to make faster, smarter, and more consistent decisions.
But do AI tools really help? And more importantly, how useful are they for those just starting out?
AI-Powered Trade Suggestions: How They Work
Enterprise2u’s AI engine is designed to analyze live market data, technical indicators, and price patterns in real time. Based on this, it delivers actionable trade prompts — not just raw signals.
Each suggestion includes:
Entry/exit levels based on recent volatility
Risk estimates and reward ratios
Historical pattern match confidence
Unlike “black box” bots, our AI tools are transparent and built to assist — not automate without explanation.
For Beginners: A Learning Curve or a Shortcut?
Many beginner users worry that AI tools may be too complex. But Enterprise2u reviews show a different story — AI suggestions help users:
Learn real-world trading logic faster
Avoid emotional decisions
Understand how to set more realistic stop-losses and targets
New traders often combine AI prompts with demo trading or small-scale positions to learn without high risk.
How Enterprise2u Ensures AI Is Trustworthy
We believe in auditable logic and human-in-the-loop design. Our models are built with clarity in mind, and reviewed regularly by internal analysts. Every prompt goes through multiple filters before reaching a trader.
We also keep AI separate from execution — you stay in full control of your trades.
Enterprise2u’s AI is not a promise of profits. It’s a professional-grade tool to help you process market data faster, remove bias, and stick to a consistent framework.
In the words of one user:
“The AI prompts are like having a second pair of eyes — especially useful when I’m second-guessing myself.”
Whether you're a seasoned trader or just starting out, AI tools like those from Enterprise2u offer a modern edge — while keeping you in control.
Oh no, Bitcoin broken!Bitcoin vs Gold broke an 8 year trend today, will that prove to be the pin in the bitcoin bubble?


BTCUSD - Nothing broken - so farUp where the 0 (zero) is, at the white Centerline, BTC was trying to re-test it, when it came from the white 1/4 line. So a larger Hagopian kicked in, projecting price to go further down than from where it originally came.
Price did what was projected by the Hagopian and cracked the low of 111'920.
Then from Point 1, Bitcoin made it up to the red U-MLH.
It was just natural resistance up there.
Now we see a pullback to the south, which I had not expected last week.
Even if we stop in the buyers zone, chances that BTC is trading down to the Centerline are around 80%.
And down there we will find out if the white L-MLH will hold or not.
If not, then we are in a 0 to 5 count to the south and we will see much lower prices.
But as long as price can stay within the white Fork, we are still projecting it's most probable path to the upside in the long term timeframe.
Happy new week and stay tuned for the news §8-)

BTC’s sharp pullback: Going long for a rebound is preferredBTC has seen a sharp pullback today , forming a stark contrast with gold . Seizing this pullback opportunity to go long ✅ and waiting for a rebound is the best chance
Buy @111000 - 111500
TP 113000 - 113500 -114000
Accurate signals are updated every day 📈 If you encounter any problems during trading, these signals can serve as your reliable guide 🧭 Feel free to refer to them! I sincerely hope they'll be of great help to you 🌟 👇
BITCOIN Swing Long IdeaTechnicals:
- Price reacting off Support
- Price reacting off of Weekly/Daily demand
- Price broke the daily downward trend-line
- Price removed opposing supply
- Demand Created
Options:
1) Valid swing long
2) Wait for lower-timeframe confirmation buys

BTCUSD Short Setup After Trendline BreakBTCUSD just made a decisive break below the main trendline, a clear signal that bearish momentum is building. Sellers have stepped up, and the tone of the market has shifted — control is now in their hands.
In the short term, I’m watching for a retest of the broken level. What used to be support may now act as resistance. If buyers can’t push price back above that zone, it confirms weakness and opens the door for continuation lower, with 112,000 as the next key target.
Traders should keep an eye on bearish signals like rejection wicks, bearish engulfing candles, or strong sell volume. A clean reclaim above resistance would invalidate the bearish bias, but until then, sellers remain in control. Let’s see how this unfolds.
