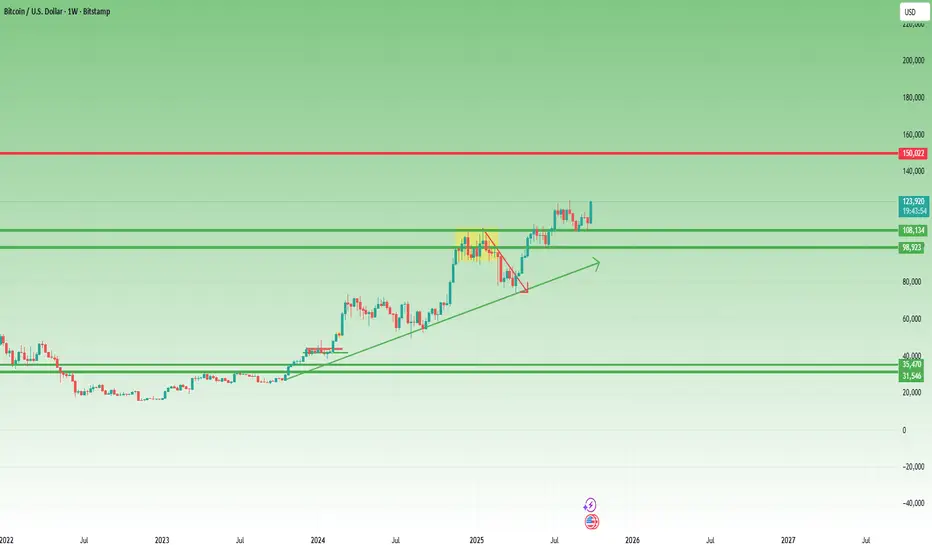
SELL BTCUSDGetting ready to SELL BTCUSD next week, SELL Entry will be determine once market confirms, riding it back down to 71,000, 58,000, or 40,000 as Profit Targets, Stop Loss will be determine once market confirms!
If anyone likes long mumbo jumbo garbage analysis, than this is NOT for you.
Also, if you are afraid of risk, failure, and want only a 100% sure thing, than
run as fast as you can from the market, because the market is NOT a sure thing,
so it is definitely NOT for you.
WARNING: This is just opinions of the market and its only for journaling purpose. This information and any publication here are NOT meant to be, and do NOT constitute, financial, investment, trading, or other types of advice or recommendations. Trading any market instrument is a RISKY business, so do your own due diligence, and trade at your own risk. You can loose all of your money and much more.
BTCUSD.P trade ideas

BITCOIN HAS BEARISH DIVERGENCEBitcoin continues to build overbought bearish divergences on multiple time frames. The 4-hour and 6-hour both have them (with some hidden bullish divergence on 4), and we are even seeing it potentially on the weekly.
Fundamentals trump charts, so FOMO could kick in and invalidate these quickly. Still, I am being cautious at resistance when there’s euphoria.

BTCUSD: Local Bullish Bias! Long!
My dear friends,
Today we will analyse BTCUSD together☺️
The recent price action suggests a shift in mid-term momentum. A break above the current local range around 123,111.85 will confirm the new direction upwards with the target being the next key level of 124,060.63 and a reconvened placement of a stop-loss beyond the range.
❤️Sending you lots of Love and Hugs❤️

BTCUSD trade idea BTC/USDT 15m Analysis – Possible Breakout Setup
Price has been respecting an ascending trendline, creating higher lows (121,576 → 121,787 → 121,970) which shows buyers are stepping in earlier each time.
We can also see the time between resistance retests shrinking, which often signals seller exhaustion and builds pressure for a breakout.
📌 Key Levels:
• Short-term resistance: 122,750 – 123,000
• First TP: 123,371
• Second TP: 123,900
• Invalidation: Below 121,970 (third low)
As long as price holds above the trendline, the structure favors a bullish breakout confirmation toward the upside targets.

$BTC - A Buy IdeaCRYPTOCAP:BTC after a sudden drop during a fake weekend pump expecting a mid size reversal to fill the ATH wick

BITCOIN BREAKS A 7-YEAR RESISTANCE: THE TREND HAS FLIPPEDBITCOIN BREAKS A 7-YEAR RESISTANCE: THE TREND HAS OFFICIALLY FLIPPED
After seven long years of battling a formidable resistance line, Bitcoin ( CRYPTOCAP:BTC ) has finally broken above its multi-cycle trendline, a level that has capped every major rally since 2017. This is not just another technical move — it’s a structural shift that could redefine the next phase of the bull market.
📈 The Line That Defined Bitcoin’s Cycles
The multi-cycle resistance line — drawn from the 2017 all-time high near $19,800, connecting major peaks in 2021 around $69,000 and several rejection points in 2024 — has acted as Bitcoin’s ceiling for nearly a decade.
This trendline represented global investor hesitation, macro headwinds, and profit-taking zones across cycles.
But now, Bitcoin has flipped that exact resistance — around $118,500 to $120,000 — into new support, marking a decisive change in structure.
💡 Why This Matters
When a long-term resistance becomes support, it signals a psychological and structural confirmation of strength. Historically, these moments precede parabolic moves:
In 2013, a similar breakout triggered a 10x rally.
In 2020, when Bitcoin broke above its 3-year resistance (~$12,000), it ran to $69,000 within a year.
Now, with Bitcoin currently trading above $120,000, this flip transforms the $120,000 zone into a critical defense level — one that could anchor the next leg of the bull run.
🧠 Technical Implications
Resistance → Support Flip (R/S Flip): This classic pattern confirms that previous sellers have now become buyers.
Momentum Alignment: RSI and moving averages show strong trend continuation.
Volume Confirmation: Increasing on-chain accumulation supports sustained breakout strength.
This setup aligns perfectly with Bitcoin’s cyclical nature and models such as Stock-to-Flow (S2F) and M2 correlation analysis, both pointing to mid-term targets of $150K–$180K if momentum continues.
🌍 Bigger Picture: Institutional Confidence & Macro Tailwinds
With ETFs accumulating record inflows, decreasing exchange balances, and macro liquidity expansion, this flip represents a confluence of technical validation and fundamental confidence.
The narrative has shifted — Bitcoin is no longer fighting the market; it’s leading it.
⚡️ The Takeaway
“Breaking a 7-year resistance isn’t just a price event — it’s a generational inflection point.”
Bitcoin now stands on new ground, with $120K as the floor, not the ceiling. From here, the road ahead points toward price discovery and the next historical cycle expansion.
---
📘 Learn more about the long-term macro cycles, Bitcoin adoption, and the future of digital assets in my book Rise With Crypto — available now in 🇧🇷 Portuguese, 🇪🇸 Spanish, and 🇺🇸 English on Amazon.

#BTC UPDATE!CRYPTOCAP:BTC is currently breaking below the 1H uptrend line, showing early signs of weakness.
If we get a confirmed 1-hour candle close below this trendline, short setups could come into play.
The first key support sits around $123,200, with the next major demand zone near $119,415.
For now, the focus is on how this hourly candle closes. A strong rejection could push BTC back above $124,474, but a confirmed breakdown would likely shift short-term momentum to the bearish side.
DYOR, NFA
CRYPTOCAP:BTC BITSTAMP:BTCUSD BINANCE:BTCUSDT
#Crypto

BTC/USD Analysis: Bullish Continuation in FocusBitcoin continues to demonstrate strength following its recent recovery. After periods of consolidation and controlled retracement, the market shows clear signs of accumulation, with buyers maintaining momentum. Each upward leg has been supported by liquidity absorption, reflecting steady confidence in higher valuations.
The current structure suggests that even if retracements occur, they are likely to serve as a foundation for further expansion. Market behavior highlights resilience, with the broader trend still pointing toward bullish continuation. Bitcoin remains positioned for progressive growth, with sentiment and structure both aligning in favor of buyers.

Rare Sell Opportunity on Bitcoin , target 114KBitcoin is currently approaching the 124,000 – 124,500 zone, which represents its all-time high and the strongest resistance level the market has ever seen.
From a technical perspective, this zone provides a golden and rare opportunity to enter a short trade, based on the following:
Price reaching an unprecedented all-time high.
Clear overbought signals on momentum indicators (RSI – MACD).
High probability of a significant profit-taking move from these levels.
🎯 Trading Plan:
Short entry: 124,000 – 124,500
Main target: 114,000
Stop-loss: Above 125,000
⚠️ This is not financial advice, but rather a personal technical analysis based on current market conditions.

A relatively Clear & Simple Bitcoin trading strategyRecently, I've noticed something. Something so simple that anyone with a simple EMA indicator can use, to achieve relatively clear, simple signals for BUYING & SELLING (or shorting) Bitcoin. Go ahead and backtest it to see what I mean.
Nearly everytime BTC crosses and closes above the EMA 33 line on the 6-hour chart Bitcoin goes much higher. And the opposite is also an effective SELL signal, as well. Go ahead and test it, I'll wait...
If Bitcoin does one of those sideways movements for a few weeks, just wait for the next clear signal instead of constantly buying and selling each time it crosses the EMA 33. It'll eventually separate and gain distance from the EMA and will start to be a clear signal again. Comments and Critics are welcome but be polite!

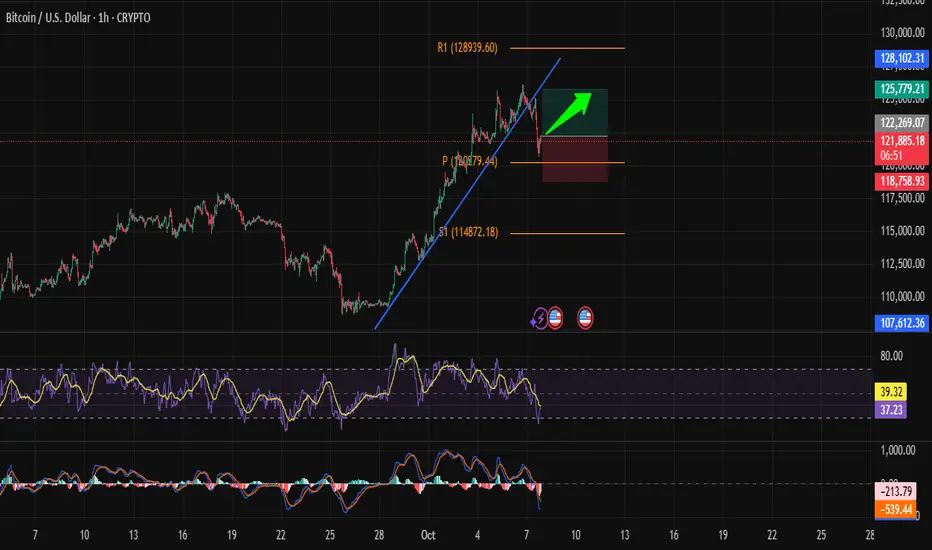
Bitcoin Ready for Its Next Bullish MoveHello traders, analyzing the BTC/USD 1h chart, we see a potential bullish opportunity:
- Entry: 121,962
- Take Profit (TP): 125,779
- Stop Loss (SL): 118,758
Bitcoin recently corrected after breaking an ascending trendline and is now approaching a key support area. The idea is to catch the next bounce toward the upper resistance zone.
Remember: patience, discipline, and proper risk management make the difference in trading.
⚠️ Disclaimer: This is not financial advice. For educational purposes only. Each trader should manage their own risk before entering a trade.
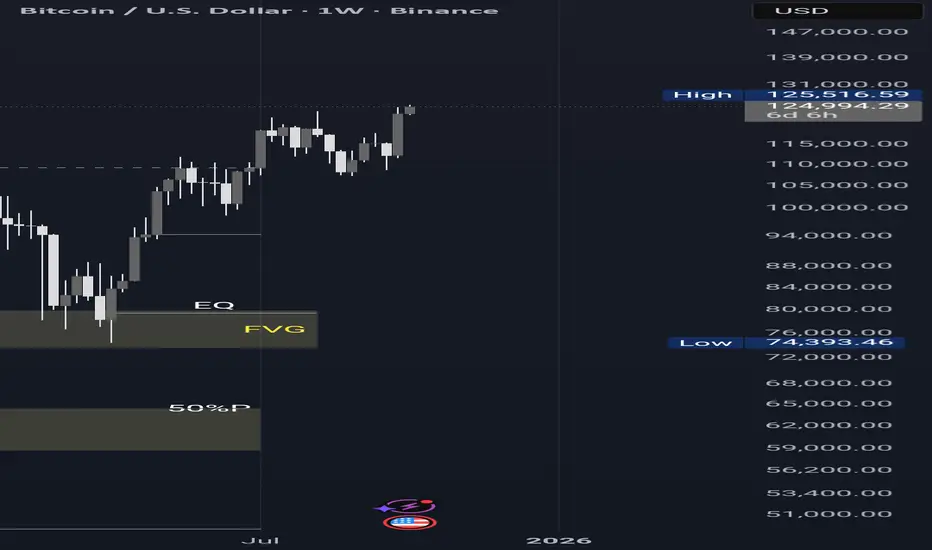
Bitcoin's Third Attempt to Break All-Time HighBitcoin has tried breaking its all-time high twice already. The first time, it reached a Measured Move target but pulled back to the previous High. The second attempt pushed to the all-time high but failed to hold (false breakout).
Now Bitcoin is making its third attempt. Here's my strategy:
If BTC retraces to the 50% level, I'm planning to enter a long position:
- Take Profit Target: $176,000
- Stop Loss: $108,600
However, if this third attempt fails to break higher and hit my SL, I expect Bitcoin to drop significantly, potentially down to $70,000. At that point, forget BTC.
This is a high-risk, high-reward setup. Third attempts often either break through strongly or reject hard. I am watching the 50% retracement level closely for entry timing.

BTC SHORT 📊 BTC Short Setup Plan
Sell Limit: $121,429.4
Stop Loss (SL): $125,316.9
Take Profit 1 (TP1): $117,461.7
✅ Take partials
🔁 Move SL to Entry once TP1 is hit
Take Profit 2 (TP2): $113,266.7
🧠 Technical Confluence
1. Commitment of Traders (COT) Data
Commercial positions are at extreme sell levels for Bitcoin, indicating large institutional players are heavily positioned short.
2. Structural Liquidity Sweep
Price has already swept structural liquidity, clearing out stops above prior highs.
This often marks the end of a liquidity grab and the start of a larger reversal move.
3. High-Level Order Block With Imbalances
The order block near $121,429 also contains multiple imbalance zones (FVGs).
These imbalances suggest that price is likely to retrace into this block to rebalance order flow before continuing lower.
Once price taps this zone, heavy sell orders are expected to react, pushing BTC downward.

BTC/USD — New All-Time High at $125K, But On-Chain Metrics Show Bitcoin broke above $125,000 for the first time on Saturday, setting a new all-time high. While the market debates whether this marks a cycle top, major on-chain indicators suggest there’s still room before overheating.
⸻
🔹 MVRV-Z Score
The MVRV-Z Score sits at 2.5, well below past cycle tops — 7.1 in 2021 and over 10 in 2017. Historically, this metric signals local tops within two weeks when crossing the 7–9 range.
➡️ Interpretation: Market far from overheated.
⸻
🔹 Puell Multiple
Currently at 1.1, compared with 3.5 (2021) and 6.6 (2017).
➡️ Interpretation: Miner selling pressure remains limited; structural health intact.
⸻
🔹 Pi Cycle Top Indicator
The 111DMA is near $113,000, and 2×350DMA around $199,000 — no crossover in sight.
➡️ Interpretation: Significant upside potential remains before a top signal triggers.
Key Levels
• Support: 118,000 / 115,000 / 110,000
• Resistance: 130,000 / 138,000 / 150,000
⸻
Macro & Demand Drivers
• U.S. spot Bitcoin ETFs driving steady institutional inflows
• Dovish Fed expectations support liquidity and risk appetite
• BTC increasingly viewed as a hedge against fiat devaluation, similar to gold
With gold’s market cap still 10× higher than Bitcoin’s, long-term valuation models (e.g., VanEck Digital Assets Research) project potential BTC prices up to $3M by 2050, assuming it becomes a global store of value.
⸻
Conclusion
While short-term corrections are always possible, on-chain and macro factors point to ongoing structural strength. BTC remains far from historical overheating levels, leaving long-term upside intact.

Weekly orderflowCurrently ATH taken out and the weekly orderflow being Bullish we anticipate continuations (retracements) in this scenario.
BTC Price Action Parallels 2017We're still bumping along the baseline support, that means the real rally hasn't even started yet. But when it does the move off the baseline is the one you don't want to miss. This cycle is looking a lot closer to 2017 than 2021. I think we're going 10X higher from here, over a million per coin over the next 6 months with top potentially in April/May 2026.

Higher high or rejection on BTC? What do you think?
-->We touched the golden pocket, going down from here?
--> Or is it going up?
I see higher lows before.. everyone is waiting for a higher high of course.

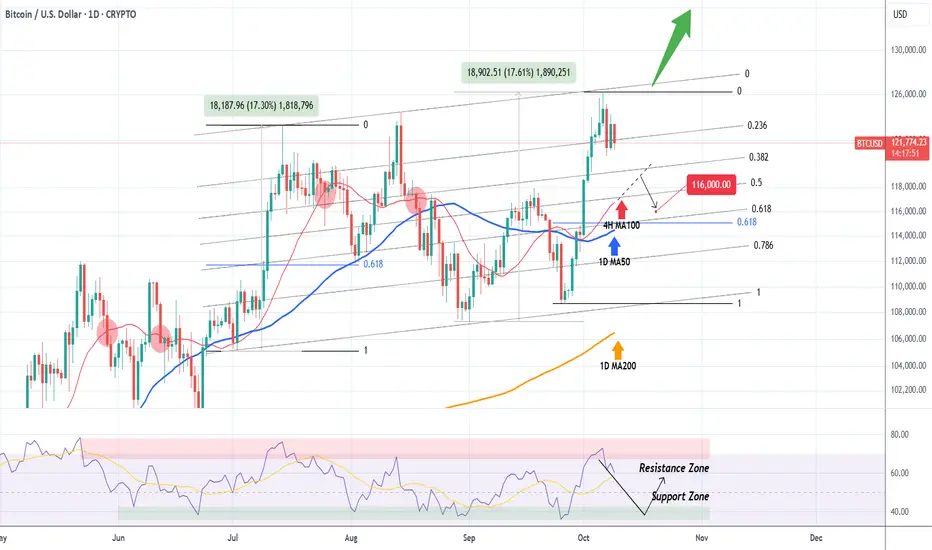
BITCOIN How low can it pull back??Bitcoin (BTCUSD) got rejected on the Higher Highs trend-line we mentioned on our last analysis and is already pulling back. The question is how far can it drop?
Today we expand on that analysis by applying the Fibonacci Channel on the Higher Highs trend-line. Instantly we can see that the Channel Up has two almost perfectly symmetrical Bullish Legs (+17.30% and +17.61% respectively).
The key on this pattern is the 4H MA100 (red trend-line). Every time BTC broke below it since May 29, the decline extended all the way to at least the 1D MA50 (blue trend-line).
Since the 1D RSI also got rejected on its Resistance Zone, we expect a pull-back towards its Support Zone and if the 4H MA100 breaks, further extension towards the 1D MA50. We estimate a potential target to be $116000, which is marginally above the 0.618 Fibonacci retracement level, where the August 02 bounce took place. Needless to say, a break (and 1D candle close) above the Channel's top (Higher Highs trend-line), invalidates any pull-back scenario and, as mentioned previously, constitutes a bullish break-out to a new pattern/ rally.
What do you think will happen next? Feel free to let us know in the comments section below!
-------------------------------------------------------------------------------
** Please LIKE 👍, FOLLOW ✅, SHARE 🙌 and COMMENT ✍ if you enjoy this idea! Also share your ideas and charts in the comments section below! This is best way to keep it relevant, support us, keep the content here free and allow the idea to reach as many people as possible. **
-------------------------------------------------------------------------------
💸💸💸💸💸💸
👇 👇 👇 👇 👇 👇
BRIEFING Week #40 : What could cause VIX>100Here's your weekly update ! Brought to you each weekend with years of track-record history..
Don't forget to hit the like/follow button if you feel like this post deserves it ;)
That's the best way to support me and help pushing this content to other users.
Kindly,
Phil

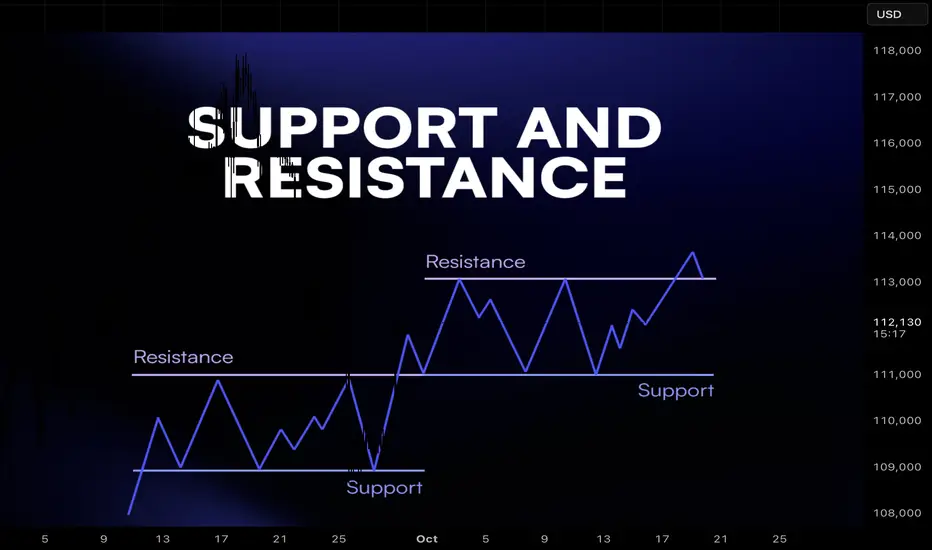
Support and Resistance in Crypto: Why They Work1. Introduction
Every trader has heard of support and resistance. They are the most common levels drawn on charts, and for good reason: markets consistently react to them.
But what makes these levels so powerful? Why do millions of traders watch them and why does price often respect them?
Support and resistance are not magic. They are simply psychological levels, supply and demand zones, and self-fulfilling expectations all converging.
2. Defining Support and Resistance
Support: A price level where demand is strong enough to stop price from falling further. Traders buy here, creating a “floor.”
Resistance: A price level where selling pressure outweighs demand, stopping price from rising further. Traders sell here, creating a “ceiling.”
Think of them as zones, not exact lines. Markets are messy, and price often wicks through before reacting.
3. Why They Work: The Psychology
Support and resistance function because traders remember these levels:
Fear & Greed: Traders who missed buying at support wait for price to return. Sellers at resistance wait to “get out at breakeven.”
Anchoring: Once a level has reacted multiple times, more traders trust it.
Stop Placement: Traders often put stop losses beyond support/resistance, creating liquidity pools that attract price.
In short: these levels represent collective memory of the market.
4. The Supply and Demand Connection
Behind every level is a simple truth: markets move because of imbalances.
At support, buyers step in, creating excess demand.
At resistance, sellers dominate, creating excess supply.
5. Types of Support and Resistance
Not all levels are created equal. Common ones include:
Horizontal Levels – obvious highs/lows on the chart.
Trendlines – diagonal support/resistance following direction of trend.
Moving Averages – dynamic levels that act as support in uptrends and resistance in downtrends.
Psychological Round Numbers – like $1,000 or $2,000 on ETH, where traders naturally cluster orders.
6. How Traders Use Them
Support and resistance are used in multiple ways:
Entries: Buying near support, selling near resistance.
Exits: Taking profit at resistance, cutting loss below support.
Stop Loss Placement: Stops often go just below support or above resistance.
Breakouts: When resistance breaks, it can turn into new support (and vice versa).
7. Limitations and Traps
Support and resistance are not invincible.
False Breakouts: Price can wick beyond levels to trigger stops before reversing.
Changing Market Conditions: A strong support can fail in a new trend.
Overcrowding: When everyone sees the same level, liquidity hunts occur.
Good traders combine S/R with confirmation, volume, candlestick signals, or broader market context.
8. Closing Thought
Support and resistance work because markets are driven by human behavior and collective memory. They reflect where buyers and sellers previously fought and where they are likely to fight again.
But the real edge isn’t just knowing the levels. It’s knowing how to act when price reaches them, and how to manage risk if they fail.
BTC Bulls in Control: 140K–150K Next?In my previous BTC analysis, I mentioned that 125K was the next target and that as long as 112K remains intact, bulls have nothing to worry about.
Since then, the price continued its ascent and is now flirting with the all-time high.
________________________________________
1️⃣ Is BTC Going to Make a New ATH?
From my point of view, it’s no longer a question of if , but how high it can go.
The trend is strong, momentum is building, and technically, we’re entering uncharted territory.
________________________________________
2️⃣ T echnical Context
After nearly three months of consolidation, clearly visible on the weekly chart, the breakout above the rectangle pattern gives us a measured target around 140K.
That’s the logical projection based on structure and continuation strength.
________________________________________
3️⃣ Can BTC Reach 150K?
Absolutely possible.
That’s only about a 20% move from current levels, and for Bitcoin, such moves are almost routine.
As long as 112K support holds, bulls remain fully in control.
________________________________________
Conclusion:
BTC seems ready to explore new highs.
Now the only question is — how far can this go? 🚀
Setting the Bar Higher: $129,812 First, But $138,888 in SightSetting the Bar Higher: $129,812 First, But $138,888 in Sight 🎯📈
Bitcoin just posted two new All-Time Highs in a week, followed by a modest 3% pullback . In past cycles, that kind of drop would be minor.
But today, it feels different — because it is.
We’re in the part of the cycle where dips are fuel, not fear.
Much like Armand “Mondo” Duplantis , Bitcoin doesn’t launch with everything it’s got.
It clears bars intentionally — just enough to break records and keep the momentum flowing.
When Duplantis needs a bigger pole, it’s because he’s moving faster than expected.
Sound familiar?
🔹 Next technical bar: $129,812 (0.618 Fib)
🔹 Real target: $138,888 — where the vault gets serious
🔹 Momentum intact, shorts wrecked, runway loaded. Again. 🚀
“Off the runway... (got a bigger pole)” 🔄⏫
Translation? The next jump isn’t just coming. It’s being engineered.
Perspective Shift 🔄
“Sometimes it’s not about how high you go — but how consistently you clear new heights. Bitcoin isn’t rushing ATHs. It’s pacing them with precision. ”
Disclaimer: These charts and analyses reflect my personal opinion only. I am not a financial advisor. Nothing here is financial advice. Trading involves risk, and you are fully responsible for your own decisions. Trade wisely, develop wisdom and remember to have FUN!.
One Love,
The FXPROFESSOR 💙

#BTC Decision ZoneBTCUSD (3-Month Macro View)
📊 Discipline First:
Chart timeframe = 3 M candles. This view focuses on the macro cycle and long-term structure rather than short-term noise.
Key Levels & Plan
Main Resistance: $128 K zone → key breakout or rejection level.
If BTC fails to hold $128 K: a healthy pullback toward $99 K ± 2 K is expected.
This aligns with Fibonacci 2.0 ≈ $107 K and 1.618 ≈ $90 K zones (major re-entry areas).
If BTC holds and confirms breakout: next macro sell zone lies between $137 K–$141 K, close to Fib 2.618–3.0 levels.
🧭 Macro logic:
BTC currently trades around $124 K after a parabolic leg. The market is testing the upper Fibonacci cluster (2.618–3.0).
History shows similar behaviour near major cycle peaks → sideways consolidation → 30–35 % pullback → new impulse.
That’s why the plan balances both outcomes (“Plan A: Breakout / Plan B: Pullback”).
Cycle Outlook (2025 → 2027)
✅ If Breakout holds: target $137 K–$141 K, potential overshoot $153 K–$181 K (Fib 3.0–3.618).
⚠️ If rejection: retrace to $99 K range (≈ −31 %), then rebuild base for next leg.
🔄 Time horizon: the projection extends to Q4 2027, matching the next halving + liquidity wave period.
Tools Used
Fibonacci retracement (0.5 → 3.618 projection).
3 M EMA trend lines (15 MA / 30 MA).
RSI macro divergence confirmation (lower panel shows hidden bullish continuation pattern).
⚓ Renzo Tip
“When the wind blows strong, weak sails tear, but the wise captain knows where to unload the weight.”
→ Meaning: in volatile peaks, lighten exposure — strength lies in controlling load, not chasing wind.
🤲 Prayer Line
May our trades stay disciplined, our minds patient, and our sails guided by wisdom, not fear.
