Bitcoin: holds steady, eyes $118K breakDuring the previous week markets were fully focused on Fed moves regarding the US monetary policy, in which sense, the crypto market was in the second view of investors. BTC was holding at higher grounds, but with relatively slower moves around the $115K up to the $116K levels. The FOMC meeting and Fed's rate cut shortly brought a higher move to the upside, where $117,8K had been reached, however, the price of BTC soon bounced back, ending the week modestly above the $116K level.
The RSI is still holding above the level of 50, showing that investors are still eyeing the overbought market side. The strength is evident within buying signals, however, it seems that the market is just waiting for the right moment to push the price of BTC further to higher grounds. The MA50 started a new round of divergence from MA200, indicating that the potential cross is certainly not coming anytime soon.
Friday brought a short correction of the price of BTC, after reaching the weekly highest level at $117,8K. It seems that the markets needed to test once again the $116K support level, in order to consolidate for the push toward the upside. This is what current charts are showing. For the week ahead, charts are pointing on the potential that the $118K resistance line could be tested. A move toward higher grounds remains under question at this moment. However, in case that BTC reverts back, below the $116K level, then it will open a path toward the much lower grounds in the near future, where the $113K could be tested. Still, considering that RSI had set the path toward the overbought market side, a move below the $116K seems unlikely at this moment.
BTCUSD.P trade ideas

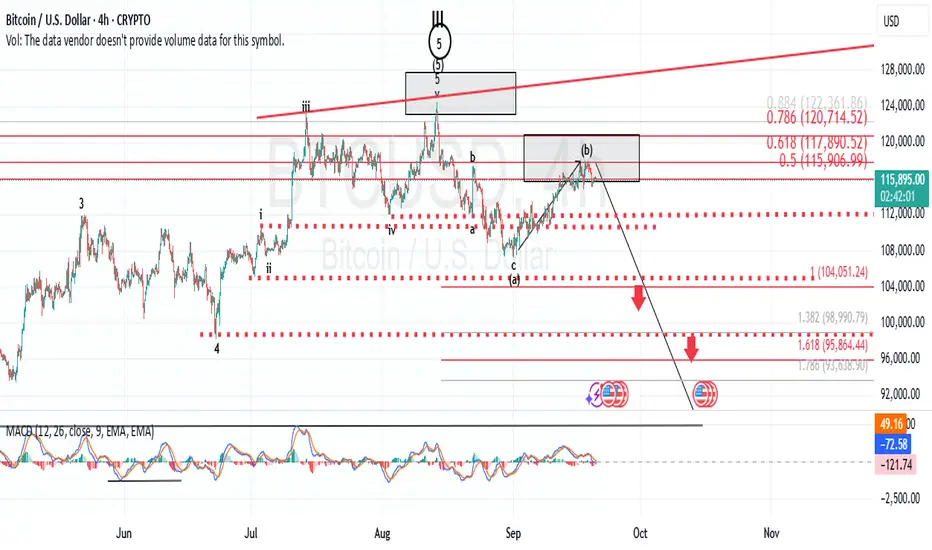
BTC SHORT WAVE B FINISH, NOW WE GO WAVE CThe price has reached the Fibonacci level of 78.6, with a pullback wave in the form of wave B. The weak trend momentum tells us that the price is overheated and needs to cool down. The targets for the downward movement are visible in the chart.

BTCUSD outlook bullish move possible sept/21/9/2025 Entry (Buy): Around 115,300
Stop-Loss: Below 114,000
(Take-Profit): 117,500 – 118,000

Bitcoin: Buying Opportunity at Support Before the Next RallyHello everyone, today I’d like to share a brief analysis of Bitcoin BINANCE:BTCUSD and some key developments in the market.
Currently, Bitcoin is experiencing a mild correction after a strong rally in recent weeks. During this phase, Fair Value Gaps (FVGs) are appearing, which could provide opportunities for the market to fill price inefficiencies and continue its prior trend.
From a technical perspective, Ichimoku Cloud shows that the price is hovering around the Cloud area, a crucial region in determining Bitcoin’s next move. If Bitcoin fails to hold above its current support, we could see another slight correction before continuation.
Macro Factors Impacting Bitcoin:
US Bitcoin Reserves: The US government’s recognition of Bitcoin as a national reserve asset has strengthened investor confidence.
Corporate Adoption: Companies such as MicroStrategy are ramping up Bitcoin purchases, injecting significant capital into the market.
Monetary Policy: The Federal Reserve’s rate cuts may enhance Bitcoin’s appeal as a safe-haven investment.
Bitcoin Outlook:
Although Bitcoin is currently in a slight pullback, I anticipate that after retesting the key support zone between 113,000 and 115,000 USD, Bitcoin will attract strong buying pressure and begin to recover. If it holds these levels, the market is likely to resume its bullish momentum toward the next resistance levels, with the first target at 116,000 USD.
Therefore, if you are monitoring Bitcoin, the 113,000 – 115,000 USD range is a strategic area to consider buying, with expectations of continued upside momentum in the near term.
Wishing you successful trades and always exercise caution in your decisions!

bitcoin short setup ! BTC took final liquidity !CRYPTOCAP:BTC took last liquidity around 117.8 a close blow last 1hr FVG and i will looking for short other wise it can jut make higher higher for rest of week ! will make update if another setup shows up

Nailed it! Accurate Prediction of BTCAs we accurately predicted on the 16th, BTC’s resistance level would be concentrated between the 117000 and 118000 and that is exactly what occurred. After advancing to around 117000, it pulled back; subsequently, it rebounded to near 118000 before retreating immediately.
Currently, the support level at 114400 remains solid, and the overall trend continues to be upward.
Buy 115500 - 116000
TP 116500 -117000 - 117500
Daily-updated accurate signals are at your disposal. If you run into any problems while trading, these signals serve as a reliable reference—don’t hesitate to use them! I truly hope they bring you significant assistance

BTC Bias - HTF - Plan - 22.09-28.09Last week was very quiet for BTC—basically LTF chop/sideways. I’d like to see a move back into the M-VWAP and start trending from there, maybe after a deeper pullback. Overall, BTC hasn’t done much. This isn’t a trade setup—just an HTF plan/scenario to align my trades for the week.

BTC/USD short m15 ; Pro-trend + Pro-internal trendGood weekend, everyone. For the SMC trader
I'm warming up for a trade on BTC/USD with a nice setup. I've spotted a bearish setup on the M15 chart.
I'd like to share my analysis and the entry model I used for this case study. I'm also looking for comments on my idea to help me improve."
Idea detail:
Medium TF: m15
Low TF(for entry): m5
Trend: Both the main trend and the internal trend are in alignment. This presents a very good, high-probability trading situation for me."
Entry confluence:
- m15 mitigated POI
- m5 ch
- Falase break
Target: 1:5 (RR)

BTC USD - Educational IdeaLooking at the current trend BTC is completing a in the middle part of the BC and ST phases of Elliot and Wyckoff phases so the targets are accordingly projected on the chart however the real prices of the chart must b different than projected. Considering the population FVG discussed in the market, it should touch the area of 113300 at minimum. Please use this as education purposes only and not as real trading idea. Thanks

btc updateworst possible out come if we loose 100k.this is a possibility that we have topped out and are now in a bear market.we will have to get more TA in time,but if we continue into a downtrend this will be a worst case outcome and would mean we have topped!

btc possable pullbackbtc has been using this green trend line as support since 2022 we also have a support trend line since 2024 therefore we can see a pullback to the green line and would give us a confluence of interest at 105k. overall btc remains bullish. key level to watch 105k

Can BTC break all time highs?!!BTC is at a position where we can see a new all time high coming in this upcoming days or maybe just a sell off to take out liquidity . what do you think?

1st trading video_TALESFROMTHEPIPS Technical Analysis of Bitcoin on the weekend. Trailor number one.

BTC? Going to be Ugly Final Quarter 2025
Hi,
Once this trendline is broken.
Major selloff, liquidation, take profits.
I'm not an analyst. Consult your own.
I just trade what I see.
It shows that won't look good in near future.
All the best.
Not a guru

BITCOIN: Is This The Bottom?No, Bitcoin bottom is not in yet. but the 1hr tf is setting up for a overnight or early morning spike in price but that's not the real move that will take price to ATH.
Lets see how low bears are able to push price down to print the low of the trading range.
So far $114500 has been strong support on the 4hrs tf but with the TIME bears have left
(around 30 4hrs candles) can easily break down that "strong" support.
For now make some money and bail out but by end of next week have those longs ready for next real move.
Remember weekly up trend hasn't change yet.

Educational IntraDay BTC Bear Idea 💵🐂The Previous Day bull positions achieved 💰 TS 🛡 at +5.2pips✅
💵🐻The BTC Price is gravitating towards the PDL of course we are gonna SELL if the price BREAKS DOWN the H2 Channel's support and retest the SBR.
TS at the price of 15690.82 is suggested as usuall when the price is at least +vely 20pips away from the EP➡️
EP=Entry
PDL: Previous Day Low
TS=Trailing Stop
SBR=Support Becomes Resistance
⚠️ DISCLAIMER : Be informed that eTrading 💱 could be risky🆘 on the capital the same way as its profitability 💰. It's thus for educational purposes and a risk I can bear, so, follow knowing the risk 💸 and benefit 💰 involved🚨.

Elliott Wave ABCDE analysis 4H chart for BTCUSD September 20For educational purposes only.
From the chart it is seen A,B,C,D,E a BARRIER outer line flat squeezing upper momentum the next would be a breakout up towards 117500-118500 area where there might be a selloff again, the support area is around 114500. Since the dollar is weak and rate might decrease it is a good time to buy. I doubt there would be more dips below 114500 for major 113000 support area, I would simply increase investments there. Targets are 120500 by end of September more likely to occur.

Bitcoin DailyOn the daily timeframe, Bitcoin has successfully rebounded from its lower range. However, before any further upward movement, a corrective pullback to the downside is anticipated. The trade setup currently offers a favorable risk-to-reward ratio of approximately 3:1.”

A descending channel/bullflag reveals itself on btcusdThe pole looks more obvious on longer timeframe charts but the flag/ channel itself is best illustrated on the 1day time frame. In fact there is a much longer pole than the one shown here on the monthly chart, but I didn’t go with that one because the flag on the monthly is more of a horizontal channel than the descending channel shown here on the 1day chart. *not financial advice*

Parallel StructureBitcoin needs to hold the parallel structure and stay above the $115, 000 levels. Bitcoin may test the 116K level soon since that is the midpoint of the channel and also the 200 EMA (in Orange) if it doesn't have a bearish break down

Bitcoin has appeared to have struck a meaningful topHaving retraced right into the 61.8% Fib retracement level, I am expecting BTC to exit the target box to the downside in the days to come, with a high possibility to retracing to the $84,000 level in the weeks and months to come.
Bitcoin: Easy Monetary Policy Means Buy Pullbacks. Bitcoin has rejected the 118K resistance for now, but with the FOMC behind us and an EASY monetary policy agenda ahead of us, I would be looking for buying opportunities. The current rejection of resistance is confirming the consolidation which may persist for some weeks or months but based on the current environment, there is a greater probability of a bullish break out.
The economic environment plays a key role here. Based on the history of FED rate cuts, the S&P is very likely to be higher over the coming year as a result. This implies short term pullbacks should be viewed as buying opportunities and I believe the same will be for Bitcoin. UNLESS something fundamentally changes. Like the FED changes its policy for some unexpected reason, etc.
This easy monetary policy makes a strong argument against my Wave 1, Wave 4 overlap confirmation event that occurred in Bitcoin when it briefly broke the 108K area. Since the environment favors inflation, the current consolidation developing in Bitcoin can still be the broader wave 4. This implies there is a bullish wave 5 ahead which is in line with Fed policy. The consolidation break can be very similar to how Gold behaves which recently broke out to new all time highs. Keep in mind, I am not one of these "Bitcoin is going to a trillion" Michael Saylor people, I am just interpreting the price structure through a fundamental lens.
So for swing traders and investors: I am looking for any price move back to major support levels like 113K (See chart), 108K or even the 105K area (extreme). Over the short term, pullbacks that seem dramatic can unfold which is why waiting for major levels is key. Upon such a retrace, I will be looking for reversal confirmations like pin bars etc. Also I will use my Trade Scanner Pro to define risk and profit objectives on smaller time frames like the 4H AFTER the predetermined support is reached like 113K.
Thank you for considering my analysis and perspective.

sell signal for BTC4 hour RSI breakout to the downside, based on rsi indicator it looks like chart trendline is gonna be broken
