BTC/USD - High Volume Control🚨Price travels from one Institutional high-volume area ➡➡️
🚨To the next Institutional High-Volume area: POC- Points of Control✅🎯
❌Avoid chasing between levels.
✅In some cases where key volume areas are far apart - draw a 50% line.
✅This may act as an interim support, resistance and/or consolidation areas
---------------------------------------------------------------------------------------------------
🎯 KEY PIVOT
📍 Zone Type: ATH SUPPLY/RESISTANCE
📊 Price Range: 123,000-124,500
📏 Distance: 296-1,796 pips ABOVE current price with strong rejection history
📊 MAIN BIAS
🔴Bias: NEUTRAL-BEARISH
📌 Context: Multiple rejections from ATH resistance zone
💎 DIAMOND EDGE - Primary Setup
🎲 Direction: BEARISH from 123,000-124,500 WHEN PRICE RALLIES TO IT
🔍 Confirmations:
⚠️ NOTE: Wait for price to rally back into supply zone before shorting
✅Bearish rejection wicks forming AT 123,000-124,500 zone
✅Volume expansion on sell-off AT resistance zone
🎯 Targets:
T1: 117,000-118,500
T2: 109,000-110,500
T3: 104,000 area - in case liquidity is required
🔄 BIAS FLIP SETUP🟢
⚡ Trigger: Decisive 4H close above 124,500
🎲 Direction: BULLISH from 123,000-124,500 ON breakout reclaim
🔍 Confirmations:
✅Strong bullish breakout close above 124,500 with volume
✅Successful retest of 123,000-124,500 holding as support
🎯 Targets➡️➡️DISCOVERY:
📈Breakout extensions:
T1: 129,000+
T2: 137,000+
⚠️ SESSION RULES
🕐 Trade high-volume sessions
📰 Monitor crypto market catalysts and regulatory news
💡 Respect multiple rejection history at resistance zone
BTCUSD.P trade ideas

BTC LAST 3-DRIVE EFFORT TO 127-128K TARGETMorning folks,
So, we're done with 2-3 weeks journey of reverse H&S patterns as BTC has hit our 126K target. Unfortunately we haven't got another chance to enter on last Thu, as we hoped, but now it is done already...
Since we have all-time BTC AB=CD target around 127.10K, we suggest that price could try to make a last upside effort via 3-Drive pattern to complete it.
Thus, if you have longs, you could try to hold them until target will be met. In fact, if you want to could initialize a new intraday setup, with tight stop, somewhere below 122K area.
We consider no shorts by far. Situation slowly is preparing for the pullback, but not yet. Major target have to be done first.

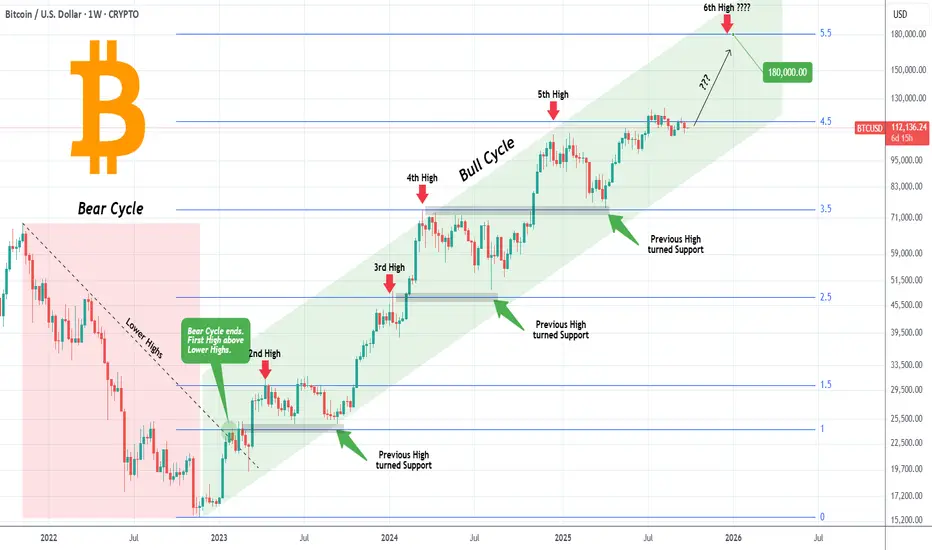
BITCOIN Is there time left for one final run??Bitcoin (BTCUSD) has been trading within a Channel Up pattern through the entirety of its Bull Cycle. The key characteristic of this pattern, which has also helped us at taking profits during each phase in timely manner, has been that every High since the Bear Cycle's Lower Highs trend-line broke, has been on a +0.5 Fibonacci extension interval.
As you can see, starting from Fib 1.5 ext, BTC has fulfilled the pattern by making Highs on the 2.5, 3.5 and 4.5 Fibs so far. What technically remains plausible until the end of the year is the 5.5 Fib ext, which sits at $180k.
With the 4-year Cycle theory suggesting a Cycle Top a little before the end of the year, is it realistic to expect this Target? Do you think there's time for BTC to make one final run like this? Feel free to let us know in the comments section below!
-------------------------------------------------------------------------------
** Please LIKE 👍, FOLLOW ✅, SHARE 🙌 and COMMENT ✍ if you enjoy this idea! Also share your ideas and charts in the comments section below! This is best way to keep it relevant, support us, keep the content here free and allow the idea to reach as many people as possible. **
-------------------------------------------------------------------------------
💸💸💸💸💸💸
👇 👇 👇 👇 👇 👇
BTCUSD POSSIBLE MOVEMENT MUST READ CAPTIONHello traders here is my first idea about BTCUSD please share your thoughts on it and dont forget to comment
Key Points
Current price 125400
Target area 1 122000
Target area 2 116000
Follow us for more updates on BTCUSD and share our ideas with your friends and family

BTCUSD NEXT POSSIBLE MOVE BTC is showing potential weakness around key resistance.
If price fails to hold above this zone, a correction move can be expected toward lower levels.
Currently, the market structure suggests sellers might gain short-term control — but confirmation is still required before any strong move.
⚠️ This is only a possible scenario — wait for clear breakout and confirmation before entering.

don't FOMO and chase the high price for BTCUSDMarket would have you believe that you are LATE in the game and need to get in asap! We can see that this is the 3rd attempt to break above and a current bearish pin bar is evident that near term , prices should pull back.
Be patient and wait for the pull back unless of course you still believe BTCUSD could goes up to 500k as some gurus predicted.

This month is likely the BTC cycle topWhat do you guys see in this chart? This month could really be the top. 35 Months bottom to top for the last 2 cycles.

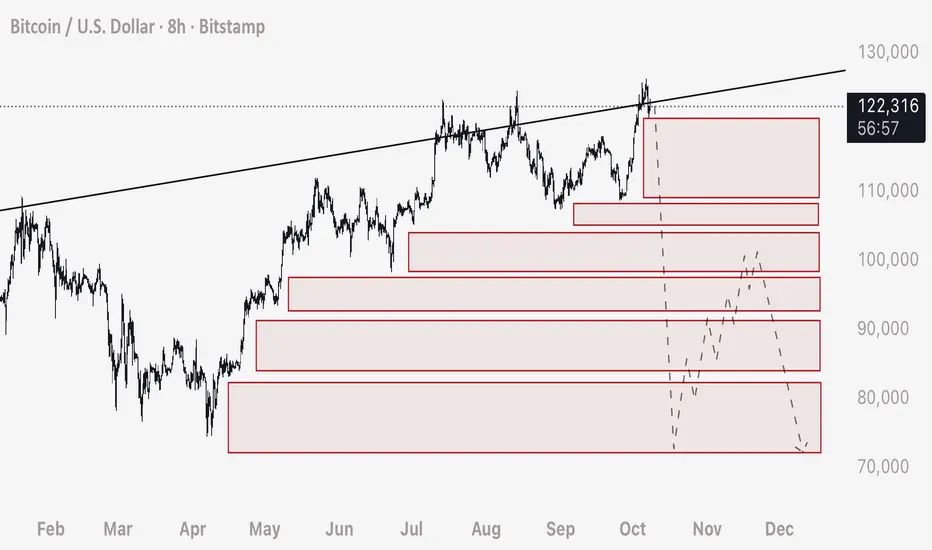
Using Order Blocks to Predict Price Movement on HTFExpanding on my previous post, we can apply this technique to predict price movement on the higher time frames (8 Hour in this case).
Step 1 - Drawing the Boxes
- Fundamentally what we want to do, is look at the price movement and figure out where clusters of stop loss would be contained.
- To do this, we want to look for the areas of upwards (in this example) consolidation that hasn’t dropped down to trigger the orders.
- I have drawn boxes here close to the candle set, and extended them out past where price currently is to prove that these areas have not been reclaimed or had the stop loss orders triggered.
PLEASE NOTE: Stop Loss orders and Liquidation Orders are very unique. Unlike limit orders that will automatically fill if price is above or below, these orders do not fill unless price CROSSES the exact price of the order. In essence, it’s important to understand that looking back on the chart we can understand there are limit orders for sells (in this example) that’s below the current price. If a limit sell order was to be placed at a lower price, it would fill automatically if price is above.
- We can anticipate a take profit (locally in this example) at 74,000. SHORT entry should be where the orders begin to set off to a large degree, in this example, entry would be BELOW where price currently is, at 122,200. We want to make sure that the stop loss orders will be enough to carry the price through these blocks. Stop loss can be places above the local wick high (where the SHORT stop losses have already been filled) at 123,900.
Step 2 - Predicting and Understanding Wick Speed
- To predict how fast the movement will complete, we need only evaluate the amount of TIME allowed for positions to be placed (longs in this example). Very simply because the more time provided to traders in an upwards consolidation, the more positions and consequently stop losses and liquidations will be placed below the price.
- More TIME = More Orders = Faster Wick Speed. To understand this another way, imagine there was 2 scenarios where regular limit buys were placed. Scenario 1 has 100 people placing buy orders, Scenario 2 has 10,000 people placing buy orders. Scenario 2 would move price higher at a faster speed, and to a greater distance. In other words we are predicting VOLUME of STOP LOSS ORDERS.
PLEASE NOTE: Stop Loss orders move price at a greater volume compared to the position entry. If Trader A uses $1,000 to open a Long, and uses a leverage of 10x - his Stop Loss or Liquidation order is to close the entire leveraged position size. While he is injecting $1,000 of liquidity into the market with his order, he is consequently leaving a sell order underneath his entry for $10,000 (leveraged position size).
PLEASE NOTE: The placement and amounts contained in stop losses or liquidations are not available to the public. Exchanges do not need to disclose that information, and you can assume it’s only shared with the market makers or liquidity providers. Heatmap Platforms such as Coinglass have disclaimers that state it’s not based on true date and is only a prediction.
SUMMARY:
I hope this serves you with a practical demonstration of how we can use Stop Loss analysis to predict price movement.
I also hope that you can understand you’re able to do this yourself by developing the vision to quickly see it in the chart. We are blessed in that we simply need to look backwards to see where we will be going next, as the orders that move Bitcoin are previously embedded in the chart.
Yours truly and all the best,
- DD
If you have any questions or want further clarifications - please ask in the comments and I will answer you.
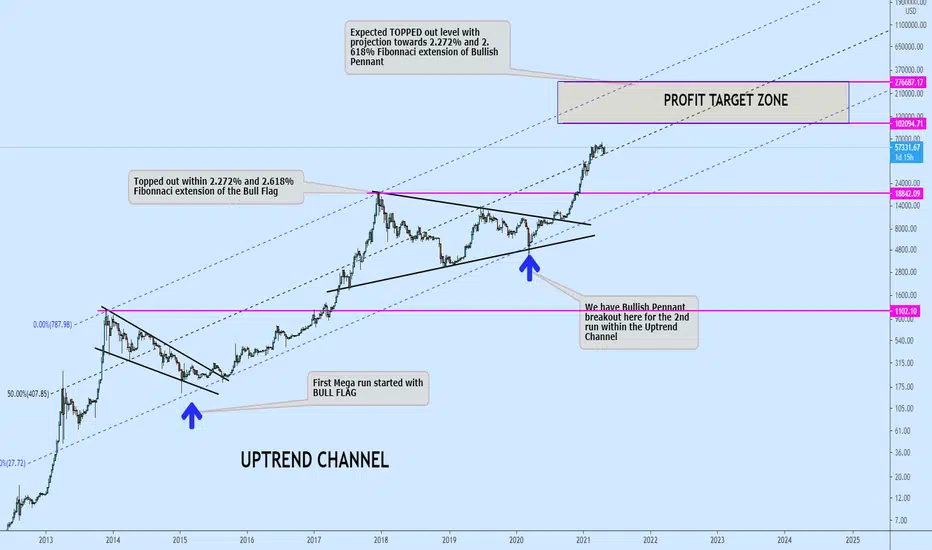
Bitcoin channel targeting 100k-250k rangeHello guys,
Its been a while on here, today I decided to bring my latest research for everyone to have a look at. Well, as we all know BTC has been holding up within Rising or uptrend channel, this channel is very promising with huge potentials. If you are familiar with my previous post where I talk about the rising channel, the post is shared here:
We are currently trading above the median of the channel which mean the next priority is testing on the upper line of the channel and is coincidence to one of my previous idea of bullish pennant which have target towards the top of the channel.
This is not a trading signal but just a potential decision making idea to know the most dangerous zone to watch for.
Thanks.
BTCUSD : It is never different this timeAs anticipated, $108,800 proves to be the line to watch. Price bounces upward in a strong momentum, to fulfill its destiny to meet F at the appointed time.
It seems that everything I read nowadays is saying BTC is a sure bet.
Please exercise caution.
Good luck.

BTC/USD – 15m Symmetrical Triangle SetupPattern: Symmetrical triangle after a strong bullish impulse. Market is consolidating inside narrowing support & resistance. A breakout is likely soon.
Bullish Scenario
• 📈 Entry: Buy above 123,000–123,100 (confirmed breakout)
• ⛔ Stop-Loss: Below 122,500
• 🎯 Take-Profit 1: 123,892 (major resistance)
• 🎯 Take-Profit 2: 124,500+ if momentum continues
• 🔄 Option: Wait for retest of 122,750 zone before entry
Bearish Scenario
• 📉 Entry: Sell below 121,700–121,800 (confirmed breakdown)
• ⛔ Stop-Loss: Above 122,300
• 🎯 Take-Profit 1: 120,764 (major support)
• 🎯 Take-Profit 2: 120,000 psychological round number
Break up = aim for 123,892+
Break down = aim for 120,764

BTCUSD Setup You Can’t MissHey everyone, Kilian here!
The Bitcoin market keeps showing positive signals as the uptrend holds steady. On the technical chart, a double bottom pattern is gradually taking shape, with the first low followed by a higher low, a clear sign that buying pressure is building. At the moment, price is trading just above the neckline, a critical level that many analysts see as the key decision point for the next move.
If price holds above the neckline and confirms the breakout, the bullish scenario aiming toward 124,625 becomes stronger. But if the market slips back below this level, it could signal buyer weakness and raise the risk of a reversal.
As always, traders should wait for clear confirmation before entering, and stick to strict risk management rules in this volatile environment.
Trade safe and stay disciplined.

BTCUSD-SELL strategy Monthly chart GANN SQIt has been impressive moves till now, and we hear clearly what the forecasts are, i..e. $ 500k by 2030 etc. Happy for those longs, if it does. Technically we are very overbought for a long-time now, and also the chances are for a solid correction is there. the GANN SQ surely suggest ther higher side still could be $ 130k or so, but the return level $87 k and $ 63 k seems very possible from a correction stand point of view. for the medium-term. Markets are very long adding to that, and if they start unloading in large quantities, moves down will be extremely sharp. Anyway, this is my personal view, and let's see what will happen next.

Bearish Butterfly on BitcoinBTC is approaching a Bearish Butterfly PRZ at $128K–$130K.
Immediate support: $117K
Deeper support: $113.5K & $106.9K
Resistance: $124.6K, then PRZ $128K–$130K
Short-term trend is bullish, but harmonic structure signals caution. Watch for RSI divergence or bearish candlestick confirmation near the PRZ before considering reversal trades.

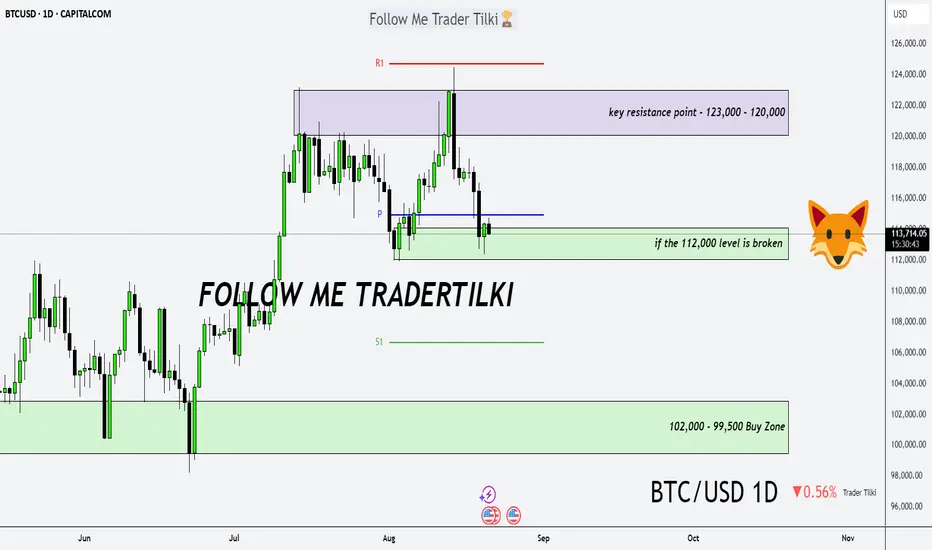
Bitcoin Daily Analysis – The Trend Is Our FriendGood morning, Guys,
I’ve prepared a fresh Bitcoin analysis for you.
🔹 First off, I stand firmly behind my long-term targets of **127,000 – 137,000 – 146,000**. I previously shared these levels with you in a weekly analysis.
🔍 Now let’s shift to the 1-day chart:
What is Bitcoin telling us right now?
📉 If the **112,000 level breaks downward**, we could enter a correction phase toward **102,000** or even **99,500**. I expect strong buying interest to return from those zones.
📈 After that, we’re facing a key resistance structure between **123,000 – 120,000**.
But I believe this zone will also be broken—because we’re in an **uptrend**, and…
💬 **The trend is our friend. Never forget that.**
BTC / USD Yeni Rekor Geliyor Mu?Hello everyone,
Dear investors, my analysis indicates that Bitcoin could reach 133,000 within the next week. I believe profits will be realized again at this point.
This is not investment advice; I wish you abundant profits.

BTC WeeklyBitcoin has always moved in repetitive cycles: a strong bull run, followed by a correction phase, and then starting a new rally from the lows. If we look at its price history, we can clearly see that these cycles repeat every few years with very similar patterns.
Right now, Bitcoin is in a position that looks very similar to the past cycles. When we align these patterns, it suggests that another correction could be ahead.
🔹 In my opinion, based on these cycles, Bitcoin could see a deeper pullback over the next year and even drop to around $47,000.
Of course, this is just a personal view based on past market behavior and not a guarantee — but history shows Bitcoin has repeated this path many times.

BTCUSD – Sell Setup After Liquidity Grab (M15 Analysis)On the 15-minute BTCUSD chart, price built equal highs just below 125,323 → this acted as a liquidity pool where many traders placed short stop-losses or breakout buys.
Smart Money usually pushes price above such levels to grab liquidity (stop hunting). That’s why we do not enter a sell before this happens — otherwise, we risk being stopped out during the sweep.
Once the liquidity is taken (price trades above the highs and then shows rejection with strong bearish candles or a change of character), it signals that the buy side liquidity is consumed and large players may reverse the move.
The ideal sell entry is placed after confirmation of rejection from above liquidity, not before.
Stop-loss should be placed just above the liquidity sweep high.
Targets should be set towards the nearest demand zones / imbalance fills (for example around 123,800 → 123,400 as seen on your chart).

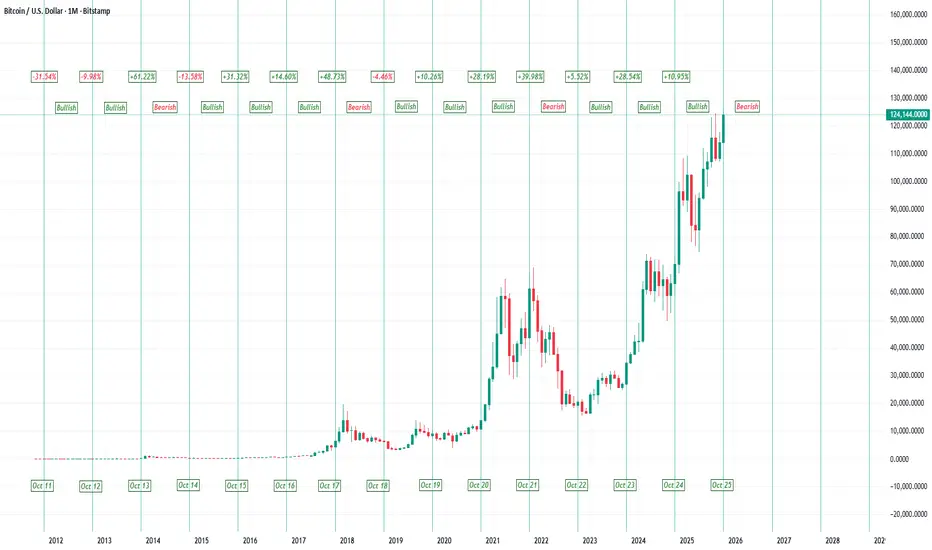
BTC: It’s October againOctober or Uptober (as they say) is a month wherein BTC has demonstrated a beautiful pattern over the course of its history. BTC’s return in October can be guessed depending on where the month falls in BTC’s well-known 4 year cycle.
The month of October that falls after BTC has peaked post-halving is expected to have negative returns as BTC remains in a bearish trend. While the remaining 3 months of October in BTC’s 4 year cycle are expected to have positive returns as BTC remains in a bullish trend.
As such, following months of October were bearish: Oct 2014, Oct 2018, Oct 2022. The remaining months of October had positive returns (except Oct 2011 & Oct 2012; which can be excused as very early months before BTC established a 4 year cycle).
Currently, in Oct 2025 BTC is expected to have a positive return as it is in a bullish post-halving trend. Based on the above facts and future expectations, traders can position themselves better to capitalize gains in their portfolios.
Good Luck!!
Impressive performance from the AI yet again!After follow-up analysis of what the AI said would happen, I now see that it was correct!
The parameters it has to work within doesn't allow it to express how far the price will travel, but that's okay, as it gives what it's going to do next and when it's going to do it.
This is the revolution Trading needed.


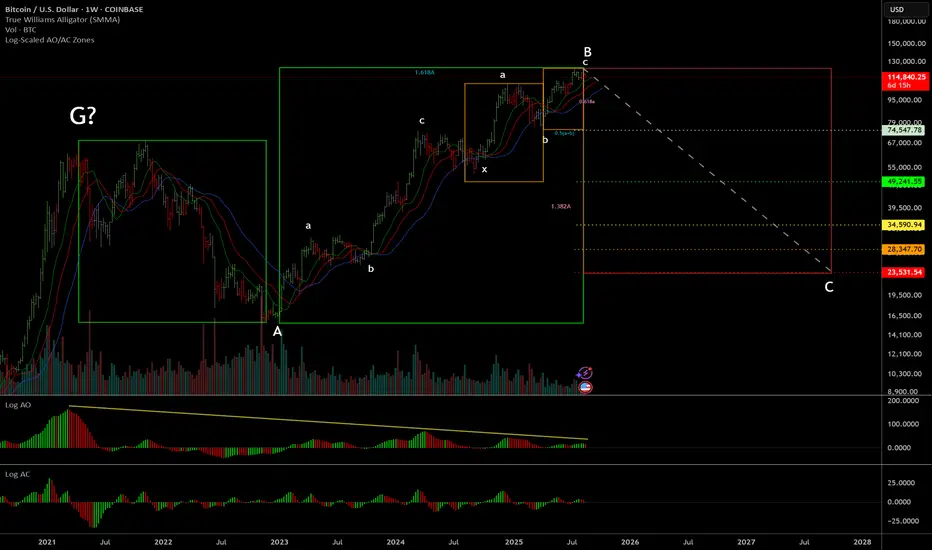
BTC Double Zigzag Ending on Terminal Impulse (Elliott Wave)BTC has formed into a double zigzag from the low in 2023 until now. This is the same count that my friend Glenn Neely (the founder of Neowave) is following.
At this point there aren't really any other counts that appear to make sense. Especially considering the terminal impulse that wave-c has formed (see Daily chart).
We've already begun breaking down from the rising wedge pattern, which is a strong indication that wave-c has concluded.
Beyond just Elliott Wave/Neowave considerations, this has also formed long-term momentum divergences on the AO, and a clear weekly wiseman right at the end of wave-5 of c, perfectly aligned with the 0.5(a+b) time target for wave-c.
This perfect confluence of signals here is a very strong signal the market has topped out long-term, and could retrace all the way back to ~$23k in the worst case scenario. Other potential retracement levels are labeled on the chart.
If this does end up breaking $125k, then it may be a good idea to flip bullish as the bull cycle could continue for an unknown amount of time after that. For now, probabilities are starting to stack up indicating that the top is in and a big retracement is coming.
BTCUSD is experiencing a pullback. It would not be smart to buy Since the Singapore Crypto Summit, BTC has risen above $120,000.
(You can refer to my October 1st post, which explicitly predicted BTC would reach $120,000.)
Buy orders have already taken profits, and the 4-hour chart shows a correction and pullback.
If the price fails to break through 121,000, the next targets are 118,000 and 116,000.
After that, a new round of gains will begin, targeting 123,000.
