ANFIBO | BTCUSD Analysis – Weekly Trading PlanHi guys! It's me, Anfibo. My plan last week gave us a good profit selling from 118,000 USD to 115,000 USD.
And over the past weekend, BITSTAMP:BTCUSD consolidated in a sideways range, consistently holding above key support. However, with the opening of the new week’s Daily candle, the market decisively broke down through this support zone, signaling that selling pressure is now taking clearer control.
From a technical perspective, the next critical support levels to monitor are:
• $113,000
• $111,000
• $109,500
Around the $110,000 region, I view this as a pivotal area to consider initiating spot entries or building larger long-term positions. This zone is not only a technically strong support level but also carries significant psychological weight for institutional and large-scale flows.
Imo, in the short term, BTC may still attempt a retest of the $115,000 level before resuming its downward trend, depending on lower-timeframe reactions. This creates an opportunity for traders to capitalize on corrective moves.
>>> My Trading Plan for the Week:
(1) SELL SCALP:
– ENTRY: around 115,000
– SL: 117,000
– TP1: 113,000
– TP2: 110,000
(2) BUY SETUP:
- ENTRY: 109,000 - 111,000
- SL: 107,000
- TP1: 117,500
- TP2: 122,000
- TP3: 128,000
This strategy is designed for short-term trades, taking advantage of volatility within the current range. For long-term investors, patience will be key—waiting for BTC to approach $110,000 or lower provides a strategic opportunity to restructure portfolios and scale into positions at more favorable prices.
👉 Conclusion: BITSTAMP:BTCUSD has broken out of its weekend consolidation and is now entering a fresh leg down. Short-term traders should look to sell corrective bounces, while long-term investors should focus on accumulation opportunities near $110,000 - a level that could serve as a “strategic entry” for the upcoming cycle.
WISH EVERYONE A NEW WEEK FULL OF ENERGY! ;)
BTCUSD.P trade ideas

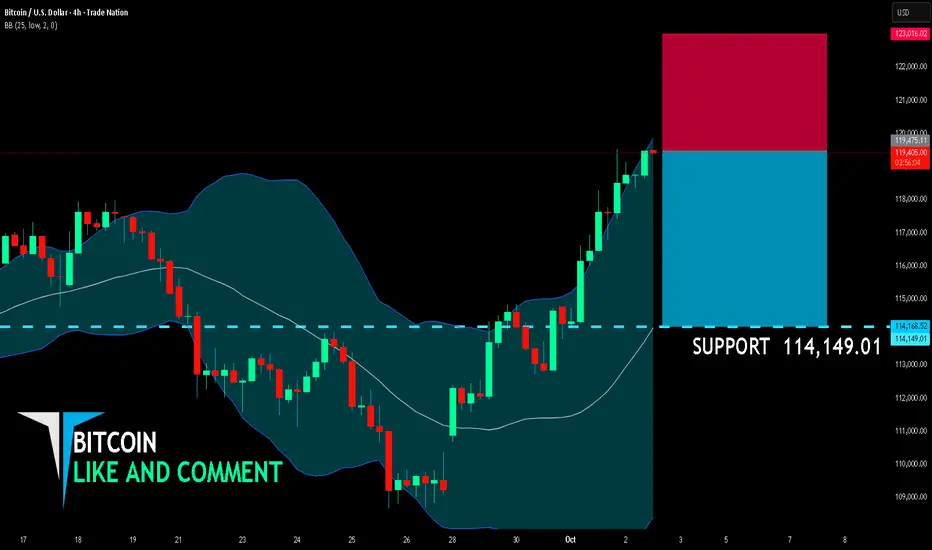
BITCOIN BEARS ARE STRONG HERE|SHORT
BITCOIN SIGNAL
Trade Direction: short
Entry Level: 119,475.11
Target Level: 114,149.01
Stop Loss: 123,016.02
RISK PROFILE
Risk level: medium
Suggested risk: 1%
Timeframe: 4h
Disclosure: I am part of Trade Nation's Influencer program and receive a monthly fee for using their TradingView charts in my analysis.
✅LIKE AND COMMENT MY IDEAS✅
The Last Bitcoin Bear Trap Before Q4 2025Today, let’s face the reality: monthly candles are in distribution. But this is the last bear trap before October. Either take advantage of this opportunity or run away with paper hands. This dip will end very soon, as the Stoch RSI rebounds from the bottom and the RSI completes a hidden bullish divergence from the lows

BTCUSD: Sideways market plan🔁 Review of Yesterday’s Plan
Yesterday, we had two breakout trading plans for BITSTAMP:BTCUSD :
IRB (Inside Range Break)
Price moved exactly as projected.
Trade reached a profit of 2R – 2.5R, depending on individual target exits.
RB/ARB (Range Break / Advance Range Break)
Price reached the top boundary of the range and formed a bullish breakout candle,
but was immediately followed by a strong bearish candle pulling back into the range.
This was a clear False Breakout → No trade was taken, waiting instead for the next clear setup.
📈 Market Outlook for Today
BITSTAMP:BTCUSD has now moved back inside the larger range (125,710 – 122,383), showing that the market is currently sideways within a wide range.
The most recent candle closed below the EMA, indicating no clear signal for continuation trades yet.
🧭 Trading Plan for Today
Wait for a new compression setup to form before entering.
If price consolidates and compresses near the upper boundary of the range, prepare to Buy once confirmation appears.
If price continues to drop toward the lower boundary of the range, consider Sell setups, depending on how price reacts to support.
🎯 Summary:
BTC is currently in an accumulation (sideway) phase.
Be patient and wait for a valid breakout setup before taking action — avoid chasing the market and focus on trading only when momentum and confirmation align.
You can refer to my previous analysis here:
Please like and comment below to support our traders. Your reactions motivate us to do more analysis in the future 🙏✨
Daniel Miller @ ZuperView

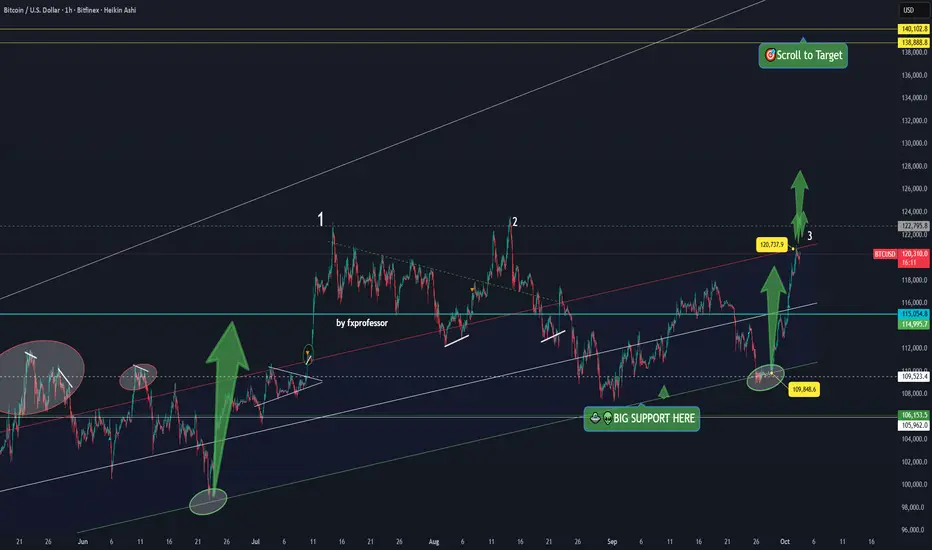
Bitcoin Friday Update: Third Attempt at Breakout📈🚀 Bitcoin Friday Update: Third Attempt at Breakout 🎯
Friday often brings momentum, and this one might not disappoint.
Yesterday, I highlighted the level at $120,737 — the very top of the move. And here we are again, pressing for the third attempt higher inside the same ascending channel I’ve been sharing with you for weeks.
🔑 Current Setup
Entry from the lower band near $110,000 has aged well.
We are now testing the upper red boundary around $120,800.
A clear break above opens the path to:
→ $122,000
→ $138,800 (main technical target)
⚖️ Long vs Short
Long bias remains valid as long as price holds inside the ascending channel.
A short attempt? Technically possible here, but risky .
→ If price breaks above the red resistance line, shorts will need to exit quickly.
Remember, manipulation faked out traders twice before around this zone. But this time it’s October, and cycle compression is on our side.
🌍 Macro Context
Rate hikes continue.
Gold and stock indices have already moved higher.
Bitcoin, historically lagging, may now have catch-up ground to cover.
This aligns with the broader cycle thesis — October is rarely quiet.
🕒 Weekend Outlook
✅ If Bitcoin breaks out → Expect altcoins to light up this weekend.
❌ If Bitcoin fails → Likely a slow, sideways weekend.
But my read? This weekend looks set to be exciting.
💡 Thought of the Day
“Did the Market take a pause for Bears to Load on Shorts?? Or is it Longs that get smashed next?” I think the First!
Trade wisely.
One Love,
The FXPROFESSOR 💙
Bitcoin Outlook: Structure Intact, 140K Still on the TableIn my previous BTC analysis, I mentioned that a new all-time high was almost a certainty, with potential for a new leg up toward 140K–150K.
Indeed, BTC delivered — printing a fresh ATH, followed by a short and healthy correction.
At the time of writing, the price has reversed from just above 120K, showing strong demand.
Today’s daily candle displays a long lower tail, a clear sign of buying pressure, and could easily close as a continuation Pin Bar — signaling that bulls are still in control.
Key Zone to Watch
118K support – remains the line in the sand.
As long as this level holds, bulls have no reason for concern and the “buy the dips” strategy stays valid.
Outlook
Momentum remains bullish, structure remains intact, and the path toward 140K stays open — until proven otherwise. 🚀
BTCUSD: Monday analysis and buy plan within rangeLast week, BITSTAMP:BTCUSD had a strong bullish recovery, setting a new all-time high.
At the moment, the trading plan remains bullish (Buy bias), but risk and position sizing should be managed carefully, as the market may experience short-term corrections after such an extended rally.
🧭 BTC Trading Plan
Small Range within a Larger Range
Price is currently moving inside a smaller range within a larger range.
Wait for price to accumulate momentum and form an IRB (Inside Range Break) signal before setting up a potential Buy entry.
Upper Boundary of the Larger Range
Once price breaks the IRB and approaches the upper boundary of the major range, look for price compression near EMA.
Upon confirmation of an RB/ARB (Range Break / Advance Range Break), execute a Buy market order, aiming for a reward ratio of 2R or higher.
If the Market Deviates from Plan
Stay on the sidelines and wait for clearer signals before re-entering the market.
🎯 Summary:
BTC remains in a bullish structure, but selective entries and disciplined risk control are essential.
Wishing everyone a productive and profitable trading week ahead!
You can refer to my previous analysis here:
Please like and comment below to support our traders. Your reactions motivate us to do more analysis in the future 🙏✨
Daniel Miller @ ZuperView

BTCUSD: Weekly reviewThis week, BITSTAMP:BTCUSD recorded a strong rally, moving from 109,900 → 120,800, equivalent to about +10,900 USD (+9.9%).
After last week’s sharp decline, the market clearly reversed into an uptrend as price broke out and held firmly above the EMA.
Today is Friday, and the market may experience strong volatility due to the Non-Farm Employment Change (NFP) report – an event that often has a major impact on price movement and trading strategies during the day.
Key Setups of the Week
1. BITSTAMP:BTCUSD Review – September 29
After a sharp drop, BTC rebounded, broke out of the range, and held above the EMA.
This was an early signal confirming a trend reversal from bearish to bullish.
2. BTC Review – September 30
After breaking out of the larger range and rallying strongly, the plan was to wait for a pullback toward the EMA.
Price formed a diagonal wave and gave confirmation signals through DD (Double Doji) / FB (First Breakout).
The entry was triggered, and the market rallied nicely, hitting the target as expected.
3. BTC Review – October 1
After the rally, BTC retraced and closed below the EMA.
At this point, the short-term trend was unclear → staying out and waiting for more market data to avoid unnecessary risk.
4. BTC Review – October 2
On the following day, price recovered and consolidated right at the upper boundary of the range.
EMA pressed tightly, creating a momentum compression zone and setting up for the next breakout.
The plan was to wait for RB/ARB confirmation, then Buy following the breakout.
This setup worked out successfully, BTC broke out strongly and continued to hit the target.
5. BTC Review – October 3
The main bullish trend continued, showing no signs of weakness.
The plan: wait for a pullback to the EMA, confirm a FB/SB (Second Breakout) signal, then Buy in line with the uptrend.
The scenario played out accurately, delivering another profitable setup.
Conclusion
Trend of the week: Clearly bullish.
Buy setups around EMA and breakout strategies performed effectively, resulting in a consistent winning streak.
Caution for today: With NFP on the schedule, unusual volatility may occur. Traders should manage risk carefully and patiently wait for clear confirmation signals before entering the market.
You can refer to my previous analysis here:
Please like and comment below to support our traders. Your reactions motivate us to do more analysis in the future 🙏✨
Daniel Miller @ ZuperView

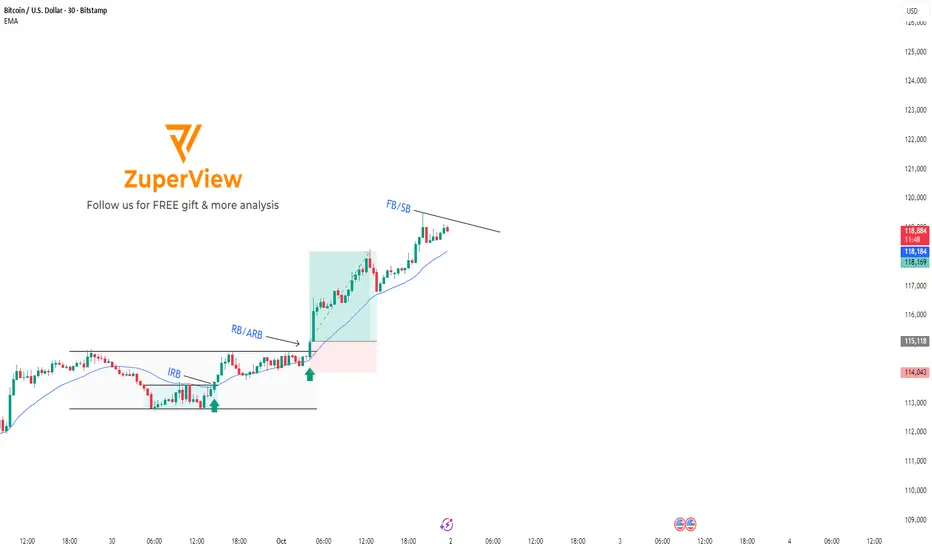
BTCUSD: Breakout played out, focus on EMA retestOverview
Yesterday’s Breakout Plan played out correctly, with BITSTAMP:BTCUSD continuing its bullish move.
The market remains in an uptrend, with no clear signs of reversal.
However, price is currently trading far above the EMA, so it’s not ideal to chase entries here.
Trading Plan for Today
Primary Scenario:
Wait for BITSTAMP:BTCUSD to retrace closer to the EMA and form a momentum consolidation zone.
If confirmation appears (e.g. breakout through the short-term trendline), consider long entries in line with the trend.
Alternative Scenario:
If BTC closes below the EMA with strong bearish momentum, a deeper correction is possible.
In this case, stay cautious and wait for a new structure to form before re-entering.
You can refer to my previous analysis here:
Please like and comment below to support our traders. Your reactions motivate us to do more analysis in the future 🙏✨
Daniel Miller @ ZuperView
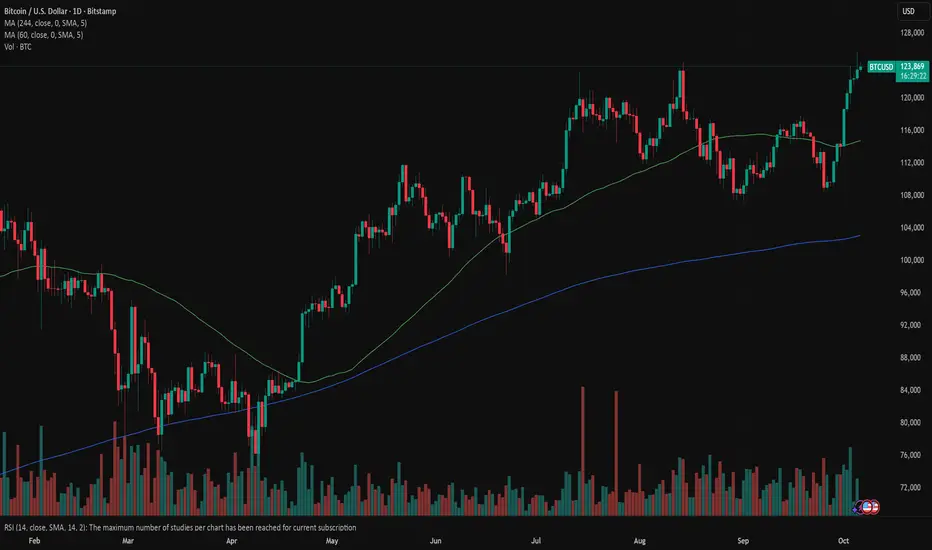
Bitcoin: Shutdown fuels BTC movesBTC had a very good week, where the price of coin returned to its highest levels, above the $122K, modestly touching the new all time highest level at $123.870. At Saturdays trading, the price modestly reverted back to $122K. There are several reasons for such a move during the week. Political and fiscal uncertainty caused by the “shutdown” of the US government on October 1st, prompted some investors to enter into more “safe-haven” alternatives like BTC. On the other hand, weaker private jobs and the government shutdown increased investors expectations that the Fed might cut further interest rates as of the end of October by another 25 basis points, which again supported investments in riskier assets. As per comments from analysts, the latest push of BTC to the upside was supported by a real allocation of funds from investors, where the most of it came from institutional ones, while on-chain data shows fiat funding rates and accumulation by long-term holders, implying the move is backed by real demand rather than excessive leverage.
BTC started the week around the level of $112K, and for the rest of the week was strongly pushed toward the $123K. The RSI modestly touched the level of 70, indicating the potential for a short term reversal in the coming period. Although MA50 previously started its modest path toward the MA200, since last week, it reverted back to the old path, and started diverging again from its counterpart. The cross is certainly not in store for some time in the future.
The combination of fundamentals pushed the price of BTC toward the upside during the previous week. It could be expected that on the same grounds the price of BTC will either hold with a modest reversal, or will be pushed further, depending on further fundamental news. In case that BTC starts to revert, then the next level to watch would be the $118K current support. On the upside, $123K is the level to watch. In case that it is clearly broken toward the upside, then we will have a fresh new ATH for BTC.
118.60-119.50K for BTC BounceMorning folks,
So, the final leg up has happened that we discussed last time, but it was not as strong as we've expected. It means that all time high target around 127K is not done yet.
Meantime, BTC is taking the breath. Since upside momentum looks nice, we consider first support area around 118.6K - 119.50K as potential for long trade. Especially if we get this butterfly pattern.

Simple, But NuancedIn my September 20th update titled “Bitcoin Has Appeared to Have Struck a Meaningful Top,” I noted that a top in the premier cryptocurrency was expected and likely imminent. Since that post, however, Bitcoin has reached a new all-time high, moving contrary to that prior expectation.
My interpretation of this updated price action is simple, but nuanced.
Simple in the sense that, since the September 20th update, price has only advanced in three waves, a hallmark of corrective, not impulsive , movement. Nuanced in the sense that, at times, corrective patterns can extend beyond prior highs and still maintain their corrective nature, as long as the internal structure remains a three-wave pattern.
Some may point out that the prevailing trend has appeared bullish since the June 25th low at $98,242. Yet, in my view, the August 13th high at $124,501.31 completed all the necessary wave components for a terminal structure. While it’s rare, retracements can exceed prior highs and still be valid as part of a corrective sequence, structure is what determines that validity, not price level alone.
That said, if Bitcoin does continue higher and makes an incremental new high, I will adopt my alternative count, which assumes the August 13th top was off by one degree and that the final fifth wave is only now completing.
While these distinctions may seem technical, they are crucial. If the recent rally represents an irregular B-wave correction, it leaves the door open for a C-wave decline potentially forming a flat structure or a retracement that falls short of the initial A-wave low. Conversely, should another marginal high occur first, it would still likely mark a major peak, only delaying the onset of the broader corrective phase.
In summary, absent a new incremental high, my expectation is for a C-wave decline targeting the low $109,000 region minimum , as the next major phase of Bitcoin’s correction.
BITCOIN making a bullish break-out similar to July'sBitcoin (BTCUSD) just broke above the Lower Highs trend-line of its August 14 All Time High (ATH). This was implemented after a bottom on the 5-month Higher Lows trend-line as well as the 1D RSI Support.
The last time all those conditions were fulfilled was on the July 02 Lower Highs break-out, after which BTC completed a +25.33% rally from the Low, almost touching its 1.786 Fibonacci extension.
Ahead of another 4H Golden Cross, just like then, we expect Bitcoin to make another +25.33% Bullish Leg and reach at least $136000 on the medium-term.
Do you think that's reasonable to expect within October? Feel free to let us know in the comments section below!
-------------------------------------------------------------------------------
** Please LIKE 👍, FOLLOW ✅, SHARE 🙌 and COMMENT ✍ if you enjoy this idea! Also share your ideas and charts in the comments section below! This is best way to keep it relevant, support us, keep the content here free and allow the idea to reach as many people as possible. **
-------------------------------------------------------------------------------
💸💸💸💸💸💸
👇 👇 👇 👇 👇 👇

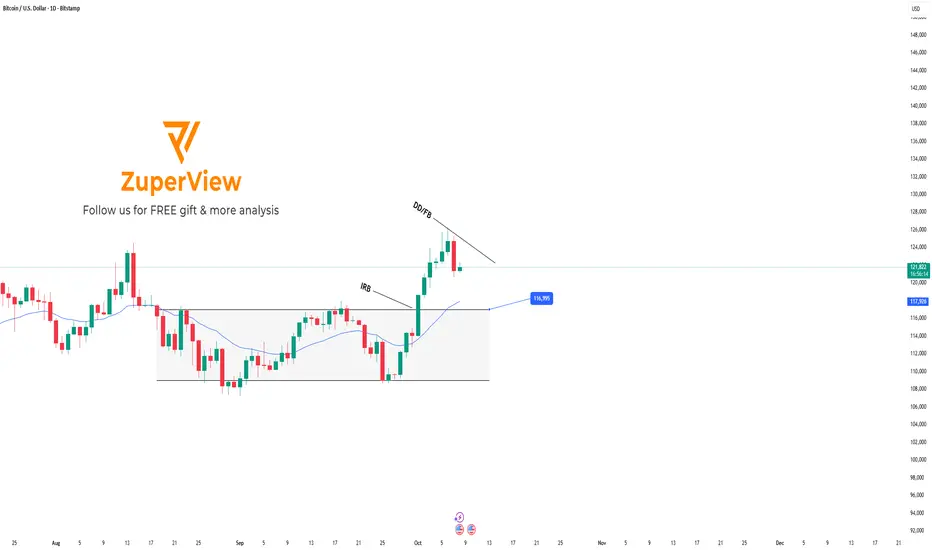
BTCUSD: Short term sell setup - Long term buy opportunity ahead
🔁 Review of Yesterday’s Plan
After BITSTAMP:BTCUSD rallied and set a new high at 126,190, the market entered a corrective phase.
In yesterday’s plan, we expected that:
Once the H1 candle closed below EMA, BTC could continue its decline and retest the lower support zone.
After touching support, price might pause briefly, then break lower to continue the downtrend.
Currently, BITSTAMP:BTCUSD has broken below and is consolidating sideways within a narrow range on H1, aligning perfectly with the anticipated correction scenario.
📈 Trading Plan for Today
On the H1 timeframe
Two key levels to watch for the Sell plan:
Resistance: 123,449
Support: 121,293
Scenario 1:
If price fails to break above EMA and keeps consolidating near 121,238While staying below EMA, → wait for a BB (Break Block) confirmation → Sell following the breakout signal.
Scenario 2:
If price retraces toward EMA and moves up to test 123,471→ wait for bearish confirmation around resistance to Sell from that level.
On the Daily timeframe
After the strong rally, BTC is now undergoing a technical correction.
The plan is to wait for price to pull back to retest the upper boundary of the previous range around 116,995, and Buy from that area.
Alternative setup:
If price reaches EMA sooner without testing the 116,995 zone,→ wait for BTC to accumulate momentum, then look for DD (Double Doji) / FB (First Breakout) pattern confirmation → Buy after signal confirmation.
🎯 Summary:
Short-term (H1): Bearish correction.
Mid-term (Daily): Bullish bias intact, waiting for confirmation near support.
Please like and comment below to support our traders. Your reactions motivate us to do more analysis in the future 🙏✨
Daniel Miller @ ZuperView
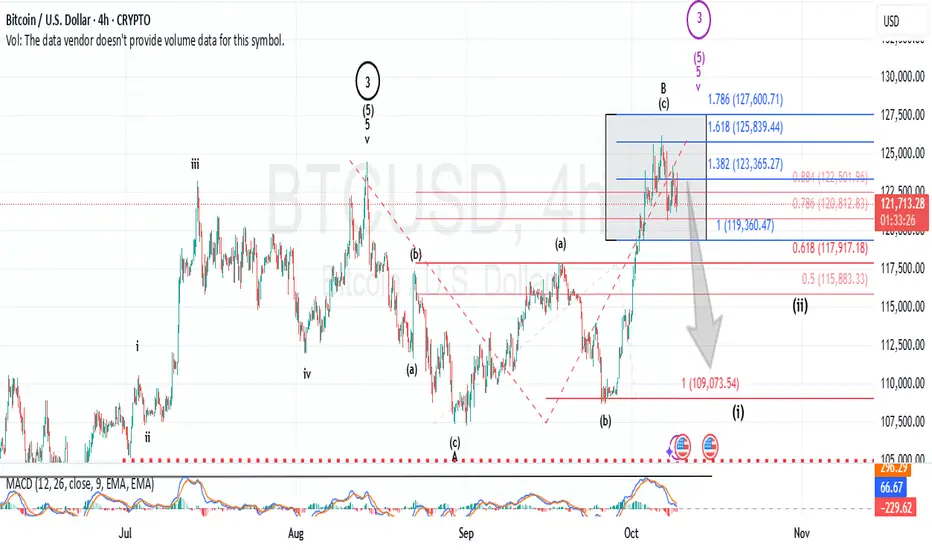
Where Is Bitcoin (BTCUSD) Headed After Record Highs?The short-term Elliott Wave analysis for Bitcoin (BTCUSD) indicates a five-wave impulse cycle unfolding from the September 1, 2025 low. Wave 1 reached $117,968, and wave 2 corrected to $108,739. Bitcoin then surged to a new all-time high, advancing in wave 3. Within wave 3, sub-wave ((i)) peaked at $109,995. Sub-wave ((ii)) pulled back to $108,676. The rally progressed, with sub-wave ((iii)) hitting $125,725. Sub-wave ((iv)) found support at $122,355, maintaining the bullish structure.
Sub-wave ((v)) is nearing completion, finalizing wave 3 on a higher degree. Following this, wave 4 should correct the rally from the September 25, 2025 low. The uptrend will likely resume in wave 5. As long as the pivot low at $108,676 from September 25 remains intact, dips should find support in a 3, 7, or 11 swing pattern. This support will facilitate further upside. After wave 4 concludes, traders can project the wave 5 target using the 123.6–161.8% inverse Fibonacci retracement of wave 4. This calculation will provide a precise target for Bitcoin’s next rally. The cryptocurrency’s price action reflects strong bullish momentum, suggesting continued growth in the near term.

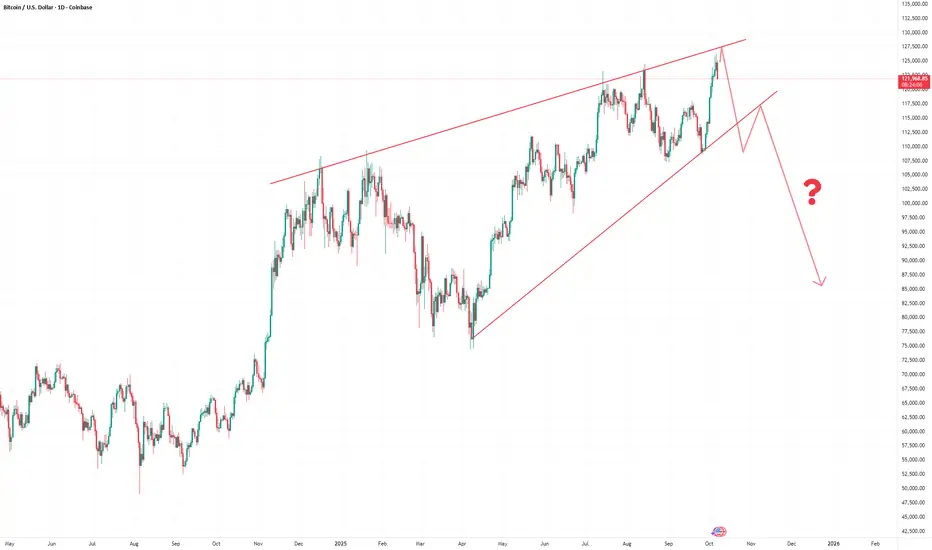
Despite ATH, Bitcoin is not looking solidCOINBASE:BTCUSD hit it's all time high above 126000 yesterday and yet, when you look at the structure of #BTCUSD, it doesn't inspire confidence. It looks like a huge rising wedge with bearish implications. And if this structure is going to play out then bitcoin is likely near it's top.
BTCUSD 1W chart review• Currently BTC is at ~ USD 123,000 (+1.97%).
• Strong support visible in the area of 113 400 USD and USD 106,800.
• The next resistance is USD 124,500, and the next important is USD 133,500.
2. Trend:
• You can see the growing trend line (orange), which supports increases.
• The weekly candle is green and quite strong - suggests that the demand persists.
3. Medium walking (SMA / EMA):
• SMA 50/200 shows the Golden Cross (EMA CROSS 50/200), which is a long -term bull signal.
• SMA (red) is below the price → pro-rectification signal.
4. RSI (Relative Strength Index):
• Currently approx. 60 → Neutral-BYCZECZE territory.
• Not bought yet (> 70), so there is space for further increases.
5. MacD / Histogram:
• The histogram begins to grow green - growth moment is growing.
• This confirms that the buyers are taking over the initiative.
⸻
📈 Scenarios:
1. Bull (greater likelihood at the moment)
• If BTC pierces and stays above USD 124,500, the goal may be USD 133,500.
• Breaking over 133K opens the road even to around 140k.
2. Bear
• If the price does not pierce 124.5k and reject the resistance, it may drop to $ 113,400.
• Punction below this zone will give a signal of declines up to USD 106,800.


BRIEFING Week #39 : The Turning Point is HereHere's your weekly update ! Brought to you each weekend with years of track-record history..
Don't forget to hit the like/follow button if you feel like this post deserves it ;)
That's the best way to support me and help pushing this content to other users.
Kindly,
Phil

todays set ups btc usd here are my trades for today currently in sell position to the 50/60 fib with ifvg and liquidity in the same area then looking for buys to take the all time hight one more time then looking for sells to wipe out some money

BTC/USD Rejection at 124K – Bears Drive Price to 121.7KHello Followers, I am going to share you my opinion on BTCUSD next move..
BTCUSD is facing a strong resistance area around 124000/124400. This is a very strong resistance area so there are high possibilities that BTCUSD will fall and according to my analysis it will fall around 121700. BTCUSD can fall around the next support area that is around 121700..
KEYPOINTS:
Entry-level 124000
Target 121700
Stop loss 125000

BTCUSD Another Bullish Flag & Retest of a Demand Zone | NEW ATHsLooks like the bull run has only just begun.
Bullish confirmations upon bullish confirmations.
This particular setup for another impulse will only become invalidated when or if the demand zone is violated.
Ride the trend.

BITCOIN Bullish Bias! Buy!
Hello,Traders!
BITCOIN is testing the upper boundary of a key order cluster, hinting at possible bullish expansion. A confirmed break above could open the way for continuation toward the 126,000$ target zone. Time Frame 8H.
Buy!
Comment and subscribe to help us grow!
Check out other forecasts below too!
Disclosure: I am part of Trade Nation's Influencer program and receive a monthly fee for using their TradingView charts in my analysis.
