ANFIBO | BTCUSD – Weekly Trading Plan [10.6 - 10.12.2025]Anfibo's here!
BTCUSD – Detailed Market Analysis & Outlook
It was great to see BITSTAMP:BTCUSD react strongly as I predicted last week, and I was absolutely right, BTC rallied from the $109,000 support to over $125,000 and set a new ATH. This strong move generated a profit of around $16,000 per BTC, reflecting the strength of the current bull cycle and the resilience of market demand. My family will definitely have a wonderful vacation thanks to that plan.
Market Outlook for the Week
Looking ahead, I anticipate the market may lean toward a period of healthy correction. Specifically, BTC could extend toward the $128,000 – $130,000 region before retracing to the nearest support zone between $118,000 and $116,000. Such a pullback would be constructive, allowing the market to reset before establishing a clearer direction or consolidating in a sideways range while awaiting new catalysts or macroeconomic developments.
Technical Perspective
On the H4 timeframe, BTC remains firmly within its ascending price channel, with no immediate signs of trend reversal. Momentum continues to favor the bulls, and as long as BTC maintains structure above key supports, the broader uptrend remains intact.
>>> SELL ZONE:
ENTRY: 128 - 130 (X1000)
SL: 132
TP: 118 - 116
>>> BUY ZONE:
(1) ENTRY: 117 - 118 (x1000)
SL: 115.8
TP: 123 - 128 - ATH
(2) ENRTY: 112.5 - 114 (x1000)
SL: 111
TP: 118 - 123 - 128 - ATH
Conclusion
BTC has successfully confirmed strength from the $109k base, pushing into new highs. While short-term corrections toward $118k–$116k would be considered healthy, the overall technical framework continues to support the bullish trajectory. Traders and investors alike should monitor key levels closely, maintaining flexibility while aligning with the prevailing trend.
WISH EVERYONE A PROFITABLE NEW WEEK!
BTCUSD.P trade ideas

BTCUSD: Short still in play, eyes on 117K support📊 BITSTAMP:BTCUSD Analysis – October 9, 2025
🔁 Review of Yesterday’s Plan
As projected in yesterday’s plan (Oct 8), after BITSTAMP:BTCUSD broke above the EMA and moved toward the upper resistance zone, our Sell entry at 123,449 was triggered.
Price then dropped sharply, following the expected scenario perfectly.
🎯 Objective for Today
The focus for today is trade management on the current open position.
The active trade is now approaching a profit range of 2R – 3R.
We expect BITSTAMP:BTCUSD to continue declining toward 117,000 – 116,000,
→ which is also the key support area to look for potential Buy setups,
according to the Daily plan mentioned in yesterday’s analysis.
✅ Trading Plan for Today
Maintain the current Sell position, monitoring price action near 117,000 – 116,000.
Once price reaches this zone, watch for confirmation signals (DD/FB or strong volume reaction) to prepare for a Buy setup aligned with the main trend.
Avoid new entries between current levels — focus on managing the running trade and waiting for key zone reactions.
🎯 Summary:
The Sell setup worked precisely as planned, now yielding solid profits.
Next focus: monitor 117,000 – 116,000 for a potential Buy opportunity aligned with the higher timeframe structure.
You can refer to my previous analysis here:
Please like and comment below to support our traders. Your reactions motivate us to do more analysis in the future 🙏✨
Daniel Miller @ ZuperView

Bitcoin At All-Time-High... And ResistanceBitcoin looks bullish on high time frames. We have a weekly close right at resistance, so we want to see some follow through.
Remember, it make a new all time high on a weekend, so we really want to see a sustained push. We are at the range highs, which means at resistance as well.

SELL BTC TO 75k*I am in no way a financial advisor and you should always do your own due diligence before placing any trade. Do not trade what you are not comfortable with losing. No trade is guaranteed.
Sell with stop loss above structure , Take profit at 78,000

$BTC / $GOLDCRYPTOCAP:BTC / TVC:GOLD 🔃
2013 | 1 Btc = 1 Gold
2017 | 1 Btc = 16 Gold
2021 | 1 Btc = 37 Gold
2025 | 1 Btc = 31 Gold \ More is coming
In December 2024, 1 Bitcoin was worth 41 gold, but there was no monthly close above the 2021 ATH level.

BTC at a Critical Juncture Bulls Defending major zoneBitcoin has converted a key supply zone into a strong demand zone. All eyes are now on this critical level as price action tests this make-or-break support.
BTC is holding above the key demand zone at $106,269 - $108,715. This is the bull market's defensive line. A strong bounce here keeps the primary uptrend intact, with eyes first on $124,517 and ultimately the $135,627 - $139,616 target zone.
However, the recent rejection from the $117k supply zone shows sellers are present. A decisive break below this demand support would signal weakness, likely triggering a move down toward $98,384.
The next major leg will be decided at the current zone.
Bulls need to hold this ground to fuel the next rally toward $140K.
Are you buying the dip in this zone, or waiting for a breakdown to confirm a deeper correction?
Drop your prediction in the comments "Bullish bounce or bearish breakdown"?

BTC/USD (4H timeframe).BTC/USD (4H timeframe) with Ichimoku + support/resistance + trendline.
Currently price is around $113,958.
Based on My chart:
Price broke up from the Ichimoku cloud and is retesting above the $113,000 – $114,000 support zone.
The blue arrow I drew points towards the next resistance.
The target area shown on my chart is around $118,000.
📌 Short-term target:
First resistance near $115,500 – $116,000.
If broken, then the main target zone is $118,000.
📌 Support levels:
Strong support at $113,000.
If that breaks, next support is $112,200 – $112,000.
👉 So my next upside target = $118,000 (as shown in your chart).

BTCUSDBTCUSD needs correction and further upside to break the ATH again.
Disclosure: We are part of Trade Nation's Influencer program and receive a monthly fee for using their TradingView charts in our analysis.

BTCUSDBTCUSD
- Break of Structure
- Fair Value Gap
- Double Bottom as an corrective pattern in Short Time Frame
- Resistance Level
- Order Block

Bitcoin (BTCUSD): Bearish Short SetupHello everyone, Kilian here.
Let’s take a closer look at BTCUSD with a logical and structured approach.
Currently, the market is showing a classic bearish formation. The price has broken through a key support level and the first signs of dominant short-side pressure are already visible. This is not just noise but a signal that short positions are gaining control.
After the breakdown, the market is pulling back to retest the broken area. In technical analysis, such a retest often confirms that the bearish momentum is intact and that short traders remain in charge.
Given this context, it is unlikely that BTCUSD will recover the old support, which now acts as resistance. A rejection from this level could trigger the next short-driven move, with a projected target around 118,200.
Unless a strong reversal emerges, the probability remains in favor of continued downside pressure.
Stay disciplined, follow the signals carefully, and remember that in trading, logic and risk management always outperform emotions.

BTC - Thought experiment The red vertical lines indicate 24hr periods.
I'm visualizing order flow & liquidity at these levels of interest with the risk and take profit target perspectives for different types of traders.
I've added fib levels to help target the upside highs and see the correlation between then lower fib levels and my 4 candles I look for which create 6 types of levels. I mark all 6 levels, usually just the greediest ones that minimize risk or which are telling the strongest story.
Lets see if this tug of war gives us a good chart replay in few days.

ETH ShortAs always these are leveraged trades so if direction changes on the 4hr look to exit. Another SFP Setting up on 12HR. Just like BTC most likely we take previous lows on 12 hour before the real breakout.

This month Will Define This Entire Crypto Cycle🎯 October Just Started — And It Might Define This Entire Crypto Cycle 📈
Happy October, everyone — a month with a powerful pattern.
If history repeats, this could be a defining moment:
2017 saw a 5x BTC rally in 60 days,
2021 delivered a 2.5x in just 45 days.
Now it’s 2025 , and we’re watching the charts line up once again. 🔁
We’ve been long Bitcoin since two days ago, right off the support at the bottom of the channel — a level we’ve tracked since March 14, 2023 .
That same chart gave us:
42K (hit summer 2023)
46K (initial rejection, later support)
And now, we’re targeting 127,370 → 138K–140K as part of the final macro wave. 🚀
Ethereum is showing strength too. From a solid buy zone near 4,000 , I still believe the next key levels are 6,443 and 10,364 .
Altcoins? Let’s talk dominance:
Bitcoin Dominance is still high (~58%) but could drop toward 56.91 — giving room for alts to breathe.
Ethereum Dominance remains in a clear descending channel, with a clean target of 18.29% dominance.
📊 We’ve revisited Ethereum vs. BTC charts, and I remain long ETH here with a 0.06 BTC target.
Other setups:
Solana support at 204.81 , targets 240 and 276 .
XRP ? I remain cautious — still preferring ETH over XRP based on recent cycles.
Total Market Cap still shows bullish structure, aiming for 4.8T and later 6.5T .
We’ve seen the October pattern repeat across cycles. While the exact altcoin winners change (XLM & XRP in 2017, ETH in 2021), the macro truth remains:
Bitcoin tends to lead — and October tends to explode.🔥
Thought of the Day 💡
“Cycles evolve, but the rhythm remains. Each October is a chance — not a promise. But charts give us a map, and right now, the map points up.”
Disclaimer
I share market views for educational and entertainment purposes only. This is not financial advice. I am not a licensed advisor. Trade at your own risk and always manage your capital responsibly.
One Love,
The FXPROFESSOR 💙
ps. it's a video..watch it and let me know your thoughts

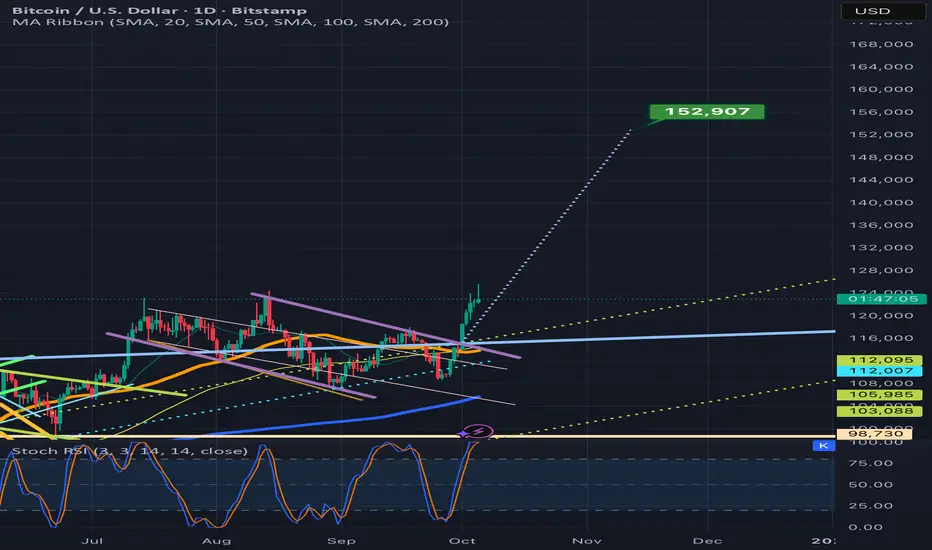
BTC just achieved a new all time high on its way to 153kFeels like it may be validating the breakout above the blue line as it also seems to be climbing up the dotted measured move line here on the last few candles. So probability is quite good that we validate the breakout on this impulse. If so the full measured move target is around 152.9k or more or less 153k. *not financial advice*
BTC - LONG SET-UP BITSTAMP:BTCUSD
119.5k Strong Support as of now
BTC Long Set-up 📈
EntrY Between 112.6k - 114.8k
SL below 110.8k
Target above 119k
Lev & Margin as per your risk capacity

the market has shifted above the comfort zone of this forecastit's been a good run of accurate forecasts, this may be the first one that doesn't work out
this could be due to the higher timeframe trying to pull the market up...I'll take another look at it in a few hours
sometimes BTC does some silly things, then jumps back into form. thus I'm going to let this play out before updating pushing out another forecast

BITCOIN Is Bullish! Long!
Take a look at our analysis for BITCOIN.
Time Frame: 1h
Current Trend: Bullish
Sentiment: Oversold (based on 7-period RSI)
Forecast: Bullish
The market is approaching a key horizontal level 123,044.94.
Considering the today's price action, probabilities will be high to see a movement to 125,510.67.
P.S
Overbought describes a period of time where there has been a significant and consistent upward move in price over a period of time without much pullback.
Like and subscribe and comment my ideas if you enjoy them!

Bitcoin analysisAfter the strong support we identified earlier — which we expected to hold — Bitcoin managed to climb to 125,000. Currently, the price is in a correction phase. If it reaches the 121,500 support and fails to hold there, we can expect a deeper correction toward the 118,000 zone. However, if it finds support at that level, we can anticipate a stronger upward move.
Also, keep in mind that with the Forex market opening tomorrow, higher volume will enter the market, and we may see completely different price behavior. ✅

BTCUSD – Gold Analysis & Trading Plan | Oct 09, 20251️⃣ Trendline (Main Trend)
- BTC remains in a downtrend on H1, confirmed by the descending trendline connecting lower highs.
-- Every retest of the trendline triggers strong selling pressure, showing that bears are still in control.
2️⃣ Key Zones
- CW POC (123,687) acts as a major resistance zone, confluencing with the descending trendline – a high-probability short continuation area.
- CW VAL (121,300–121,500) serves as short-term support; if it breaks, the next targets will be 121,000 – 119,500.
3️⃣ Price Behavior
- After pulling back to POC, BTC formed a series of rejection candles with decreasing volume near the trendline – indicating weak buying momentum.
- The price was rejected from the supply zone and quickly returned to retest VAL – signaling a continuation of bearish structure.
4️⃣ Candlestick Pattern
- A Bearish Engulfing formed near the trendline + POC resistance, strengthening the bearish bias.
- Small pin bars appear near VAL but lack bullish confirmation; wait for a confirmed close above 121,800 before considering a short-term buy.
5️⃣ Entry Setup
- Primary Setup: Short around 123,500–123,700 (trendline + POC), stop loss above 124,200, targets at 121,000 and 119,500.
- Alternative Setup: If the 121,000–121,300 support holds and a bullish candle confirms, consider a short-term buy targeting 122,500–123,000.
👉 If you find this analysis useful, don’t forget to hit like 👍 and drop a comment 💬 to support us in delivering even better insights!

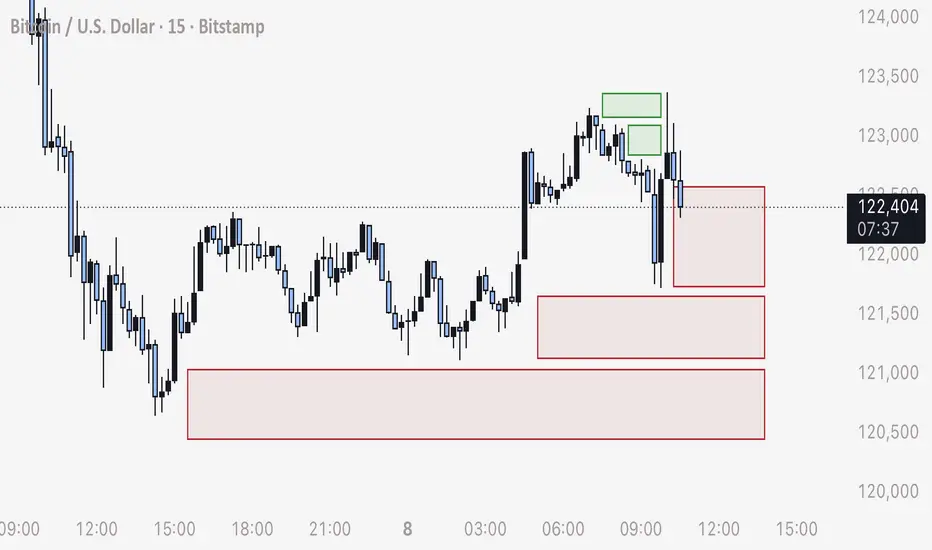
BTC - Practical Example of Trading Order Blocks / Stop HuntsHere is a very practical, recent example of trading the reaction of BTC hitting stop loss order blocks and how price moves.
Green Boxes:
- Note that price moves in a slow, downwards consolidation
- This slow drop allowed time for traders to enter shorts, consequently leaving stop loss orders for the entire position size
- The price movement when these cascading blocks of orders are triggered always moves exponentially faster than the consolidation. Slower the move in a direction = faster the wick in the opposite direction. More orders ( buys or sells ) equals greater speed and distance.
- These orders being triggered (stop losses and liquidations) trump any pattern, support or resistance. It all becomes irrelevant as the order chains will always execute and set off, ignoring any technical pattern.
Predicting this Wick to 123,300:
- Notice the downwards consolidation followed by a faster drop in the end.
- Price quickly moved higher
- From this point we can anticipate that the high leverage stop loss orders for shorts will be triggered, at this point you can scalp a long, take profit slightly above where the consolidation started.
Red Boxes:
- The red boxes are sell orders created from long positions being opened and consequently their stop loss and liquidation orders
- Mark and extend boxes from the open zones that price has not reclaimed
- When price moves down low enough, to start filling these sell orders, you may short to slightly below the beginning of the upwards consolidation
- I’d anticipate when price moves below 122,200, that’s when the wick will form and land at a minimum of 120,100 (if not setting off more sell orders as we look at higher time frames than the 15 M)
- Looking at the slowness and time allowed for the upwards consolidation, we can anticipate a larger amount of longs have been opened, and this can be translated to an increased speed of a wick down and faster movement.
In Summary:
I hope this serves you as a good, practical example of the method of trading stop losses hunts and order blocks, which in my experience is the only reliable way to predict the price of Bitcoin.
Yours truly,
- DD
BTCUSD H4 | Potential Bullish Continuation SetupBitcoin (BTC/USD) is falling towards the buy entry at 118,647.96, which is a pullback support that is slightly above the 50% Fibonacci retracement and could bounce from this leve lto the upside.
Stop loss is at 114,705.13, which is a pullback support that lines up with the 61.8% Fibonacci retracement.
Take profit is at 125,444.07, which is a swing high resistance.
High Risk Investment Warning
Trading Forex/CFDs on margin carries a high level of risk and may not be suitable for all investors. Leverage can work against you.
Stratos Markets Limited (tradu.com ):
CFDs are complex instruments and come with a high risk of losing money rapidly due to leverage. 65% of retail investor accounts lose money when trading CFDs with this provider. You should consider whether you understand how CFDs work and whether you can afford to take the high risk of losing your money.
Stratos Europe Ltd (tradu.com ):
CFDs are complex instruments and come with a high risk of losing money rapidly due to leverage. 66% of retail investor accounts lose money when trading CFDs with this provider. You should consider whether you understand how CFDs work and whether you can afford to take the high risk of losing your money.
Stratos Global LLC (tradu.com ):
Losses can exceed deposits.
Please be advised that the information presented on TradingView is provided to Tradu (‘Company’, ‘we’) by a third-party provider (‘TFA Global Pte Ltd’). Please be reminded that you are solely responsible for the trading decisions on your account. There is a very high degree of risk involved in trading. Any information and/or content is intended entirely for research, educational and informational purposes only and does not constitute investment or consultation advice or investment strategy. The information is not tailored to the investment needs of any specific person and therefore does not involve a consideration of any of the investment objectives, financial situation or needs of any viewer that may receive it. Kindly also note that past performance is not a reliable indicator of future results. Actual results may differ materially from those anticipated in forward-looking or past performance statements. We assume no liability as to the accuracy or completeness of any of the information and/or content provided herein and the Company cannot be held responsible for any omission, mistake nor for any loss or damage including without limitation to any loss of profit which may arise from reliance on any information supplied by TFA Global Pte Ltd.
The speaker(s) is neither an employee, agent nor representative of Tradu and is therefore acting independently. The opinions given are their own, constitute general market commentary, and do not constitute the opinion or advice of Tradu or any form of personal or investment advice. Tradu neither endorses nor guarantees offerings of third-party speakers, nor is Tradu responsible for the content, veracity or opinions of third-party speakers, presenters or participants.

BTCUSD Currently in an H4 Demand Zone. NEW ATHs LOADING!Until I see very convincing signs of a reversal, I remain bullish in this market.
Price has currently retested a demand zone on the H4 TF and I will be using this zone to validate my longs to New ATHs.

btc rising trendThe trend is your friend with Bitcoin.
CRYPTOCAP:BTC continues to accumulate in the main uptrend before the next upward movement.
