BTCUSD – Benefitting from Being AlternativeBTCUSD broke above 120000 for the first time since mid-August on Sunday, briefly recorded a new all-time high of 126304 yesterday before edging back lower and consolidating its gains so far this morning (124100, 0730 BST).
This move to new highs has been relatively constant by recent BTCUSD standards. Prices were languishing at 3-month lows around 10800 on September 26th, but since then it has recorded 10 out of 12 up days, led higher by increased expectations for Federal Reserve interest rate cuts at their next meetings in October and December, alongside a shift by investors into alternative assets to diversify away from major currencies like the US Dollar (USD), UK Pound (GBP), Japanese Yen (JPY) and Euro (EUR) as concerns increase about the sustainability of government debt burdens, fuelled by the spending requirements of those in power.
These issues have been highlighted recently by the US government shutdown, choice of pro spending candidate Sanae Takaichi as Japan’s new prime minister, on-going issues surrounding UK Chancellor Reeves Autumn budget plans and the resignation yesterday of new French Prime Minister Lecornu after only 27 days in office as the country struggles to get its finances in order.
Looking forward, whether BTCUSD prices can sustain a move to higher record levels or instead see a correction back to the downside may be determined by factors such as risk sentiment remaining positive, alongside the ability of the technical outlook to remain constructive, 2 factors that can change quickly in the current environment.
Technical Update: New All Time Highs
Between the September 26th low and the October 6th high, Bitcoin rallied 16.27% in a near-uninterrupted stretch of price strength, culminating in a new all-time high of 126304 on Monday.
As the chart above shows, despite a correction from the latest 126304 high, fresh attempts to extend the advance could remain on the cards. Momentum still appears tilted toward further attempts to move higher.
However, breaks into new all-time high territory don’t guarantee a sustained advance. It’s therefore prudent to monitor key support and resistance levels to help gauge where the next directional risks may emerge. These levels can offer clues on whether momentum is likely to continue or fade.
Possible Resistance Levels:
Sellers have emerged at the 126304 level, and this area now looks set to act as the initial resistance. Traders will likely monitor how price behaves around 126304, particularly on a closing basis, if retested this week.
When price breaks into new all-time high territory, identifying valid resistance becomes challenging. However, Fibonacci extension levels can offer useful reference points.
If Bitcoin sees a closing break above 126304, attention may shift toward 131090, the 38.2% extension of the September 26th to October 2nd rally, even potentially 135145, the higher 61.8% level.
Possible Support Levels:
As already noted, Bitcoin has seen an almost uninterrupted phase of strength since the September 26th low, which may now prompt concerns about price over-extension. Some traders may begin to assess the risk of corrective pullbacks from these elevated levels.
However, for corrective themes to gain traction, it may require a closing break below the recent 121525 low (October 4th), which marked the last rally point for price. While breaks below this support are not an outright negative move, such activity could open the way for tests of 119557, which is the 38.2% Fibonacci retracement of the latest advance, possibly 117471, the deeper 50% level.
The material provided here has not been prepared accordance with legal requirements designed to promote the independence of investment research and as such is considered to be a marketing communication. Whilst it is not subject to any prohibition on dealing ahead of the dissemination of investment research, we will not seek to take any advantage before providing it to our clients.
Pepperstone doesn’t represent that the material provided here is accurate, current or complete, and therefore shouldn’t be relied upon as such. The information, whether from a third party or not, isn’t to be considered as a recommendation; or an offer to buy or sell; or the solicitation of an offer to buy or sell any security, financial product or instrument; or to participate in any particular trading strategy. It does not take into account readers’ financial situation or investment objectives. We advise any readers of this content to seek their own advice. Without the approval of Pepperstone, reproduction or redistribution of this information isn’t permitted.
BTCUSD.P trade ideas


BTCUSD: Market of Sellers
The analysis of the BTCUSD chart clearly shows us that the pair is finally about to tank due to the rising pressure from the sellers.
Disclosure: I am part of Trade Nation's Influencer program and receive a monthly fee for using their TradingView charts in my analysis.
❤️ Please, support our work with like & comment! ❤️

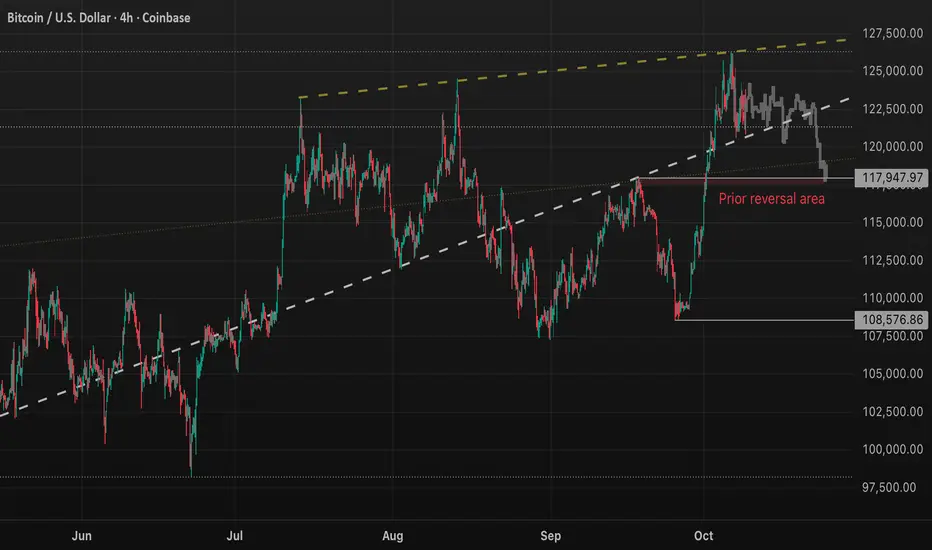
Could we see another July-type ATH-reversal play out?Current post-ATH price action has been bearish. Though we have entered another area of low volatility.
I cloned then reduced the volatility of the July ATH-reversal by fitting to the most recent ATH-reversal price action. The reversal low is set to an area ~117k that has prior been an area of resistance/support and trend reversal.
Gold Showed the Way... Is Bitcoin Next?Gold began a parabolic run after breaking through the Fibonacci 1.382 – 1.414 zone.
Now Bitcoin is gathering strength at the same threshold...
Historical similarity in setup
Gold broke through and became parabolic.
Next up Bitcoin
History often maps out the future.
Bitcoin, the “digital gold,” is preparing for its own run.
CRYPTOCAP:BTC Vs. TVC:GOLD 🔃

Bearish Gartley Potential on BTCTarget is around ~120,800 for the 0.786 retrace.
- 4hr RSI showing extreme levels
- Currently meets all criteria for a Bearish Gartley pattern

BITCOIN Did the 1W MA20 just save the day??On one of our recent analyses we talked about the importance of the 1W MA20 (red trend-line) for Bitcoin (BTCUSD) and the continuation of its non-stop bullish trend since the April 07 2025 Low.
As mentioned then, BTC was likely to extend the trend as long as the 1W candles keep closing above the 1W MA20. The three times a candle didn't, since June 2023, the price declined more to hit (or come very close to) the 1W MA50 (blue trend-line).
Last week was again a successful 1W candle close above the 1W MA50, third time in a month (since August 25) to do so. Technically that solidifies it as a Support and as long as it holds, Bitcoin has more probabilities to repeat at least a +96.38% rally ('weakest' rally it had on this Bull Cycle) and test $145000.
So do you think the 1W MA50 just saved the day and a new rally is ahead of us? Feel free to let us know in the comments section below!
-------------------------------------------------------------------------------
** Please LIKE 👍, FOLLOW ✅, SHARE 🙌 and COMMENT ✍ if you enjoy this idea! Also share your ideas and charts in the comments section below! This is best way to keep it relevant, support us, keep the content here free and allow the idea to reach as many people as possible. **
-------------------------------------------------------------------------------
💸💸💸💸💸💸
👇 👇 👇 👇 👇 👇

BTC CORRECTIONPreferably suitable for scalping and accurate as long as you watch carefully the price action with the drawn areas.
With your likes and comments, you give me enough energy to provide the best analysis on an ongoing basis.
And if you needed any analysis that was not on the page, you can ask me with a comment or a personal message.
Enjoy Trading ;)

BTCUSD NEXT POSSIBLE MOVE BTC is currently holding strong above key support zones, showing bullish momentum building up. If the market continues to respect this structure, a possible upward move can be expected. A breakout above the resistance could trigger fresh buying pressure, opening the way for higher levels. Overall, price action is suggesting that buyers are still in control, and any sustained strength could lead BTC toward new highs in the coming sessions.

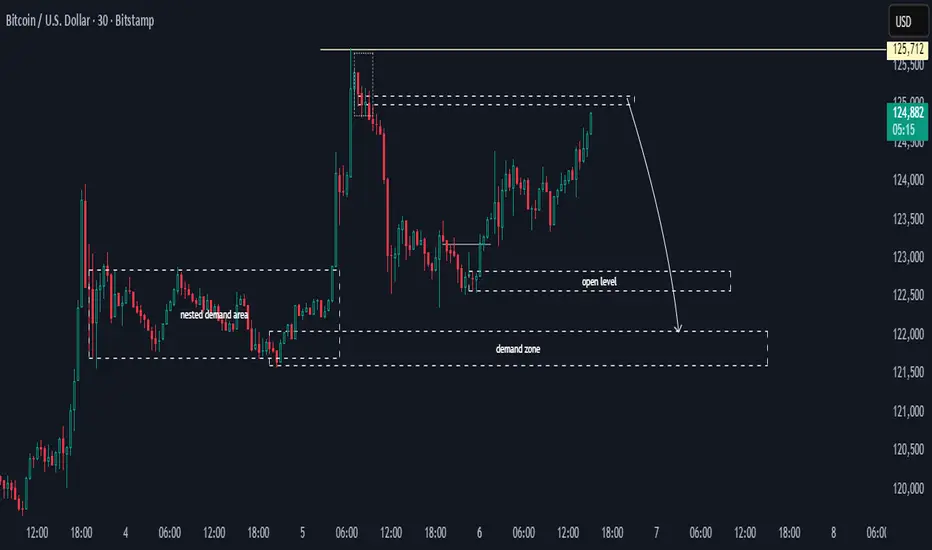
BTCUSD Flow Map, Potentially BearishHi,
BTCUSD on the M30 chart has the potential to pulse up and then fall. Potential bearish areas are around 12,300 and down to the demand zone at 12,085. Caution is required due to strong volatility to the upside.
Happy Trading,
K.
_
Not trading advice

Possible long Market bullish from a higher time frame, and here, an order is blocked after supported by hourly structure. This indicate momentum possibility to the upside than the down side in an attempt to fullfil that 4h promise.

BTCUSD 30m – Bullish Continuation ExpectedBITSTAMP:BTCUSD
Structure | Trend | Key Reaction Zones
Price formed a strong base at 120,800, bouncing from the demand zone.
Accumulation structure confirmed, with multiple liquidity grabs before breaking the descending trendline.
Currently retesting breakout — bullish continuation likely if price holds above 123,200.
Market Overview
BTC has successfully broken out from a short-term bearish channel after sweeping liquidity from the lower side. The demand zone between 120,800–121,200 provided a solid foundation for buyers, signaling fresh momentum. Now retesting the broken trendline, and if held, we could see a continuation toward the upper supply zone.
Key Scenarios
✅ Bullish Case 🚀 → Bounce from 123,200 → 🎯 Target 124,500 → 🎯 Target 125,700 → 🎯 Target 126,200
❌ Bearish Case 📉 → Break below 122,000 → 🎯 Target 121,000 → 🎯 Target 120,000
Current Levels to Watch
Resistance 🔴: 124,500 / 125,700
Support 🟢: 123,200 / 121,800
⚠️ Disclaimer: This analysis is for educational purposes only. Not financial advice.

BTCUSD H1 – Buy Setup Activation After Liquidity GrabContext: BTCUSD on H1.
Structure:
There’s a CHoCH (Change of Character) marking the start of a potential bullish shift.
Then a BOS (Break of Structure) confirms a higher high.
Below the local low, we see a Liquidity zone, where stop-loss orders from buyers are likely resting.
Setup idea:
The BUY should only be activated if price sweeps the marked liquidity (a spike below the “Liquidity” zone).
This move would “grab” retail stops and confirm smart money accumulation.
After liquidity is taken and the price shows a strong bullish reaction (long wick or bullish candle close), the BUY entry becomes valid.
Risk/Reward:
Stop Loss goes below the liquidity zone (~121,400).
Take Profit is set around ~126,246, giving a solid R:R (4.22).
📌 Conclusion:
Entry is not immediate — it only happens after liquidity is taken.
If the market never sweeps liquidity, the setup remains invalid.
The best confirmation is a strong bullish candle right after the liquidity grab.

BTCUSDThis might be one of the crazy swing setup I have this year. LOL
Very Low probability so manage risk!
Also stay updated to know how I go about the trade whether I'll hold till TP/SL or whether I'll close prematurely. Price Action rules.
I'll drop a ltf setup when I spot one

BTCUSD - Sell Limit Set Up 123,970Bitcoin had just rejected higher price. It is likely that BTC is not ready for another daily higher high yet. Let's short it for a potential head-and-shoulders or a 1:1 TP-SL

$btc update$Zero DD from last post. $$$
Super handle here for CRYPTOCAP:BTC ….
$122,420…
Holds enough to drive us straight into TP with a high end potential of $131,200.
Currently looking to scale in @ $121,320 & layering very lightly on the given dashed lines!
I really can’t see this back below $120k BEFORE targets come through?! So allow closures to let you know if it’s good or not!
If so….. she’ll be nose diving $113k.
Lets See!!! 🫶🏽

$BTC Possible Top & Possible ManipulationCRYPTOCAP:BTC Possible Top & Possible Manipulation
This upside movement can be a manipulation part and then distribution.
we need confirmation for this scenario!

Possible BTC setupHigh risk simple OB set up, tight SL as still wants to push.
Trigger for entry valid bearish OB and selling pressure, targeting the area to fill Fvg and bullish OB 1:10 RR, using 25% of normal risk.
Due to high risk set up, will layer remaining entries if see reaction

BTCUSD 4H – Preparing for a Breakout 🚀 BITSTAMP:BTCUSD
Market Overview
BTC is consolidating just under the key breakout zone, showing signs of strength after rebounding from demand. A clean breakout and retest above 123.9K could trigger a sharp move toward 125.6K, with extended targets at 126.2K–127.4K, where psychological resistance awaits.
Key Scenarios
✅ Bullish Case 🚀 → 🎯 Target 1: 125.6K | 🎯 Target 2: 126.2K | 🎯 Target 3: 127.4K
❌ Bearish Case 📉 → If BTC loses 122K support, expect correction back toward 120.8K.
Current Levels to Watch
Resistance 🔴: 123.9K – 125.6K
Support 🟢: 121.8K – 122.2K
⚠️ Disclaimer: This analysis is for educational purposes only. Not financial advice.

BTCUSDPreferably suitable for scalping and accurate as long as you watch carefully the price action with the drawn areas.
With your likes and comments, you give me enough energy to provide the best analysis on an ongoing basis.
And if you needed any analysis that was not on the page, you can ask me with a comment or a personal message.
Enjoy Trading ;)

Bitcoin's Bullish Momentum ContinuesBitcoin is showing strong Bullish signs on various timeframes. We have taken just a 1:1 Bullish Trade here. Let's see how it goes.

BTC/USD Trade with Support & Resistance | Double Top BTC/USD Daily Chart Analysis | Sell Signal Active
Today’s Bitcoin analysis shows a short position setup after forming a possible Double Top near 124,510 – 126,246 resistance.
The daily candle has confirmed a Bearish Engulfing pattern, signaling potential downside momentum.
🧠 Trading Idea:
Current price action suggests sellers are gaining control. If BTC breaks below 107,658, it could trigger a deeper drop toward 107K and possibly lower in the coming days.
🎯 Key Levels:
Resistance: 124,510 – 126,246
Support: 107,658
Target: 107,658 and below
⚠️ Note: This is a technical analysis for educational purposes — not financial advice. Always manage risk before entering trades.
#BTCUSD #BitcoinAnalysis #CryptoTrading #BearishEngulfing #DoubleTop #BitcoinPricePrediction #BTC #CryptoChart #DayTrading
