BTC/USD - Long from Support ZoneEntry zone: $107,100 – $107,700
Stop: 1H close below $106,000
(Alternative, safer stop: $104,500, but with lower R/R)
Bitcoin is testing a key short-term support zone.
If buyers hold this area, a local bounce from current levels is likely.
Clear invalidation comes only with a 1H close below $106,000.
⚠ Disclaimer:
This idea is for educational purposes only and not financial advice.
Do not follow this trade.
If you’ve already made that mistake — manage your risk and apply solid money management.
Trade ideas

BITCOIN BREAKOUT IS COMING.Bitcoin just did a massive flip, breaking above the $111k minor resistance level and reaching the $114k in the past 24hrs.
✴️ But there is something we need to understand with this move. Looking at the price action of Bitcoin, it shows that we are still in a down trend and there is a possibility for price to continue dropping.
📌 For the price of Bitcoin to continue its upward movement, we need to see a strong closure above the descending trend line before we can confirm a continuation.
At the moment, we should see price drop back the 110k to 108k or below, taking out the early buyer before going upward.
💡KEY PRICE LEVELS TO WATCH OUT FOR IN THE MARKET.
1️⃣ SUPPORT LEVELS : $110500 to $108750
2️⃣ RESISTANCE LEVELS: $114000, $116000 and $122000 to $125000k.
⛔️THIS IS NOT A FINANCIAL ADVICE DYOR.
🙏 FOLLOW ME FOR MORE MARKET UPDATES.

Bullish rise?Bitcoin (BTC/USD) is reacting off the pivot and could bounce to the pullback resistance.
Pivot: 109,846.88
1st Support: 104,701.40
1st Resistance: 115,813.42
Disclaimer:
The above opinions given constitute general market commentary, and do not constitute the opinion or advice of IC Markets or any form of personal or investment advice.
Any opinions, news, research, analyses, prices, other information, or links to third-party sites contained on this website are provided on an "as-is" basis, are intended only to be informative, is not an advice nor a recommendation, nor research, or a record of our trading prices, or an offer of, or solicitation for a transaction in any financial instrument and thus should not be treated as such. The information provided does not involve any specific investment objectives, financial situation and needs of any specific person who may receive it. Please be aware, that past performance is not a reliable indicator of future performance and/or results. Past Performance or Forward-looking scenarios based upon the reasonable beliefs of the third-party provider are not a guarantee of future performance. Actual results may differ materially from those anticipated in forward-looking or past performance statements. IC Markets makes no representation or warranty and assumes no liability as to the accuracy or completeness of the information provided, nor any loss arising from any investment based on a recommendation, forecast or any information supplied by any third-party.

Retest Toward Demand Zone Before Next Rally?Description
Market Context
Bitcoin is showing a textbook Supply-to-Demand rotation on the 1-Day chart . After facing rejection from the upper Supply Zone , price is now compressing beneath a key resistance — hinting at a possible retest toward the Demand Zone before the next impulsive leg.
Technical Breakdown
Supply Zone Rejection:
Price sharply rejected from $122,000 – $125,000 , confirming strong institutional selling pressure.
Sell Area / Flip Zone:
Currently consolidating below the $116,000 – $118,000 range — a key resistance that could trigger the next leg down if defended by sellers.
Downside Target:
Potential move toward the Demand Zone ($101,000 – $103,000) , a previous accumulation area that sparked July’s bullish impulse.
Trading Plan
Bias : Short-term Bearish 🐻
Short Setup :
Look for rejections or weak structure within the Sell Area → Target $103,500 – $104,000.
Long Setup (Reversal Watch):
Monitor price action in the Demand Zone for bullish rejection candles or lower-TF structure shifts 🟢
Key Levels
Supply Zone: $122,000 – $125,000
Sell Area / Flip Zone: $116,000 – $118,000
Demand Zone (Buy Interest): $101,000 – $103,000
Intermediate Support: ≈ $101,200
Summary
BTCUSD is in a corrective phase within a larger bullish structure. The current move down is healthy and could offer a golden reload opportunity if the Demand Zone holds.
⚠️ Disclaimer
This analysis is for educational purposes only — not financial advice. Always manage risk.

BTCUSD- 4H Bullish setupBTC remains in a clean bullish continuation phase.
As long as price sustains above $106 000, upside targets are:
T1: $110 800 First reaction zone — short-term resistance.
T2: $114 200 Mid-level target — aligns with momentum breakout region.
T3 (Final): $118 000 Final target zone — coincides with full measured move projection.
Momentum, EMAs, and Fibonacci structure all support a high-probability push toward the $118K objective.
Bullish Confluences
EMA Alignment: 20-EMA trending above 50-EMA across 4H and 1D — strong momentum confirmation.
Volume Breakout: Expanding buy-side volume since reclaiming $105 000 indicates sustained interest.
RSI Trend: RSI holding above 60 with higher lows — momentum remains in bullish control.
Fibonacci Confluence: The 1.618 extension overlaps with prior breakout liquidity zone near $114K.
Weekly Support (62–63K): Remains the structural base for the broader bull cycle — trend intact above that zone.

BTC/USDT 2h - AlgoX flips to short/sellThe AlgoX Indicator has flipped to short/sell! I will post a 1Day chart in a few days as well!
Please comment any pairs and timeframes youd like to see!

BTCUSD – When the rebound is just a trapAfter a short technical rebound around 111–113k, Bitcoin is now facing a strong resistance zone — where both EMA 34 & EMA 89 converge, along with a key supply area that triggered the mid-October selloff.
Structurally, the chart is forming a series of lower highs , while the recovery momentum remains weak and buying volume keeps fading — clear signs that bulls are losing strength. If BTC fails to break above the 113k–115k zone, the price could turn lower toward 107k support , or even retest the long-term ascending trendline.
Although recent news shows continued ETF inflows, their impact seems to be diminishing. With the USD showing mild strength and market sentiment still cautious after the earlier crash, bears are gradually taking control in the short term.
Scenario to watch
Resistance zone: 113k – 115k
Target zone: 107k – 105k
Upcoming trend: mild downside or support retest

The Silent War Between Traditional Finance and Crypto!Hello Traders!
Whether you realize it or not, there’s a silent war happening in the financial world, a battle between Traditional Finance and Crypto .
On one side are banks, regulators, and old financial systems built over centuries.
On the other, a decentralized movement that aims to replace them with blockchain and digital assets.
This war isn’t fought with weapons, it’s fought with innovation, control, and trust.
1. The Old Guard, Traditional Finance
Traditional finance relies on intermediaries, banks, brokers, and central banks.
Transactions are slow, heavily regulated, and full of middlemen fees.
The system gives stability but limits freedom. Every transfer, loan, or investment must pass through institutions that hold the power.
2. The New Challenger, Crypto & Decentralization
Crypto removes the middleman by allowing peer-to-peer value exchange through blockchain.
It offers transparency, speed, and global access, anyone with an internet connection can participate.
For the first time, individuals can control their money without asking permission from financial authorities.
3. Why It’s a “Silent War”
Traditional finance sees crypto as a threat to its control.
Regulators tighten policies to limit crypto adoption, while institutions secretly invest behind the scenes.
At the same time, crypto needs traditional finance for liquidity, fiat conversions, and institutional trust.
So both depend on each other, even as they compete.
4. The Future, Integration, Not Elimination
Over time, the war may end in balance, not destruction.
Banks and funds are already entering blockchain through tokenization, ETFs, and digital custody.
The final version of finance may be a hybrid, traditional systems powered by crypto infrastructure.
Rahul’s Tip:
Don’t think of TradFi vs Crypto as enemies, think of them as two forces shaping the next generation of money.
The real winners will be those who understand both worlds and can adapt as they merge.
Conclusion:
The silent war between traditional finance and crypto is not about who wins, it’s about how finance evolves.
Crypto challenges the old system, but also inspires it to improve.
In the end, innovation always wins, and the world moves one step closer to financial freedom.
If this post gave you a new perspective on the battle between TradFi and Crypto, like it, share your view in comments, and follow for more deep market insights!

BTC: Shows an obvious volatile trendToday, BTC’s situation is relatively complex, with intertwined bullish and bearish factors, showing a volatile trend.
Price Movement: There has been sharp volatility, with rapid rises and falls. From the hourly chart, the price surged to around 114,000 last night, followed by a significant pullback from the highs, retesting the key support level around 107,500.
Influencing Factors:
News: The Federal Reserve held a meeting with payment companies to facilitate better institutional access to the stablecoin sector. This news triggered a short-term surge in Bitcoin prices. However, subsequent remarks by Trump proposing a 155% tariff led to a price decline. The uncertainty in news has had a significant impact on the market.
Market Sentiment: The fear index stands at 25, indicating a tendency toward panic in market sentiment. Additionally, the large traders’ long-short ratio shows a slight dominance of bears at 52.34%, reflecting relatively stronger short-term bearish momentum in the market.
Capital Flow: U.S. Bitcoin ETFs have seen net inflows exceeding $3.6 billion this month, the highest since January. Institutions like BlackRock continue to increase their holdings, forming bottom buying support for prices. However, the total open interest across the network has reached $48 billion, highlighting high leverage risks. A sharp price fluctuation could trigger massive contract liquidations, exacerbating market volatility.
Technical Analysis: On the hourly timeframe, the MACD has re-formed a death cross pointing downward. Although the blue bars have shortened and started to turn red, indicating a partial shift in short-term momentum, bears still hold the overall advantage. The upper resistance level is around $111,000, and the lower support level is around $107,500. A break below this key support could lead to further downside.
Trading Strategy:
Focus on range-bound trading. Avoid taking positions at mid-range levels, exercise caution in chasing trends, and patiently wait for key levels to enter trades.
Buy 107,500 - 108,500
SL 106,500
TP 109,500 - 110,500 - 111,500
Sell 111,000 - 110,500
SL 112,000
TP 109,500 - 108,500 - 107,500
Daily-updated accurate signals are at your disposal. If you run into any problems while trading, these signals serve as a reliable reference—don’t hesitate to use them! I truly hope they bring you significant assistance

Bitcoin Stuck Between Daily 50 and 200 MAsBitcoin made a nice move to the upside yesterday - then retraced it ENTIRELY before the daily close. The candle spread from the 200 MA below to the 50 MA above, clearly trading in a tight range between the two.
Very hard to get a clear picture at the moment.

BTCUSD Down Trend breakout bullish strong from support area🚀 #BTCUSD Technical Update 🚀
Bitcoin has broken out of the downtrend and reclaimed the key support zone around 111,100 💪
Momentum looks strong on the 1H timeframe, with buyers stepping in aggressively. 📈
🎯 Technical Targets:
1️⃣ 113,300 – Initial target
2️⃣ 116,000 – Extended target
As long as BTC holds above 111,100, the bullish bias remains intact ✅
#Bitcoin #BTC #Crypto #Trading #Breakout #TechnicalAnalysis

BUY BITCOIN - BTC/USD- Amazing low risk high reward trade!Based on our deep analysis we can see that BITCOIN (BTC/USD) will head to the upside. Great time to BUY - it has broken POWERFUL resistance levels and is also being held by powerful support levels which it can't break through. Target is next resistance level - buy now!

Bitcoin Market Analysis – October 20, 2025⚡️Welcome back to today’s Bitcoin analysis.
The trigger we discussed in the previous update has been activated, and the V-pattern we’ve been talking about throughout the week has finally formed, confirming the expected reversal structure.
🚀As mentioned earlier, the overall trend remains bullish, and once we see a clear stabilization above the 111,000 and 113,000 zones, it will serve as confirmation of our bullish continuation scenario.
📈The 111,000 zone could also provide another entry opportunity for those who missed the long setup around 107,000 — as long as the structure holds and buyers continue to defend this level.
🌕At this stage, it’s important to wait for fundamental confirmation.
If the broader market sentiment turns risk-on, Bitcoin could easily push toward new upside targets in the coming sessions.
---
> Disclaimer:
This content is for informational purposes only and does not constitute financial or investment advice. © DIBAPRISM
Larry D.Kohn

Today is 12 nov 2017The 2017 cycle is here again. Last cycle failed but the actual ATH would be 110.000. That´s why end of 2024 that ATH was broken. Maybe 4 to 5 weeks to the new top.

Bitcoin Daily likely towards $100K1). Hit Trend-line resistance. 2). Dropping on a 5-wave sequence. 3). Dropping pitch is steep with momentum. 4). Trump's China Tariffs were the US$ strength catalyst, which is the other side of the equation!

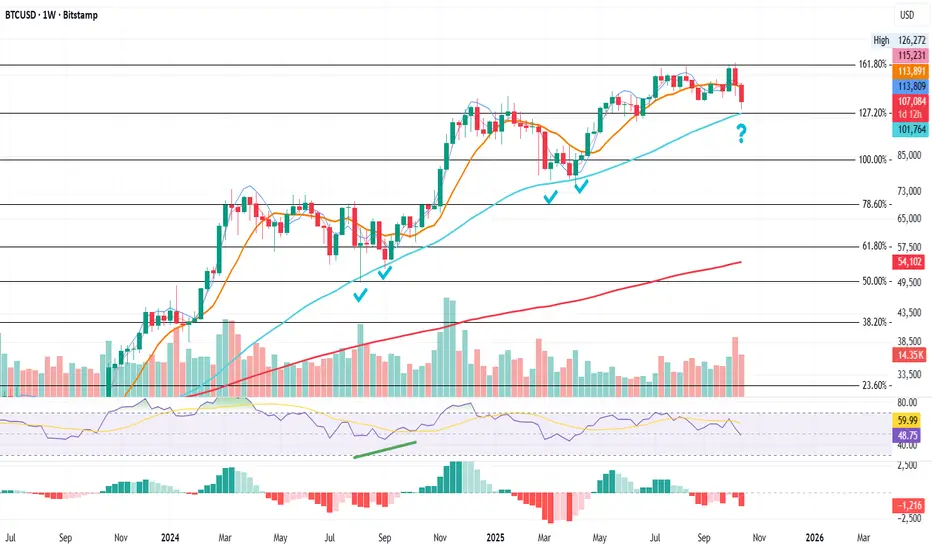
BTC Weekly Series – Tracking the Price, Week by Week
BTC Weekly – The Line That Defines the Cycle
On this chart, one line has quietly supported Bitcoin since the March 2024 ATH: the blue cayenne line, the 50-week moving average.
It held the dip after the January 2025 ATH, and now we’re about to find out if it can do it again after the September 2025 ATH.
Each time price needed that support, it tested the 50-week MA twice before reversing higher.
There’s also a recurring pattern with Fibonacci levels:
* After the March 2024 ATH, price lost the 61.8 Fib, touched the 50-week MA, and bounced.
* After the January 2025 ATH, price lost the 100 Fib, touched the 50-week MA, and bounced.
This time, things are different.
The 50-week MA now aligns exactly with the 127.2 Fib, meaning there’s no safety net below.
If this level fails, there’s nothing technical left beneath it that has caught price since March 2024.
That could make any future leg higher more difficult to form.
From here, the focus should be on weekly closes.
They will tell us whether this structure still holds or if we’re about to enter a deeper correction phase.
I’ll continue updating this view at the end of each week or on Mondays, to keep track of how this key level evolves, both for myself and for anyone following the cycle closely.
Always take profits and manage risk.
Interaction is welcome.
Downward Trend I will expect a Bearish season for BTC in the upcoming weeks. I think bullish wave is over. and a bearish wave is already started.

BTC/USD – Bullish Channel Breakout and Retest Buy SetupChart Overview
Trend: The chart shows BTC moving within a descending channel (highlighted in blue).
Current Price: Around $106,534
Setup Type: Possible bullish reversal setup from the lower channel boundary.
🧩 Technical Breakdown
1. Pattern
BTC is currently testing the upper boundary of a falling channel.
Price has attempted to break out upward, suggesting early bullish momentum.
A retest zone (blue rectangle) is drawn between $104,690 – $103,033, indicating a potential buy zone.
2. Entry Zone
Entry Point: $104,690
This is around the retest of broken channel resistance, now turned support.
Price may dip into this zone before bouncing upward.
3. Stop Loss
Stop Loss: $103,033
Below the blue zone — protects from deeper continuation of the downtrend.
4. Target Point
Target Zone: $108,979 – $109,043
This is near the previous swing high and serves as a short-term bullish target.
5. Risk-to-Reward Ratio
Entry: $104,690
Stop Loss: $103,033 → Risk ≈ $1,657
Target: $109,043 → Reward ≈ $4,353
Risk/Reward ≈ 1:2.6, which is favorable for a long setup.
📈 Possible Market Scenario
BTC may retest the breakout area near $104.6K.
If it holds support, a bullish move toward $109K is expected.
A break below $103K invalidates the setup, resuming bearish pressure.
💡 Summary
Signal Direction Entry Stop Loss Target Risk/Reward
BUY Setup Bullish $104,690 $103,033 $109,043 1:2.6
⚠️ Note
Wait for confirmation (bullish candle or retest bounce) before entering.
Use tight position sizing to manage risk, especially since BTC remains volatile.

BTC UpdateNice bounce but still not oversold on the daily. So further downside possible.
I decided not to play this when it does get oversold. I'm not liking the chart pattern now taht it lost the sideways channel.

BTC UpdateDaily MFI seems to be rising even though it didn't go oversold. Still having issues regaining the old channel.
Made a few bucks flipping next week's calls, at least it's good for that, lol. Quick in and out. On a day like today, buy the dip then it gives you many chances to get out. I missed the big pump mid-afternoon though.
As for long term bets, I'm more inclined to short when MFI hits overbought than buying now.

Bitcoin analysisAfter the strong candle that formed on Tuesday due to the news and pushed the price up to **113K**, the entire move was retraced, and now the price is stuck at the **109K resistance**.
If it manages to break through this resistance, there’s a high probability that we’ll see a move toward **115K**.

BTCUSD - Sideways / Down Movement Leading to AltsznIt may be time for alts to shine.
I dont think price for BTC will reach the red area this bull run
The action for BTC may move sideways for awhile, this is the time when alts usually pump.
From there I expect movement back to the green buy zone, a retest of the prior ATH last Bullrun.
Daily chart here.

Bearish ContinuationPrice has broken previous lows on the daily tf and a correction/retest has been made. Expecting price to continue down lower.
Patience is key.
