BTCUSD 30M – Pullback Setup Loading BITSTAMP:BTCUSD
Bitcoin showing retracement signs after rejection from 126K zone — liquidity resting below 123K 👇
If it taps back into 122.8K–123K range, bulls could reload for next impulse 💪
✅ Upside Targets: 125.8K / 126.5K / 128K
❌ Invalidation: Below 122.5K
📊 Trendline structure still strong — this could be the last dip before continuation!
BTCUSD.P trade ideas

Bitcoin Technical Analysis – Bearish Butterfly Nears Completion As mentioned in my previous forecast, Bitcoin is consolidating near $125,200 after a strong breakout from $118,000, maintaining a bullish trend within an ascending channel. The Bearish Butterfly harmonic pattern is nearing its Potential Reversal Zone (PRZ) between $128K–$130K. The RSI near 70 suggests mild overbought conditions, while price action above the 50- and 100-SMA confirms trend strength.
If BTC holds above $124,600, another push toward $130K is likely before facing resistance. However, a break below $121,100 could retest $118,500. The structure remains bullish overall — with the next potential expansion phase targeting $160,000 in the months ahead.

BTC: a necessary up confirmation !BTC:
.
A necessary up confirmation !
Weekly Engulfing Candle Pattern to confirm big smart money.
A shakeout maybe/ maybe not for a continuously uptrend confirm.
.
US STOCKS- WALL STREET DREAM- LET'S THE MARKET SPEAK

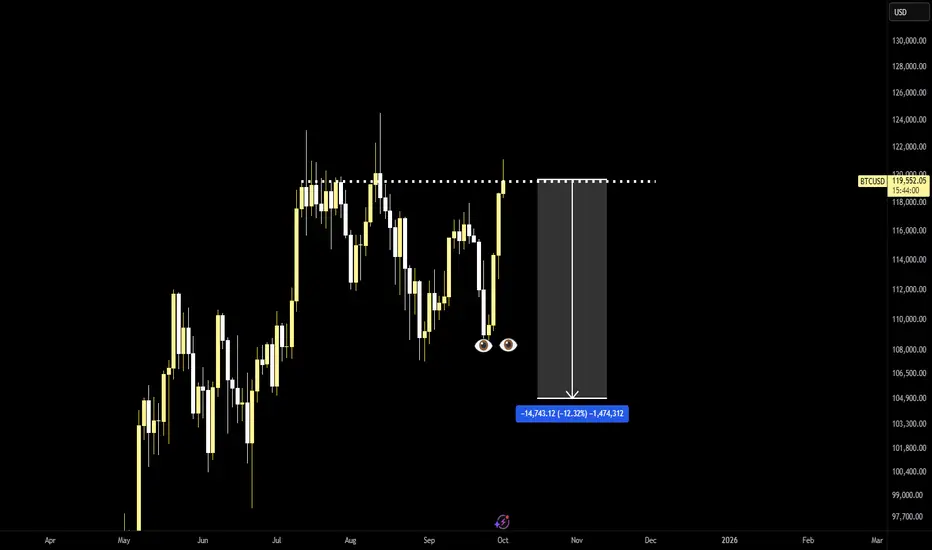
Everyone screaming uPtOBer - but Bitcoin has a way of surprising- let me start this analysis by saying we are definitely in a supercycle and the entire crypto market is likely to see much much higher prices in 2026
- however there is reason to believe Bitcoin, as the main driver of the market, is simply not ready for trending conditions yet
- a pullback to 110k is likely, perhaps even as low as 100k
- if bulls are serious this time, they need to conquer key resistance (white dotted line)
Massive Signal on Bitcoin!! The next movement explainedBitcoin has been moving within a very aggressive uptrend , guided by two clear blue trendlines on the chart. These lines are currently defining the rhythm of the rally, and as long as they hold, the bullish momentum remains intact .
However, a break below them would signal that the strong uptrend is over , opening the door to a more sideways or even bearish market.
But there's MUCH more!
Another reason to think we may be approaching the end of this rally is how price has been moving in 15% ranges.
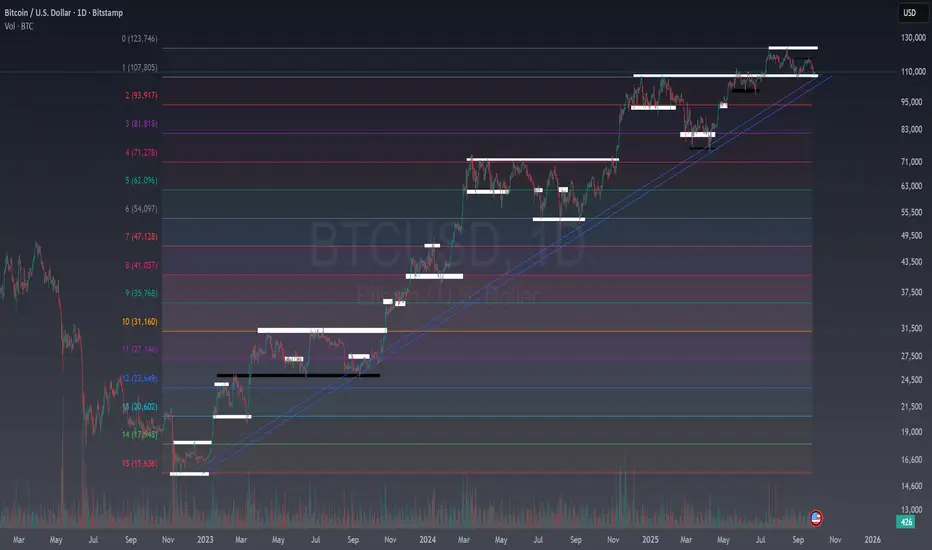
If we look at support and resistance zones, there is something surprising in BTC. Can you see what I mean?
I'm speaking about the colored lines of the published chart.
These colored bands act like “steps”, and BITSTAMP:BTCUSD has historically respected them very well. Look at the previous downtrend.
Notice how they align almost perfectly with the white support and resistance zones. The black zones represent intermediate levels between these ranges. Right now, price is about to re-enter a previous range , which usually indicates buyer weakness.
In strong trends, price tends to move into new ranges rather than fall back into old ones.
I’ll share more examples to show that whenever Bitcoin revisits older zones, it’s rarely a bullish signal.
On top of that, if we compare with Bitcoin’s past halving cycles, studies suggest the current cycle could be nearing its end around September–October this year. This isn’t a mathematical rule, but it’s a clear alert that Bitcoin may already have gone far enough.
I spoke about this time frame in July:
The key level to watch is $108,000 .
As long as it holds, the trend is still bullish. But losing this level would mean more than just breaking support:
It would put price back into a previous range.
It would break both blue uptrend lines.
It would be aligned with the timing of previous BTC cycles.
Finally, there’s a macro factor that nobody seems to be looking at.
Bitcoin’s rally started in October 2023 , exactly when interest rates stopped rising and inflation was brought under control worldwide.
Now, the environment is the opposite : rates have already been cut, Europe has signaled it won’t go below 2%, and the U.S. market is pricing in several future rate cuts . But it’s far from certain that the Fed will deliver the aggressive cuts the market expects.
Unless the Fed surprises with deeper cuts, there doesn’t seem to be much fuel left to keep this Bitcoin rally going.
👉 I remain bullish above $108,000 , but losing that level would be a major red flag for Bitcoin’s trend.
BITCOIN IDEA
Bitcoin is still stuck in a sideways range.
KEY level bullish is at 122,300, and right now price isfilling orders near 121,183 daily cap.
That means we’re kind of in the middle — not super strong, not super weak.
The daily trend is still up, but price is pulling back a bit to fill orders.
If Bitcoin starts dropping, 118,543 is the next big level to watch.
If it holds and bounces, we might see another push higher.
If it breaks, we could fall deeper into that lower area.
The U.S. dollar is strong this week → makes it harder for BTC to move up.
Jack Dorsey (the Twitter guy) just dropped a new Bitcoin wallet — cool for long-term use.
So for now: stay patient, watch 121K and 118K zones, and don’t chase candles.

Bearish momentum building?The Bitcoin (BTC/USD) has rejected off the pivot and could drop to the 1st support that aligns with the 38.2% Fibonacci retracement.
Pivot: 124,139.15
1st Support: 119,294.96
1st Resistance: 126,282.29
Disclaimer:
The above opinions given constitute general market commentary, and do not constitute the opinion or advice of IC Markets or any form of personal or investment advice.
Any opinions, news, research, analyses, prices, other information, or links to third-party sites contained on this website are provided on an "as-is" basis, are intended only to be informative, is not an advice nor a recommendation, nor research, or a record of our trading prices, or an offer of, or solicitation for a transaction in any financial instrument and thus should not be treated as such. The information provided does not involve any specific investment objectives, financial situation and needs of any specific person who may receive it. Please be aware, that past performance is not a reliable indicator of future performance and/or results. Past Performance or Forward-looking scenarios based upon the reasonable beliefs of the third-party provider are not a guarantee of future performance. Actual results may differ materially from those anticipated in forward-looking or past performance statements. IC Markets makes no representation or warranty and assumes no liability as to the accuracy or completeness of the information provided, nor any loss arising from any investment based on a recommendation, forecast or any information supplied by any third-party.

Double Bottoms and Double Tops Providing some education about market shifting shapes alongside live market conditions
Also, I am being taught by the AI mentor whilst is works with the live markets

BITCOIN 4HRBITCOIN(H4): Bearish FVG just formed on H4
FVG (Fair Value Gap) on H4 signals strong selling imbalance—smart money drove price down so quickly, it left an empty gap.
ICT teaches this gap often acts as resistance: price may retrace into the FVG, then reject lower.
Watch for price to revisit and respect this level before potential continuation down. #ICTreferences #MarketImbalance #PriceActionBearish
The bearish momentum that created the FVG, does seem to lack strength behind it.. The Principle stands though..

Strong Dollar Cools Crypto Market RallyBitcoin Pulls Back After New Highs: Strong Dollar Cools Crypto Market Rally
By Ion Jauregui – Analyst at ActivTrades
Bitcoin (BTCUSD) retreated to $121,000 on Wednesday after reaching a new all-time high of $126,186 earlier this week. Profit-taking and the recent strength of the U.S. dollar have temporarily slowed the bullish momentum that has dominated the market in recent weeks.
From a macroeconomic perspective, the correction comes amid fiscal uncertainty in the United States, where the government shutdown has entered its second week. This situation has reinforced demand for traditional safe-haven assets such as the U.S. dollar and Treasury bonds, whose yields remain elevated. The U.S. Dollar Index (DXY) climbed to a three-week high, reducing the appeal of cryptocurrencies compared with dollar liquidity.
Bitcoin’s recent rally was driven by sustained inflows into Bitcoin ETFs, expanding institutional participation in the asset, and by speculative positioning linked to so-called “devaluation trades”, where investors bet on the depreciation of fiat currencies against scarce assets. However, the dollar’s recovery and caution ahead of the Federal Reserve minutes have temporarily cooled that optimism.
BTCUSD Analysis:
On the technical front, Bitcoin faces strong resistance near its highs around $126,245, an area showing a clear exhaustion pattern accompanied by lower volume. The immediate support lies at $121,000, followed by $117,997, and the key Point of Control (POC) zone around $108,296, from where the latest bullish leg began. The daily RSI has eased from overbought levels to 61.63%, suggesting a healthy consolidation phase within a structure that remains bullish in the medium term. The MACD continues to indicate upward momentum, and the moving average crossover that began on October 2 appears to be expanding, with the current price well above the 50-day average, which aligns with the $117,970 support area. A break below these levels could open the door to declines toward $117,800–$115,000, while a sustained move above $123,500 may trigger new breakout attempts toward $128,000–$130,000.
Crypto Ecosystem Follows the Pullback
Across the sector, crypto-related equities mirrored the retreat: MicroStrategy (MSTR) dropped 8.7%, Coinbase (COIN) fell 2.7%, Riot Platforms (RIOT) slipped 0.4%, and Marathon Digital (MARA) lost 1.5%. Among major altcoins, Ethereum declined 4.6%, Solana 4.5%, and Cardano 5%, reflecting a broader risk-off sentiment across digital markets.
In summary, Bitcoin is undergoing a technical correction within a volatile macroeconomic environment, where the dollar’s performance and the Federal Reserve’s guidance are likely to dictate the direction of the next major move.
*******************************************************************************************
The information provided does not constitute investment research. The material has not been prepared in accordance with the legal requirements designed to promote the independence of investment research and such should be considered a marketing communication.
All information has been prepared by ActivTrades ("AT"). The information does not contain a record of AT's prices, or an offer of or solicitation for a transaction in any financial instrument. No representation or warranty is given as to the accuracy or completeness of this information.
Any material provided does not have regard to the specific investment objective and financial situation of any person who may receive it. Past performance and forecasting are not a synonym of a reliable indicator of future performance. AT provides an execution-only service. Consequently, any person acting on the information provided does so at their own risk. Political risk is unpredictable. Central bank actions can vary. Platform tools do not guarantee success.

WHATS UP WITH BITCOIN?
✅BITCOIN went up by almost 16.5% in under 11 days and established a new All-Time-High. An absolutely incredible run, so no wonder we are now seeing a bearish correction.
The take profit wave and the local opportunistic selling pressure might take the price back down to around 118,000$ demand area. This is where we can start buying from again as I am sure a new ATH will be established soon!
LONG🚀
✅Like and subscribe to never miss a new idea!✅

BTC Monthly RSI - where is the cycle top?I drew these RSI trendlines on the monthly chart.
I compared where we are now (~RSI 72) to where RSI might top if it follows this trendline (~85). Then I looked at BTC price action from the same RSI levels in past cycles... This is interesting!
In 2017, BTC rallied about 2000% from today’s RSI (72) value to the cycle top.
In 2021, it was around 411%.
If this pattern rhymes again, even a small 74% rally from now could mean a 200k BTC price. (180k is a 55% rally from now.)
This doesn’t guarantee anything—future price action is unpredictable—but it could be a indicator about where we’re heading... No one knows if the top will be 150k, 200k, or 250k, of course!

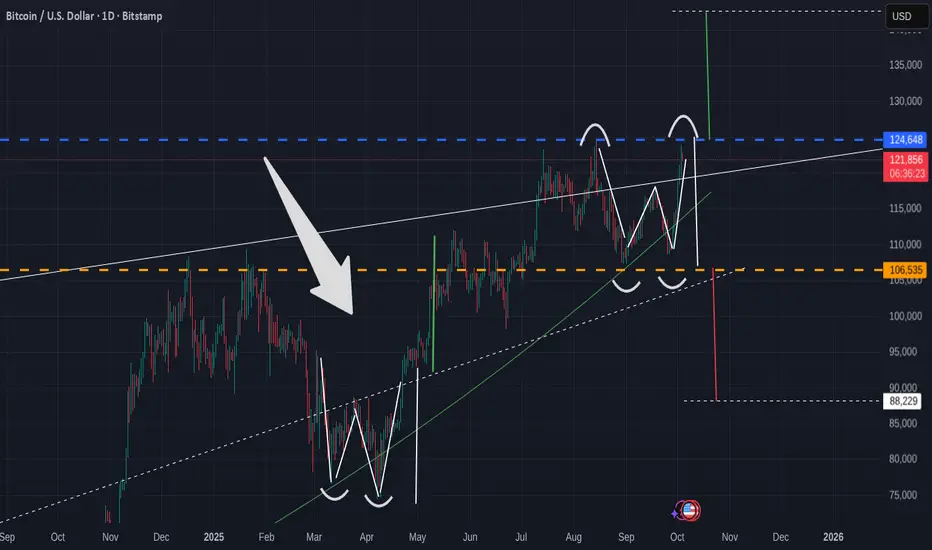
A VERY Bullish sign for Bitcoin but with a possible Warning
A Very simple Bitcoin Daily chart
Obviously, the eye is drwan to the Arrow pointing towards March / April 2025 when Bitcoin PA printed a W patter, or a double bottom.
The Vertical lines show the measured move higher that was executed perfectly.
The question we have right now is, have we just printed another W pattern, with a Measured Move higher to 142K usd
Or Have we just printed a Double TOP with a measured move LOWER to around 88K usd
4 days ago I posted the Monthly Charts and mentioned that we may start October with a Drop, that may last till around 12 - 15 October.
Untill this measured move plays out, I stand by this But I am obviously also open to this not happening.
What ever happens, I have learnt over the years to be ready for BOTH sides of the coin.
I DO have a BUY SPOT order placed for Bitcoin at 92K
IF we get down there,,IF,,,,,It may well be thelast time we get the chance to Buy Bitcoin under 100K
Time will tell
BTC 2018 DURING-AFTER US GOV SHUTDOWN. 2025 = ?
BITCOIN 2018 DURING-AFTER US GOVERNMENT SHUTDOWN
2025 US GOVERNMENT SHUTDOWN = -35% (80k) to -84% (19k)?
DYOR. TAYOR

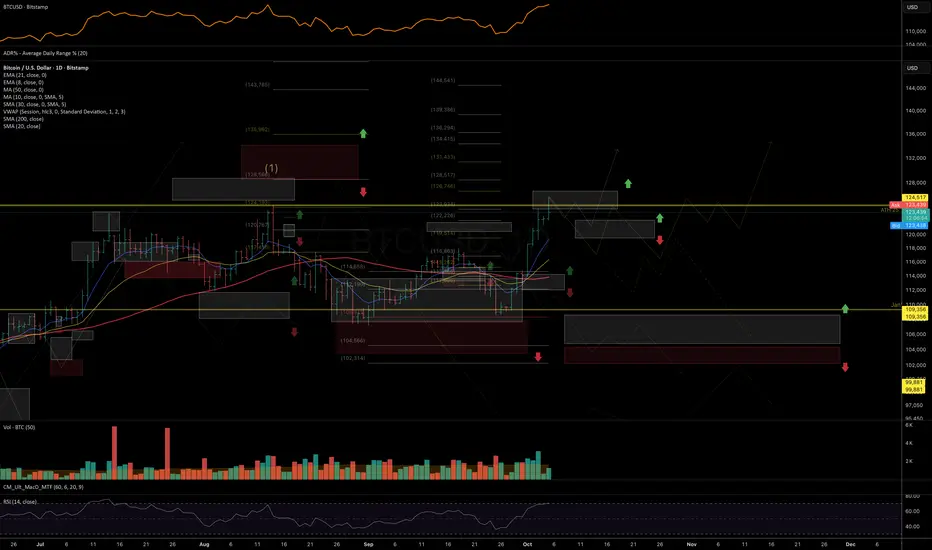
BTC: Surge - Retracement - ConsolidationToday's BTC market shows a pattern of high-level consolidation with a pullback, characterized by a three-stage "surge - retracement - consolidation" trajectory. In the early session, it attempted to break through the 124,000 resistance level but failed. Subsequently, it pulled back to around 121,000 to seek support, and later, a bull-bear tug-of-war unfolded within the 122,000 range.
Close attention should be paid to the October 15 deadline for the U.S. government shutdown (Polymarket predicts a 56% probability of it lasting until that date). If the shutdown is extended, leading to further delays in ETF approval, Bitcoin may retrace below 120,000, and in extreme cases, test the support level at 118,000.
The current market is suitable for a "low-leverage + position-splitting strategy": Holders can set 121,000 as the trailing stop level. Given that the current support level has moved upward and trading volume has not contracted, the stop-loss range can be appropriately widened. On the other hand, observers may wait for the price to stabilize above 123,600 or for signs of stabilization with reduced volume after retracing below 120,500 before considering entry, avoiding chasing gains or selling in a panic within the consolidation range.
Buy 121500 - 121800
TP 122000 - 122500 - 122300
SL 121000
Daily-updated accurate signals are at your disposal. If you run into any problems while trading, these signals serve as a reliable reference—don’t hesitate to use them! I truly hope they bring you significant assistance

Bitcoin to $134kAccording to the broadening wedge (blue lines) from the bottom of that , we get a target to 134k for bitcoin

Weekly Crypto Market Outlook: Trend Structures and Expectations The market continues to follow a macro-pattern similar to the previous bull cycles that unfolded in Q4 of 2013, 2017, 2020, and 2021. I discussed this structure in detail in my August 18 update:
Specifically: a summer rally, several weeks of September correction and consolidation, followed by the beginning of a new upside leg in early October.
Updated BTC chart:
Another key development is the stablecoin market capitalization approaching a major technical zone. A confirmed breakout above it could signal a strong liquidity rotation into crypto assets — potentially marking the start of a new wave of growth across the crypto space, similar to the dynamics seen in 2023 and 2024.
Inverse correlation of BTC and stablecoin market cap:
Perhaps the most compelling factor is Bitcoin’s relationship with gold. Despite massive institutional adoption through ETFs, the BTC/GOLD ratio has remained stagnant since early 2021. This suggests that Bitcoin remains significantly undervalued relative to gold, leaving substantial room for appreciation as the digital asset continues its mainstream integration.
BTC/GOLD chart:
These factors — combined with the fact that most altcoins have already broken above their local resistance zones mentioned in the previous review — point to a potential recovery of upside momentum across the crypto market and higher targets into Q4.
As long as prices hold above their local and mid-term support zones, I expect continuation of the rally toward the next resistance levels. Breaking these support zones, will push odds in favor of more prolonged consolidation. But as long as BTC is not closing bellow its 50DMA for more than two weeks, macro bull cycles remains intact.
Below are the key technical levels for the main assets this week:
BITSTAMP:BTCUSD
Chart:
Short-term support: 122–119.5K
Mid-term support: 117–115K
Resistance: 131–135K
BITSTAMP:ETHUSD
Chart:
Support: 4400–4375
Resistance: 4870–5070
BINANCE:BNBUSD
Chart:
Support: 1142–1089
Resistance: 1225–1275
BINANCE:XRPUSDT
Chart:
Support: 2.92–2.88
Resistance: 3.20–3.35
CRYPTO:HYPEHUSD
Chart:
Support: 48.5–47.35–46
Resistance: 55.5–60
BINANCE:SOLUSDT
Chart:
Short-term support: 223–219
Mid-term support: 212–207
Resistance: 247–260
Thank you for reading - wishing you a great Sunday and a strong start to the new trading week.
bitcoin easy modeI've been posting this chart for months now. Over and over.
BTC is in easy mode. I'm done for the year, could also be done for good.

Next Upside BTC target is 126-127.30K. Beware of OverboughtMorning folks,
So BTC not has just formed big H&S but already completed it. But it is not a reason for upset. We consider 126-127.30K as the next upside target, based on weekly butterfly scenario .
Still, due to very fast action market hits overbought on daily chart. We prefer to wait for tactical pullback, somewhere to 117K or or even 115.3K support levels before thinking about long entry.
I mark this idea as" bearish" because of retracement expectations, but overall context is bullish of course...
Yeah...I'm doing BTCUSD quick flip ideas now...Those who have followed me know I've had a bit of a run using my algorithm (no I'm not giving it away or selling it) on stocks, with 152 ideas posted here and 147 closed profitably so far. I have been playing around with it for several months on crypto and it's Saturday and it's raining and I'm bored and BTCUSD is on sale so I thought I'd stir up a little trouble here.
While I don't trade Bitcoin myself except using BITX to double my returns, I'll throw this out mostly for any of my followers that do trade it and are also bored and would like to give it a run on a weekend. Here's how I do this. My initial lot is placed here at this entry price. I do not use stop losses and I do not use price targets. When my algo says sell, I sell without hesitation. If it says buy again before it says sell, I will add another lot at that point, tactically adding and selling until the original lot closes out.
I know there are those who might be understandably skeptical of me not using stop losses, but this works. 23-1* this year, 31-0 last year and 28-0 the year before that. Etc. etc. Literally the only losing trade so far with BTC is the one opened August 15th and that would still be open and only down 1.5% or so. It's been used on stocks for a LONG time with a win rate of better than 99% all time. Maybe consider giving me the benefit of the doubt here...
Anyway, the basic premise behind this is simple - harvest gains before the market has a chance to claw them back. It's FAR easier to make money than it is to make it back after you lose it, so my goal is to not lose it. It's pretty simple in that regard. Short duration, high percentage trades stacked one after the other. When one trade pays off, I put the money to work elsewhere immediately. There is always something on sale somewhere.
This is not a trading style for the get rich quick, moonshot or bust crowd, so just move along if that's you. My goal is a relentlessly increasing equity curve and if you're wondering how that's going, check out the first paragraph again.
So here goes. Fully prepared for crazies who think trying to shout my long idea down will magically protect their short positions (btw, it doesn't work). If this hasn't paid off by Monday, I'll be loading up on BITX then. For now, let's pretend I'm long at 115,750.57.
As always - this is intended as "edutainment" and my perspective on what I am or would be doing, not a recommendation for you to buy or sell. Act accordingly and invest at your own risk. DYOR and only make investments that make good financial sense for you in your current situation.

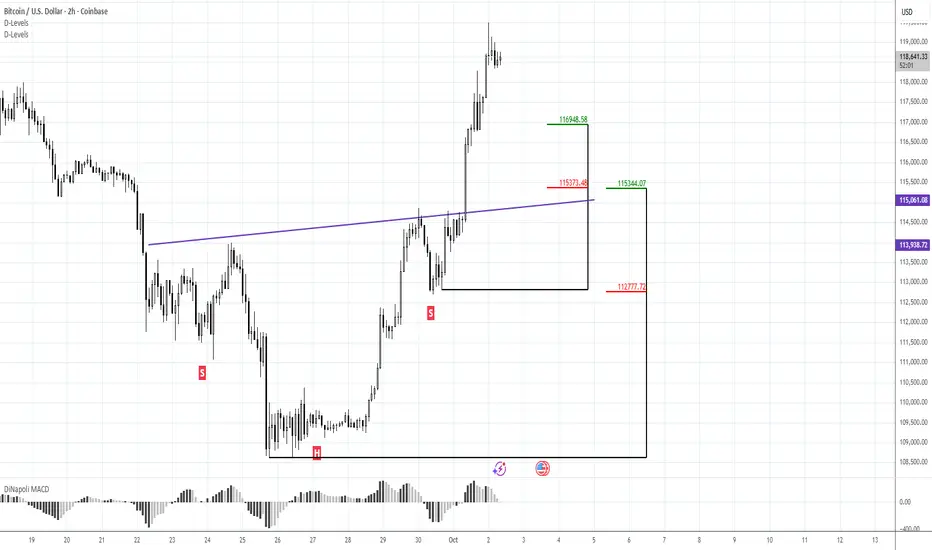
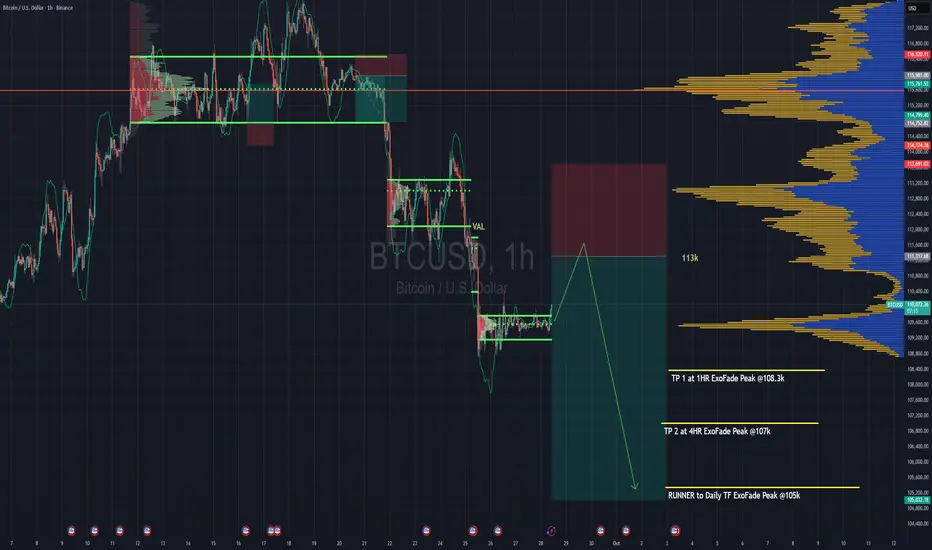
Looking to Short Bitcoin From Here : Winter Is Coming !!Looking to short BTC for a continuation of the downtrend.
Trend is your friend is what they say.
So we're basically going to wait for a pullback to 113k range then enter a sell.
The sell entry caters for both H4 & Daily timeframe trend, so it's a strong one.
The sell entry range also has the VAL of the last rotation we had from Sept 21st to Sept 24th when we finally broke down from it at 112k. That VAL should be a strong point for rejection, it'll be one of the places where we'll truly get to test the strength of the bears ( that's if we even make it that far )
TP targets are based on ExoFade peaks of the H1, H4 and Daily timeframe.. You can add the ExoFade to your charts to follow on your own charts as well.
VAL - Value Area Low of the volume profile
Strategy => Volume + Trend + Lots of coffee
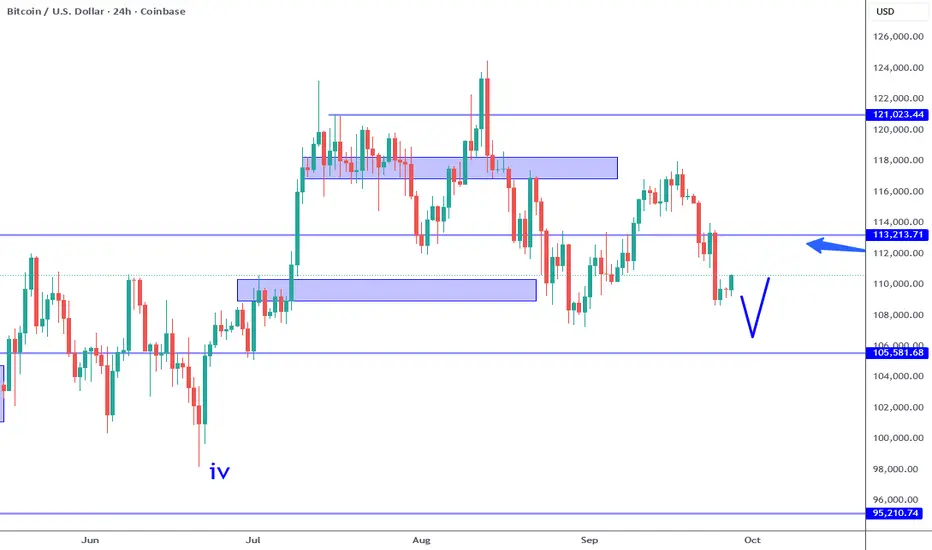
Bitcoin: Higher Probability At Range Levels.Bitcoin range is defined by the blue rectangles on this chart. Range low is around the 105 to 108K area and the range high is around the 115 to 118K areas. The 113K area happens to be near the midpoint of this range which means price action here is MOST random. Over the previous week, I pointed out the 113K potential support, and during the week there was a test followed by a bullish engulfing candle. I characterized this as a long, yet now we see that Bitcoin had alternate ideas. There is NO way to forecast price action, the best we can do is come up with reference points and then evaluate the price action that appears.
While the bearish rejection of the 113K area looks very negative, it is meaningless over the bigger picture. The broader trend has not changed, it is generally bullish and the shorter term trend is consolidating (likely the broader wave 4). Keep in mind, historical price action offers a way to gauge risk, strength, weakness BUT does NOT offer any way to accurately forecast the future. Like poker, this is a game of INCOMPLETE information and in order to navigate effectively we MUST adjust as the market provides new pieces of the puzzle.
As of now, here are the levels I am watching: range support 105K, 108K, range resistance 118K, 121K. It is all about how price action behaves IF it reaches one of these areas. Since I do not short on this time frame, that limits me to looking for bullish reversal at these support levels, otherwise there is not much else to do. IF the resistance is reached, even if sell signals occur on this time frame, if I was planning to short, I would be extra selective since there is still a greater chance of a bullish breakout based on the price structure.
The illustration on the chart shows one potential scenario which I believe has a greater probability. IF adverse catalysts occur, then it can completely negate this idea even with confirmation present. The predefined RISK and position sizing aspect is key when it comes to navigating this market optimally. There are many ways to define these variables, one that I use is the Trade Scanner Pro which utilizes the ATR to define risk, etc. Position sizing is another story, but beyond the scope of this article.
Range bound markets are hard to trade if you are too focused on the small picture. You can obtain higher probability outcomes simply by waiting for price areas that carry much more meaning historically. By preparing in advance, you can anticipate price behavior rather than react to price spikes or internet hype. For Bitcoin, it is simply about WAITING for the range support/resistance and confirmation patterns with structured risk management.
Thank you for considering my analysis and perspective.
BTCUSD 4H | Precision Long at High-Probability SupportThe 122,250 level is not just a number; it's a technically significant zone that has been respected multiple times. Price is once again probing this liquidity pool. We are looking for a precise, high-conviction entry on a bullish rejection candle (e.g., Bullish Engulfing, Hammer) at this level, signaling buyer commitment.
The Trigger: A confirmed bullish reversal pattern on the 4H chart at 122,250-122,280.
The Narrative: This is a mean-reversion play within the larger range, targeting the other side where liquidity rests.
Execution:
Entry: On the close of the bullish reversal candle.
Stop Loss: 122,100 (allowing minimal room for a stop hunt below the key level).
Target 1: 122,550 (Range High)
Target 2: 122,800 (Breakout Confirmation Level)
