BTC Bounce Looks Corrective – Bottom Not In Yet1. Recap of My Last BTC Outlook (5 November)
In the 5th November analysis, I noted that the 106k support zone was under pressure, and if that level failed, the next meaningful target would be 90k — because 100k, despite being psychological, should not offer much after technical break.
That played out perfectly:
- 106k failed
- 100k offered nothing but a small rebound
- BTC dropped straight into the 90k zone
And then continued even deeper, almost touching 80k before rebounding
We’re now trading around 87,500, after a textbook corrective bounce.
2. Is the Bottom In?
➡️ In my opinion, no. Definitely not.
And here’s where I apply my usual contrarian filter:
Whenever I start hearing the same voices saying the same thing —
“Bitcoin bottom is in! Bitcoin up only!”
— I immediately become cautious.
These are the same people who never consider the other side of the market.
A broken compass can show the right direction once in a while, but it’s still broken.
3. Technical Picture – Nothing Bullish Here
- Yes, the bounce from 80k is normal and expected.
- Yes, BTC can easily retrace 10–15k after a large drop.
- But nothing in the current structure suggests a meaningful bottom.
What we have right now is:
- A classic corrective rebound
- Weak impulse
- No break back above of important resistance
- No reversal pattern
- No shift in market bias
It looks exactly like what price should do after a violent leg down — not like a new bull trend.
This is the type of rebound where retail screams “moon,” but professionals simply prepare for another sell.
4. My Outlook – Bearish Until BTC Reclaims 100k With Conviction
My plan is simple and level-driven:
Preferred Sell Zone:
- 92k → This is where I want to sell, ideally on a weak rally
Downside Targets:
- 80k → Recent low and first logical stop
- 75k → Major structural support and second target
Bearish outlook is invalidated ONLY if:
➡️ BTC reclaims 100k with conviction (not a wick, not a temporary spike)
Until that happens, every rally is a potential shorting opportunity.
5. Conclusion – Still Bearish, Despite the Bounce
BTC has done exactly what it was supposed to do:
- Drop to 90k
- Overshoot to 80k
- And bounce in a corrective manner
Nothing about this price action signals a bottom.
If anything, it signals more downside ahead — once the corrective rally into 92k completes.
Bias: Bearish
Approach: Sell rallies
Invalidation: Break and hold above 100k with conviction
Until then, the narrative “bitcoin up only” remains a meme, not analysis. ⚠️
Trade ideas

BTCUSD: Buyers Preparing for a Move Toward $90,000Hello everyone, here is my breakdown of the current Bitcoin setup.
Market Analysis
BTCUSD continues to recover after a prolonged downtrend, where the market consistently respected the descending Trend Line and formed a series of Range structures. Each range acted as a consolidation phase inside the broader bearish movement, with multiple breakdowns continuing the trend to the downside. Despite occasional bullish breakouts, none of them were strong enough to reverse the bearish structure, leading to further declines. Eventually, price reached the Support Zone around $84,000–$85,000, where the market produced a fake breakdown, signaling initial buyer activity. This fake breakout formed a local bottom that became the base for a reversal attempt. Following this reaction, BTCUSD began forming an Upward Channel, marking a shift in market structure from bearish to early-stage bullish. Inside this channel, price has started to create higher highs and higher lows—an essential signal of growing bullish momentum. The structure remains clean and technical: every pullback respects the lower boundary of the channel, while short impulses are reaching toward the midline of the structure. Buyers are gradually gaining control.
Currently, BTCUSD is stabilizing above the Support Zone while trading near the lower half of the ascending channel. As long as price respects this channel structure, sentiment remains bullish. The key area ahead is the Resistance Zone around $90,000, which previously acted as a pivot point and rejected bullish attempts multiple times. A clean breakout above this zone would confirm broader bullish strength.
Scenario & Strategy
I expect BTCUSD to continue moving inside the Upward Channel, gradually approaching the $90,000 Resistance Zone. A retest of this area is the most probable outcome if buyers maintain control. Short-term corrections may occur as the price approaches resistance, but overall structure favors a bullish continuation. A confirmed breakout above $90,000 could trigger a stronger move toward higher targets, opening the way for a larger trend reversal. This level remains the key barrier for buyers in the short and medium term.
However, if BTCUSD breaks down from the Upward Channel and falls below the $84,000 Support Zone, the bullish scenario becomes invalid. Such a move would likely signal a deeper correction or a return to bearish conditions. For now, buying the dips within the channel remains the more favorable approach as long as the structure stays intact and buyers continue defending support.
That's the setup I'm tracking. Thank you for your attention, and always manage your risk.

BTC/USD-Bitcoin Pullback to Fill Imbalances (FVG).The one-hour BTC/USD chart shows a clear technical setup for a short-term correction following an aggressive move up that has stalled at a significant resistance level. Price action is indicating a likely retracement to mitigate recent imbalances before any further move up.

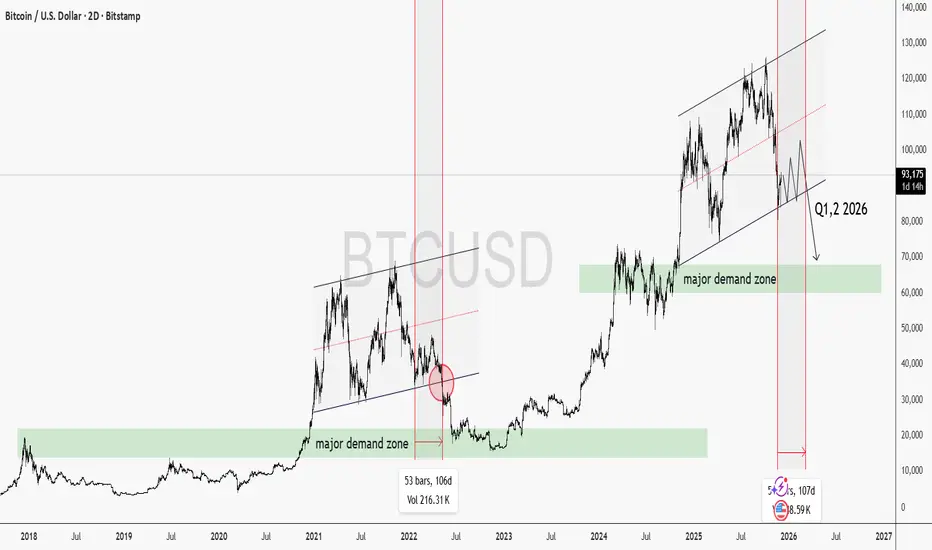
BTCUSD | This pattern usually only ends one wayBitcoin is repeating a cycle structure that usually ends the same way every time. This chart lays it out with almost uncomfortable symmetry.
Technical analysis is always about pattern recognition. If history tries to repeat or even rhyme, we may see a significant liquidity flush in Q1/Q2 2026.
Same pattern. Assumingly same timing. Same outcome, unless structure changes.
Good Luck!
BTCUSD | Waiting for breakbitcoin got rejected from the red zone a few days ago. Posted that idea a while ago.
Since then it has come back and struggled a bit to break through.
If btc where to break the bottom blue line you see on the chart. I would be confident we are going to see lower prices fast.
Let me know what your analysis and outlook is for bitcoin!
Stay safe out there and do your own due diligence, this is not investment advise!

Bitcoin: Recovery Path to 250kHey guys in this video, I shared my thoughts on the current market state of INDEX:BTCUSD , why I believe the bull market isn't over yet and also what to expect the coming weeks.
If you find this content helpful, like, share, follow and most importantly share your thoughts in the comment below if you agree or disagree with my view. Lets help each other. Cheers.💚

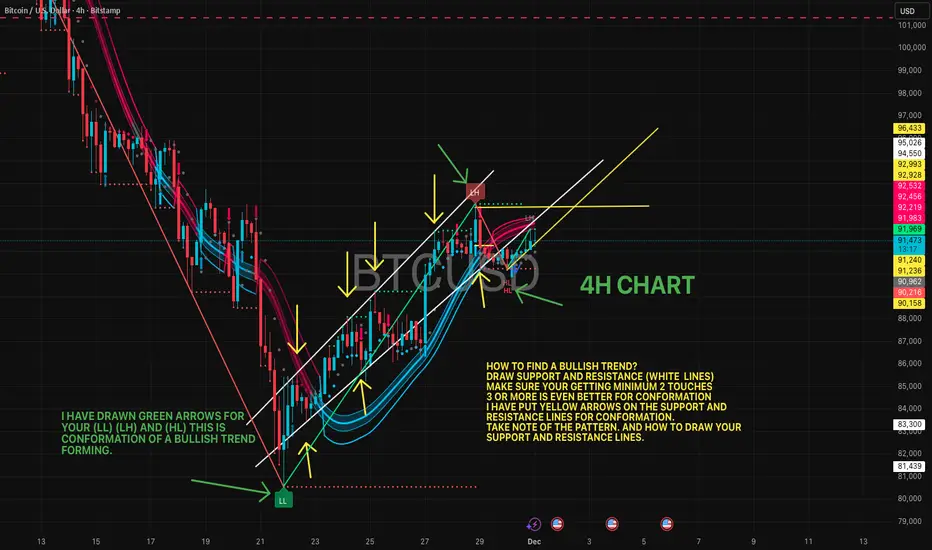
BTCUSD 4H Bullish setupBitcoin is showing a strong bullish structure on the 4H chart.
Price is currently holding above the EMA ribbon and rejecting the lower band with clear buying pressure — a typical sign of continuation after a corrective pullback.
🔶 Bullish Confluences
Price holding above dynamic support (EMA cloud turning green).
Higher-low formation after the recent sell-off, signaling buyers stepping in.
Fibonacci channel support respected, with price bouncing from the midline.
Strong candle reaction from the 0.382 retracement zone, often a bullish continuation level.
Upside liquidity sitting above 93.3k and 95.5k, attractive magnet for price.
🎯 Fibonacci Extension Targets
TP1 – 38.20%: ~93,525
TP2 – 61.80%: ~94,876
TP3 – 100%: ~97,063
If momentum increases, price could push toward the 100k zone again, with extended targets beyond.

BTC – Big Money Breaks the OB, New Sell Zone ActivatedAfter a clean break below the previous VNShark Order Block with heavy selling volume, BTC is now revealing a new layer of institutional intent.
Here’s what stands out on the chart:
1. Strong Downtrend Structure
BTC continues to respect the macro downtrend line, confirming bearish pressure remains dominant.
2. Previous Order Block is Now Broken
The earlier VNShark OB has been taken out decisively — not a wick break, but a full-body displacement candle.
This signals real Big Money involvement.
3. Fresh Sell Zone Formed Above
Price pulled back slightly but failed to reclaim the broken OB, creating a new Sell Zone where institutional orders are likely stacked.
4. High Volume Confirms the Move
The strong breakout candle shows one of the highest volumes this week — a clear footprint of large players.
Trading Insight
As long as price stays below the broken OB, the downtrend remains intact.
A retest into the Sell Zone may offer a clean continuation opportunity toward the next liquidity target around 82,000–83,000.
⚠️ Risk Reminder
Always manage position size carefully — BTC volatility can shift aggressively around macro levels.
✒️ VNShark Signature
VNShark OB — Big Money • Order Blocks • Liquidity.
Following institutional footprints to understand where price truly wants to go.
#BTC #Bitcoin #OrderBlock #SmartMoney #BigMoney #Liquidity #VNSharkOB #TechnicalAnalysis #Crypto

Bitcoin Just Dropped a Message. Ignore It at Your Own Risk.Bitcoin Just Dropped a Message. Ignore It at Your Own Risk 🚨
Bitcoin just did it.
Yes, it finally broke the big ascending trendline that had been guiding the market for months. And not by accident. This break comes exactly 18 months after the halving , a moment we had already discussed in earlier articles.
For many cycles, the 18-month mark has signaled exhaustion , a point where trends weaken and a deeper shift begins. This time, BTC respected the pattern again .
Each line is a BTC cycle starting at each halving. Except the first one which was ver y fast and agressive, all cycles end at the 18 months mark. And just look what happens during the next year... a kid could see the pattern!!
But let’s zoom in.
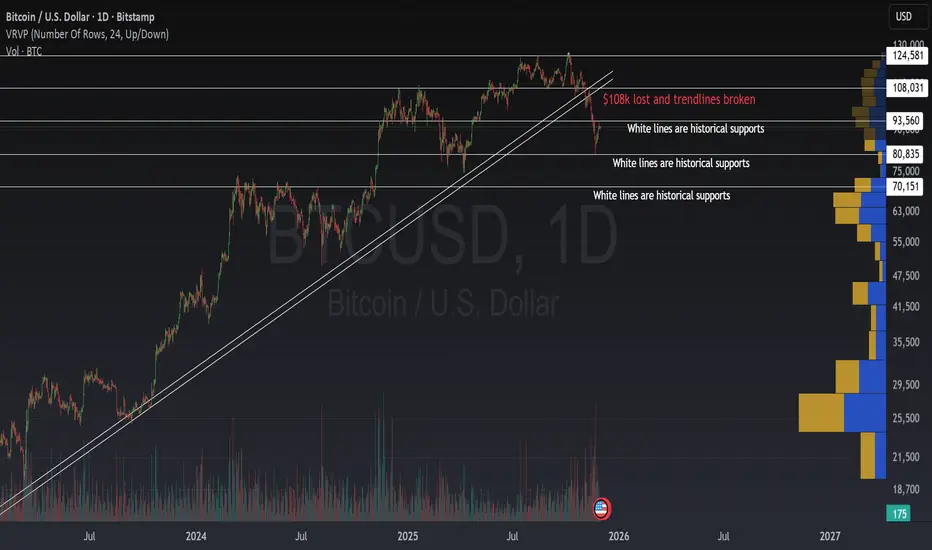
On the chart, BTC didn’t just break the trendline. It also lost the $108k level , a key resistance-turned-support that buyers had protected again and again .
Once that level was gone, the chart opened the door for lower levels.
And guess what? Bitcoin has been touching, and respecting, every one of the white historical support lines drawn on the chart.
This behavior is not random.
This is structure.
This is how big money moves, and you must do the same to stay alive.
In the previous article, I showed you how institutions mark their buying and selling levels . These are zones where the risk-reward becomes exceptional. The difference between knowing them and ignoring them is simple:
👉 If you don’t know these levels, you’re trading blind.
That’s why BTC is reacting exactly where it should. These white support lines aren’t just lines. They are footprints, the footprints of the players who actually move the market .
So… What Now?
A broken trendline.
A lost $108k.
A dance on historical supports.
A perfect timing of the Top of the cycle.
This is not the end of the story, it’s the setup for the next chapter and a confirmation of what will happen NEXT.
I will share the exact levels where this drop should end and WHEN , not only the price, but also how to profit from the next move with low risk as we have been done this whole year in the bull market.
We are entering one of those rare moments where the market gives a clear map , if you know how to read it.
Stay sharp. Stay ready. The next big opportunity is closer than most think.
🚀 Check my signature to learn more!!
Historical Bitcoin ATH drawdown to Fib retrace and % decline
Bitcoin ATH drawdown to Fib retrace and % decline
2011 to 0.236 retrace = =92.41%
2013 to 0.236 retrace = -78.27%
2017 to 0.382 retrace = -82.20%
2021 to 0.5 retrace = -76.40%
Also note how PA bounces off the 50 Week SMA ( Red ) after every ATH except for in 2011. I have only included the 2011 High as it also reached down the the 0.236 after ATH.
But it Must be remembered that the 2011 High is NOT in any channels. It did however, become the support and origin of the current Lower line of Long Term support.
Every other ATH had a draw down to the 50 week SMA, a bounce higher and then fell through the SMA. (2017 is slightly different but this is still valid )
The 2021 Bounce led to a new ATH for the first time.
Currently from Current 2025 ATH, we have still not reached the 0.236 on the current draw Down but we have fallen through the 50 week SMA for the first time this Cycle.
This is VERY different from previous Cycles. You will also note how PA has previously bounced off the 50 SMA 3 times this cycle already, on or very near a Fib line..
Again, Very different behaviour.
However, as you can see from the main chart, we have used Every single Fib line on the way up. It was fairly similar in the lead up to the 2017 ATH.
To me, this validates these Fib lines.
But What I want to look at is how the 2021 PA went to an ATH, retraced back to its own 0.236 line, on the 50 Week SMA ( Red), bounced to a New ATH and then Draw down, a small bounce and fell through the 50 SMA.
That second draw down did not reach the 236 > it bounced up till it collided with the 50 week SMA and then went into a full on Bear.
All that happened between the 0 and the 0.236 Fib Retrace lines, untill it fell through .
To many extents, Bitcoin PA is repeating this.
We hit a new ATH in Jan 2025, retreated to the current 0.236 and the 50 Week SMA, bounced to a New ATH in October and have been in retreat since, never yet reaching the 0.236 again.
I am currently looking to see when current PA hits the 50 week SMA.
The 50 week SMA will be Met, at current trajectory around the 100K usdt mark.
Then, if we follow the 2021 pattern, PA will get rejected and we will eventually head to the 44K zone on the 0.5 Fib retrace. Which also happens to be the line that PA bounced off in 2021, its 0.236 fib line.
That is around a -63% retrace. LESS than previous retracements.
That follows the 2021 route.
Current PA is also stil running between the 0 and the 0.236 fib retracement lines. As the 2 ATH's did in 2021. We do seem to be following a simialr Technical pattern.
Look back though the other ATH and see how the 236 was used.
BUT if we look back to the previous Fib retrace lines..We seem to be going to the next Fib retracement level sown after each ATH, before a meaningful bounce.
2013 to 0.236 retrace
2017 to 0.382 retrace
2021 to 0.5 retrace
If we follow This, the next for this cycle could be the 0.618, which sits at 34,966 usdt
I do yet think this will Happen and 7here is NO guareantee this will happen but I have found it very interesting how PA is repeating a number of patterns, certainly, currently, the similarity to the 2021 ATH structures.
Another was From October 2021 till June 2025, we had PA running a near perfect copy of the 2013 to 2017 Fracel.
This has now changed and we follow a later route
This Can obviously get Broken completely by Fundamentals....which are Mental right now.
And then, we have the Shouts of "This time is Different. "
YES and NO.
As this post shows, there are many similarities and yet, at the same time, The way PA has reacted and moved this cycle, if it is a cycle, is also unique,,,
And another reason for that, is studied in earlier posts about "The Blur Arc of resistance"
And we may well just keep on going to a New higher ATH in 2026.
While the current draw down has been painful, there is no confirmed Bear market yet
I hope this gets you thinking.....Enjoy....
I would love to hear yur Views

BTC/USD – 2H Chart Pattern..📊 BTC/USD – 2H Technical Breakdown
What my chart shows:
A clean breakout above a long descending trendline
Strong bullish impulse candle
Price breaking above the Ichimoku Kumo (cloud) → momentum flip bullish
A rectangular consolidation zone below price (accumulation zone)
My chart already indicates a “Target Point” around ≈ $102,000
BTC currently around $91,200–$91,300
This setup suggests bullish continuation after trendline reversal.
---
🎯 BTC/USD Targets Based on This Structure
TARGET 1 — Immediate breakout extension
➤ $94,500 – $95,000
Why?
First clean liquidity pocket above current price
Matches prior micro-structure breakdown
Short-term bullish continuation zone
---
TARGET 2 — Momentum continuation zone
➤ $98,000 – $99,000
Why?
Major psychological resistance
Last swing imbalance before my marked target
Often acts as a magnet after a trendline breakout
---
TARGET 3 — The Major Target I Plotted
➤ $101,500 – $102,500
Why?
This matches the “Target Point” shown in your image
Aligns with higher-timeframe unfilled liquidity
Strong resistance from historical price memory
Typical completion of a breakout projection (measured move)
---
🛑 Invalidation / Risk Zone
➤ Breakdown below $88,500 – $89,000
Would pull BTC back into the previous consolidation range
Weakens bullish continuation expectations
---
📌 Summary Table
Target Price Zone Reason
Target 1 $94.5K – $95K First liquidity zone
Target 2 $98K – $99K Momentum continuation
Target 3 $101.5K – $102.5K Major measured-move target (my chart)
Invalidation $88.5K – $89K Re-entry into consolidation box

Wave 4 Trap Complete as Bitcoin Prepares for Final Flush6 Days Ago:
3 Days Ago:
1 December 2025
BTC moved into the expected corrective zone last week but stayed inside the falling channel, showing that wave 4 was only a temporary bounce. Buyers failed to break any key resistance, and momentum kept fading. This kept the broader outlook bearish and hinted that wave 5 was still pending.
BTC has now broken below the short-term rising structure, confirming that wave 4 topped out near the 0.786 retracement. The rejection from that zone triggered a clean shift back into the main downtrend, with price sliding toward the key 86,280 support. As long as BTC holds below the upper channel boundary, the market remains positioned for further downside, with the 1.618 extension around 79,650 emerging as the next probable target for wave 5 completion.
Note:
The rejection from the 0.786–resistance zone shows buyers failed to take control.
Wave B at 86,280 is the immediate pivot level; staying below it keeps downside pressure intact.
The next major target for wave 5 sits near the 1.618 extension around 79,650.

Bear market trend continuesDon't expect things to turn bullish untill BTC breaks out of this trendline

BTC : Channel Breakdown RetestPrice has come back to retest the broken channel and is being rejected again. What matters now is to see if buyers can sustain follow‑through, because that will decide if this is just a relief bounce or the start of a real reversal. For now, it still looks like nothing more than a bounce.
Historically, when Bitcoin reaches oversold territory on the daily RSI, it often forms a bullish divergence rather than reversing immediately on the first oversold tag, price makes a lower low while RSI prints a higher low.
My scenario anticipates another push down in price while RSI refuses to make a new low, creating a classic bullish divergence that frequently precedes strong relief rallies.
This price action still fits my broader strategy, as the current rejection and potential bullish divergence keep the scenario alive for another leg up in December, with upside potential toward at least the 115k

BITCOIN 4 years cycle repeating?
View the chart and you'll understand what I mean.
What do you think?

Elise | BTCUSD 4H — Break of Bearish Structure |BITSTAMP:BTCUSD
Price previously rejected from the major corrective zone and continued bearish until a final liquidity grab created imbalance and shift of character. The recent breakout from the bearish channel and bullish momentum suggests institutional repositioning, preparing for upside continuation toward higher correction levels.
Key Scenarios
🚀 Bullish Case (Primary Bias)
If price re-tests and holds above 93,500–95,300, upside continuation is expected:
🎯 Target 1: 100,500
🎯 Target 2: 105,800
🎯 Target 3: 116,200 (Major Correction Zone)
📉 Bearish Case (Invalidation)
A clean breakdown below 88,500 would shift bias back to bearish and may revisit the liquidity grab zone.
Current Levels to Watch
Entry Zone: 93,500–95,300
Support: 88,500
First Breakout Confirmation: Above 96,000
⚠️ Disclaimer: This analysis is for educational purposes only — not financial advice.

BTC ANAYLSISBTC HERE WILL FALL BADLY NOT BE COUSE ANY OF THE CRASH OR ETC BUT BECOUSE OF FCP which chart tells us that to trade WHAT you SEE COINBASE:BTCUSD

Bitcoin Short: Stop above $93,800This is a short bitcoin idea where the preferred counts are in green (long) and the alternate counts (long) is in red.
For preferred count, we are still in a downtrend and bitcoin will continue down in a 5th wave.
For the alternate count, the downtrend has ended as Cycle wave 2 of 5, and we will be going into a Cycle wave 3 of 5 up.

Bitcoin To 102K?Technical analysis is just a way to make a slightly more informed educated guess and to manage risk. That said, my base case has been that the low was around 80K - at least for a while. Even if we are entering a bear market (I don’t think so), the 50 MA on the weekly should be tested as resistance, as it always has been in the past. That means we should see price rising to the $102K area before getting more definitive information.
That’s what I am looking for at the moment.
Educated guess.
The weekly looks promising.

Finally, clear rejection on trendline. Time to short BTC75k is programmed, only a matter of time now. Is there anybody crazy enough to buy here? I think NOT

$BTCUSD - #Bitcoin cycle analysisHi guys! 👋🏻
🔔I'd like to share with you my current Bitcoin BTCUSD analysis here.
🔔 The last correction is taking an impulse 5-wave structure, it seeems like we are about to complete the 5th wave of the Intermediate A, bounce back to $102K to complete the B and drop back to the levels near $70K - 64K to complete the correction.
🔔 I know it sounds disappointing but we need a correction to regain power. Now, before throwing tomatoes, please see cycle charts below. And never underestimate the power and rules of cycles in the market.
🔔 Why channels always matter
🔔Wave paths
🔔Fibo
🔔 Path to $150K shall look like this
🔔Concetration of Supports and Resistances
Sharing for educational purposes!
✊🏻 Good luck with your trades! ✊🏻
If you like the idea hit the 👍🏻 button, follow me for more ideas.

Bullish move incoming if breaks $92,500strong bullish move incoming with support and resistance lines in place with your HH's and HL's. very strong trend. Please note from the latest updates that a break above $92,500 where my LH is placed and waiting for a breakthrough on the chart it could lead to gain towards 97-$100,000, while failure may drop to $85,000.
BTC is Bearish 81400 Head & Shoulders Pattern Good morning
As you can see easy to spot head and shoulders pattern for this Bearish move for BTC with a target of $81,400 range and yes we can go lower however in this trade this is currently the target.
Any questions or struggling with understand on how to trade BTC let us know more than happy to help
Mindbloome Exchange/ Kris
