Buy Stop ideaThe liquidity grab caused by trumps 100% tariffs on china has fueled enough liquidity for price to revert back to 120k.
If price doesn’t trigger our stop order before 21st of October then price has more liquidity inducement to carry out before the move so we delete the untriggered order
BTCUSDT.3L trade ideas

BTC/USDT Analysis. Will longs resume pt.2?
Hello everyone! This is CryptoRobotics trader-analyst, and here’s the daily market overview.
Yesterday, our main scenario on Bitcoin played out — the price dropped to the buying zone at $120,400–$119,400 (selling absorption) and showed an initial reaction.
At the moment, there’s abnormal activity from a limit buyer, who continues to absorb most of the market selling. However, market buyers are not yet taking initiative, keeping the market in an accumulation phase.
We expect a retest of $120,600 (local buyer aggression) or a sweep of the local low. If a strong reaction appears, long positions with a favorable risk-to-reward ratio can be considered.
It’s quite possible that from this level we’ll see a renewed wave of buying and a move toward the all-time high.
Buy zones:
$120,600 (local buyer aggression)
$116,700–$115,000 (pushing volumes, strong graphical imbalance)
$112,500–$111,500 (mirror zone, volume anomalies)
$110,000–$108,800 (strong selling absorption)
This publication is not financial advice.

BTC analysisBitcoin has broken below the support area and is currently testing the support range of $120,000 to $121,000. A drop below $120,000 would be bearish and could lead to further declines. A test of the $125,000 level is anticipated in the coming days.

Harmonic Pattern made ...Hello everyone
According to the chart that you can see the price of BTC was completed the harmonic pattern and according to the rules of the classical technical we expect the market after some correction rise up to the PRZ level that we shown and after that we update the analysis.
Be your hero
AA

BTC Pullback to $117K?”Bitcoin has recently reached a new all-time high. However, after such a strong upward move, the market could enter a correction phase, potentially pulling back to around $117,000 before continuing the larger trend.

BTC Fake-Out Play – Clean Catch
📊 Current Setup
Man, that fake-out off the trendline was textbook 🔥 — classic move that shakes out the weak hands before ripping back up. I caught that wave for a quick scalp, locked in my gains when the target hit 💰. Position size was on the heavier side, so I played it safe — no regrets, just a clean ride 🌊.
🚦 What’s Next
Here’s the interesting part — this setup still has legs 👀.
👉 If BTC keeps holding above that reclaimed zone, the momentum’s got room to push toward the previous highs again.
👉 But if price slips back below the breakout base, it’s just another short-term fade before the next setup forms.
🧭 My Take
Right now, I’m sittin’ on profits and watchin’ how price behaves around that support zone. If buyers keep control, this quick scalp could evolve into a sweet swing 🏄♂️⚡. Stay alert — the market’s moving slick today, and it’s rewarding precision, not prediction.
💬 What do you think about this scenario? Only share your idea if you’ve got another opinion — otherwise just hit that button 👍

BTC/USDT Bullish Channel – Eyes on $130K Targets🔍 Key Observations:
Trend Direction: Bullish
Price is moving consistently within an upward sloping channel, suggesting a strong and steady uptrend.
Current Price: ~$124,353
Price is near the lower boundary of the channel, indicating a possible bounce opportunity to ride the trend higher.
Targets:
Target 1: $128,001
Target 2: $130,100
These are potential resistance zones or profit-taking levels if the bullish move continues.
Structure:
The marked zig-zag path suggests anticipated higher highs and higher lows, in line with a typical channel-based bullish continuation.

BTC/USDT – Roadmap Toward $150K and BeyondIn previous analysis, we highlighted that BTC is in a re-accumulation phase, ranging above one of the most important trendlines of the current cycle. For more than 80 days, price has repeatedly tested this zone, each time showing strong bounces and rapid reactions, confirming the significance of this level.
This sustained consolidation above the “magic trendline” is laying the groundwork for the next leg into price discovery. Should BTC achieve a decisive close above the red resistance box, the roadmap points toward a medium-term target of $150K, with the potential to extend further toward the $222K zone as liquidity unlocks and trend momentum accelerates.

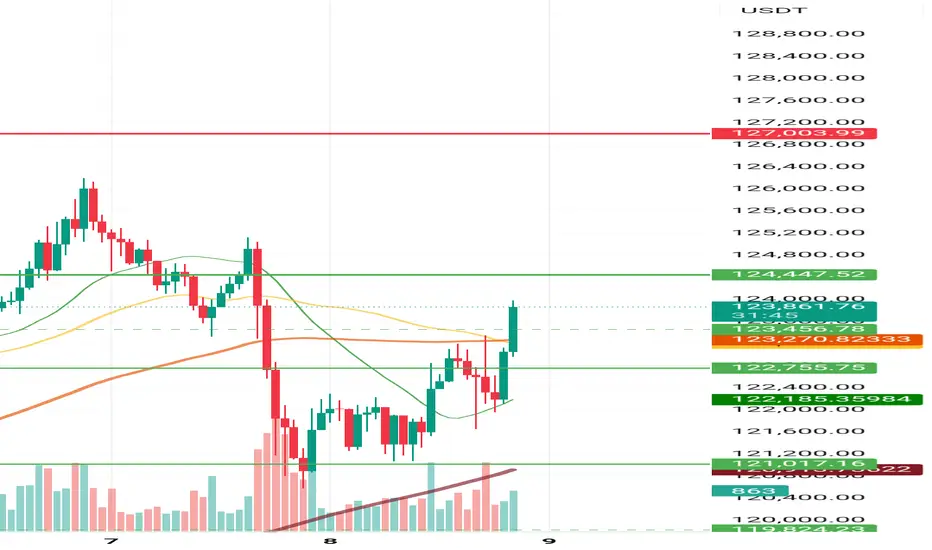
Btc going downBitcoin is currently trading around 122,000 – 123,000, approaching the key resistance zone of 124,500 – 123,300. I expect the price to show a rejection or a stop-hunt above this resistance before entering a bearish move.
Bearish Targets:
• 🎯 Target 1: 108,000 – 107,200 (short-term support)
• 🎯 Target 2: 105,000 (key support)
• 🎯 Target 3: 100,000 – 102,000 (major base zone)
• 🎯 Final Target: 94,000 – 95,000 (liquidity pool below)
Reasons for this scenario:
• Liquidity resting above 124,500 with a high chance of stop-hunt
• Presence of unfilled FVGs (fair value gaps) below
• Untested base/support zones between 100K – 94K

“BTC: The Green Gamble"111,500 — that’s where the game begins.
Next stop: 105,500 … the so-called green zone.
maybe from here or from 113.700
If that zone breaks down, forget “support.”
It’s not support — it’s a massacre waiting to happen. 🩸
And the numbers below aren’t just lower, they’re darker.
But… if that green gets hunted above the diagonal,
don’t be shocked when BTC slings higher than your imagination.
This isn’t about trendlines or candles.
It’s about blood, patience, and who rules the board.
The wolf doesn’t guess.
The wolf just waits… and takes. 🐺🌑

Bitcoin Parallel Channel Master Analysis🟦 Parallel Channel Overview
The chart reveals a well-established ascending parallel channel, guiding Bitcoin’s price action over an extended period.
The upper and lower bounds have been respected multiple times, validating the strength and consistency of this trend structure.
Price currently hovers near the midline, following a bounce from the lower boundary, indicating the channel remains intact and bullish momentum is supported.
🧭 Current Price Action
A recent dip tested the lower boundary and was met with strong buying interest — a bullish sign.
Price is now pressing up against the midline, which acts as a crucial pivot:
A successful flip of the midline to support could propel the price toward the upper channel boundary.
A failure here may trigger another retest of the lower support.
📌 Key Structural Levels
Lower Channel Support: The primary demand zone; a breakdown here could suggest a broader structural change.
Midline (Median): The dynamic pivot — the battleground for bulls and bears.
Upper Channel Resistance: Where profit-taking or breakout acceleration typically occurs.
🔁 Repeating Breakout Pattern: Timeline & Insights
🔹 1st Breakout – February 2024
Price breaks above the channel and sets a new high.
Eventually retraces back into the channel.
In August 2024, the break out area from February becomes midline support, validating the zone.
🔹 2nd Breakout – November 2024
Another breakout occurs, reaching a peak roughly equal to the first breakout.
In April 2025, price once again retests the midline, mimicking the previous August retest behavior.
🟡 Pattern Recognized
Breakout → Peak → Pullback to Midline Support → Reaccumulation → Breakout
With this repeating structure, a 3rd breakout is likely, assuming midline support holds.
Based on historical intervals:
Feb to Nov 2024 = ~9 months
Aug to Nov = ~3 months
This positions the next breakout for June 2025, following the April retest.
🔮 Projected Outcome: 3rd Breakout
If the vertical breakout range repeats:
3rd breakout peak could mirror the height of previous breakouts.
⚖️ Summary & Strategic Implications
✅ Structure is bullish as long as Bitcoin trades within or above the channel.
✅ Midline bounces have reliably preceded breakouts — current April 2025 retest strengthens that thesis.
✅ June 2025 becomes a critical breakout watch window.
❌ Break below the midline would invalidate the repeating breakout structure and shift focus to lower support zones.

Outlook on BTCLooking at the chart #btc is currently retracing to mitigate some key areas in the bullish trend. I have indicated where I think #btc could reach by tomorrow.

Bitcoin Breaks Through Key Resistance – Eyes on 127K and Beyond
📈 Bitcoin Technical Analysis – Breakout Above Key Resistance Zone
After a healthy correction, Bitcoin found strong support around the 121,000 USDT level, where it formed a solid base and initiated a bullish reversal. This support zone has historically acted as a pivotal level, and the recent reaction confirms its continued relevance.
The price successfully broke through the 122,755–123,000 USDT resistance range, which had previously taken over 34 hours to breach. This time, the breakout was more decisive, backed by a surge in volume and reinforced by the 50-hour and 100-hour moving averages, both converging near the resistance zone and adding to its significance.
🔍 Key Observations:
- Volume Spike: A noticeable increase in trading volume accompanied the breakout, suggesting strong buying interest.
- Trend Line Support: The ascending maroon trend line continues to hold, indicating sustained bullish momentum.
- Moving Averages: The alignment of short- and medium-term MAs below the price adds further confirmation to the breakout.
- Historical Context: The previous struggle to break this resistance highlights the strength of the current move.
🚀 Outlook: With this resistance now flipped into support, we anticipate a more aggressive rally in the coming sessions. The next potential targets lie at 127,000 USDT and 136,000 USDT, which align with previous swing highs and psychological levels.
Traders should watch for consolidation above the breakout zone and monitor volume for signs of continuation. A retest of the 123K level could offer a secondary entry opportunity for those waiting on confirmation.
BTC Upside target move possible for monday closeLook for a buy position in BTCUSD from 0.5 level or 122565 level after 3 PM EST New York time
TP-1 123,780
TP-2 124,589
TP-3 126 208
THIS IS NOT A TRADE ADVISE. JUST FOR LEARNING PURPOSES
Long BTC📊 BTC Market Update
Weekly TF: BTC is closing with a bullish weekly candle, signaling strong momentum continuation.
4H TF: Price has broken above the range high and is now retesting it as support — a classic breakout-retest setup.
✅ Long Bias
Structure and momentum align with a long entry, with favorable R:R as outlined in the chart.
Breakout confirmation on the retest strengthens the case for continuation to higher targets.
⚠️ Key to Monitor
Hold above the reclaimed range high.
Volume confirmation on the retest for sustainability.
Macro events and BTC dominance shifts that could affect follow-through.
Disclaimer:
This analysis is based on my personnal views and is not a financial advice. Risk is under your control.

BTCNEW UPDATE (1D)In the previous analysis, we considered Bitcoin’s scenario as a triangle, which has now failed.
It now appears that this is not a triangle but a diametric pattern. Currently, it seems we are in the middle of wave F. The potential corrections we expect are buying opportunities, and we will look to buy within the green box if a correction occurs.
The target for wave E could be between 138K and 140K.
A daily candle closing below the invalidation level will nullify this analysis.
invalidation level : $106418
For risk management, please don't forget stop loss and capital management
Comment if you have any questions
Thank You

BTC - Weekly Breakout!📈 BTC has already broken out of its correction phase and is holding strong above $118k.
As long as $118k holds, the next targets sit between $126k–$140k.
Only a drop below $114k would delay the bullish outlook.
Trend remains strongly bullish after the breakout.
⚠️ Disclaimer: Not financial advice. Manage risk properly.
All Strategies Are Good; If Managed Properly!
~Richard Nasr.

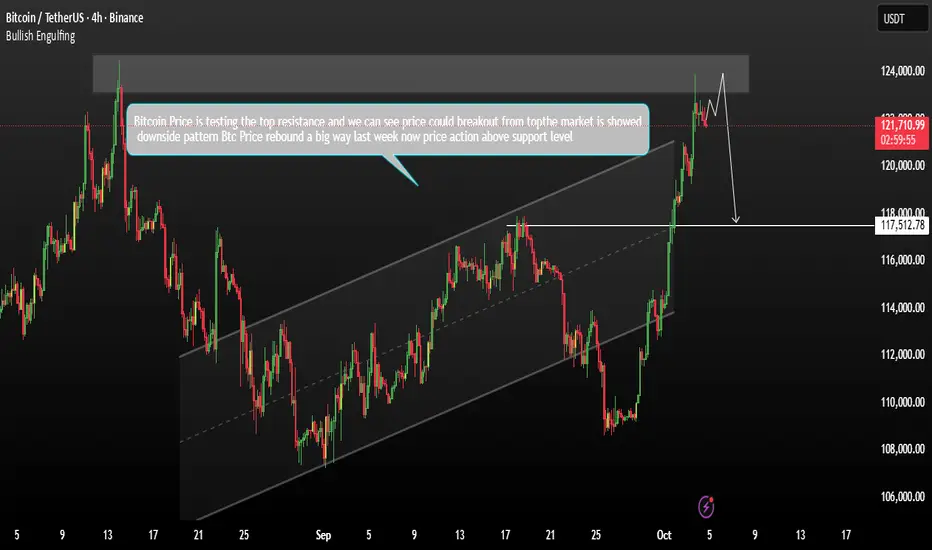
Bitcoin Showed Breakout zone from top SideBitcoin’s price is currently testing a new all-time-high zone and encountering strong resistance around 123,000. A false breakout has formed at this level, and the market has entered a phase of local consolidation.
Price action is now moving aggressively toward testing the uptrend support zone. While a retest of 123,000 cannot be completely ruled out, technical signals from Friday’s sell-off — including profit-taking and a long upper shadow on the daily candlestick — suggest that a medium-term correction is likely.
I expect Bitcoin to retrace toward the local break-even / imbalance zone near 117,500 before attempting another move to the upside.
You may find more details in the chart.
Trade wisely best of Luck Buddies.
Ps; Support with like and comments for better analysis Thanks for Supporting.
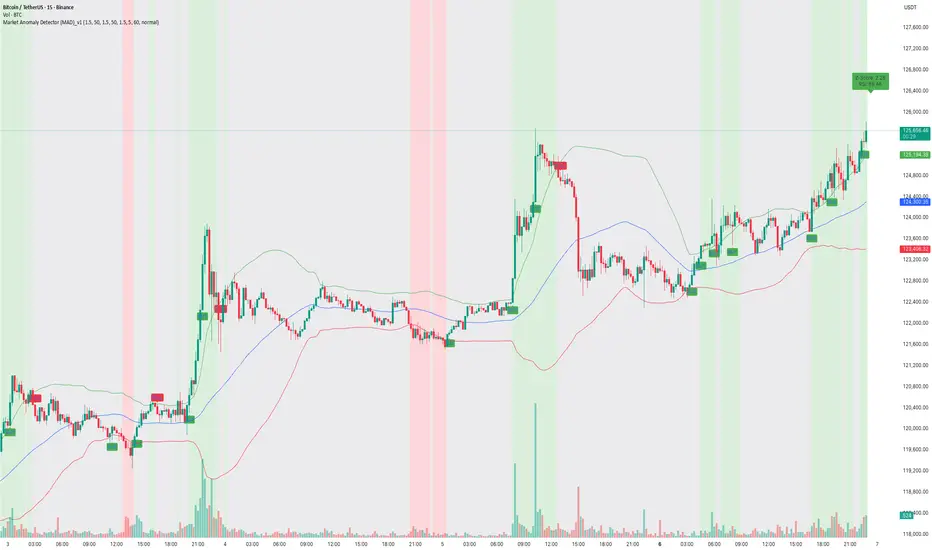
How to capture trend using MAD Indicator!📝 Description:
Watch how the Market Anomaly Detector (MAD) precisely captured the start of the Bitcoin breakout on the 15-minute chart — with no lag, early confirmation, and clear signals.
This BTC/USDT rally was flagged using:
• ✅ Z-Score Spike + RSI confirmation
• ✅ Volume Thrust + Trend Strength Filter
• ✅ Dynamic Zone Coloring for Visual Clarity
• ✅ Trade Cooldown Filter to avoid signal noise
💡 The green background highlights anomaly confirmation zones, while red indicates potential fakeouts or traps.
In this rally:
• The MAD indicator identified the compression breakout
• Maintained bullish zone with no false exit
• Generated a clean trend-following environment using adaptive logic.
🔍 Why MAD Works:
The MAD Indicator isn’t just about spotting anomalies — it adapts based on:
• Market volatility and relative volume
• Internal momentum using z-score logic
• Confirmation from RSI & EMAs
• A cooldown filter to prevent overtrading in choppy zones
📈 Perfect for scalpers, intraday traders, and short-term swing setups on crypto and stocks.
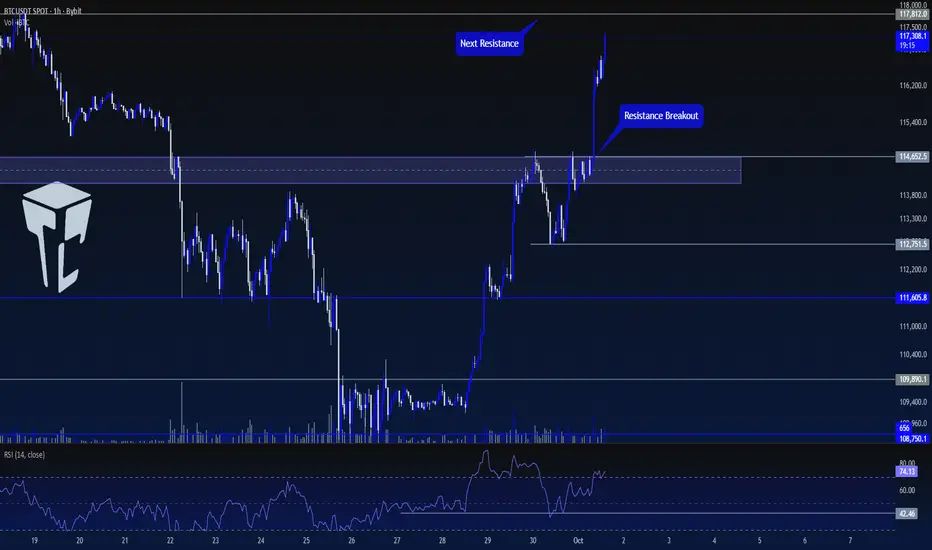
TradeCityPro | Bitcoin Daily Analysis #185👋 Welcome to TradeCity Pro!
Let’s move on to the Bitcoin analysis. Bitcoin’s bullish trend is still continuing, and today during the London session it made another upward move. Let’s review today’s triggers together.
⏳ 1-Hour Timeframe
Yesterday, after the correction, Bitcoin formed a bottom at 112751 and with the RSI being supported at 42.46, the upward move started.
🔔 The trigger we had yesterday for opening a position was the breakout of the resistance zone, with the exact trigger forming at 114652. After the breakout, the price started its second upward wave.
💥 The RSI oscillator has also entered the Overbuy zone, and the market momentum is fully bullish. The next resistance we have is at 117812.
💫 If the price reaches 117812 and the RSI exits the Overbuy zone, we can take profit on the position.
✅ For a new position, no fresh trigger can be given right now because the price is moving sharply upward, and opening any new position here would be considered risky with a high chance of hitting stop-loss.
📊 The area I expect the price to react to is 117812, but I will wait for the price to first build a structure before opening a position.
❌ Disclaimer ❌
Trading futures is highly risky and dangerous. If you're not an expert, these triggers may not be suitable for you. You should first learn risk and capital management. You can also use the educational content from this channel.
Finally, these triggers reflect my personal opinions on price action, and the market may move completely against this analysis. So, do your own research before opening any position.
Forecast for BTCUSDT 4th October 2026 (Updated)Forecast for BTC for the next 4 weeks. Continuation to ~$125k followed by a retrace to ~$113k and a bounce, followed by continuation down to ~$104k for a bottoming before new all-time-high towards ~$150k-$170k.

BTC: Growth from $109KOn September 28, Bitcoin turned into an upward movement on the 1-hour chart from the $109,804 zone. From this level, the market went through all four stages of profit-taking and reached $120,999, giving a potential difference of more than $11,000 per coin. Those who followed the system were able to capture the maximum from this trend.
The key point here is how the movement was managed. The algorithm highlighted important zones, helped secure the position in time, and reduced risks. No emotions, no guessing—just a step-by-step process where every action was clear in advance and confirmed by market structure.
For beginners, such a tool works like a navigator: it shows where it’s safer to lock in profits and when it makes sense to hold longer. In conditions of high volatility, discipline, automation, and technical analysis become the main advantage. That’s what turns the market from a chaotic game into a structured process. An interesting fact I’ve noticed is that this indicator shows an 84% win rate on Bitcoin trades.

