BITCOIN DAILYBITCOIN OVERSIGHT AND CORRECTIONS FOR EDUCATIONAL PURPOSE ONLY
(1)DEMAND FLOOR AT 109,060.77 was a retest to the neckline of double bottom a bullish price action signal on daily candle close as illustrated from our line chart and it came with another confluence from an ascending trendline to add more impetus to the buy rally and many missed and lost money too.
(2) SUPPLY ROOF 117,383.70 a previous demand floor on daily after break of structure it became supply roof and stopped upswing twice ,but due to buy rally that key level is broken after 2 retested attempt ,on technical a broken supply roof is now our demand floor except the sell order exceed buy order that zone 117,383.70 holds support on daily candle close .
(3) 123,387-124,478.66-125k daily supply roof and our current all time high .
this zone has an ascending trendline connecting the two highs and on technical the next high should be 127,071-128k for sell in the direction of the previous two all time highs(123,387-124,478.66)
my ideal zone to attempt sell should be 127,071-128k zone
note ;you can avoid selling and wait for buy zone 117,383.70 and its possible tat price wont return to this level.
trading is 100% a game of probability.(win/loss) comes with it.
No holy gril,nothing like best strategy.
what we have is masters in RISK MANAGEMENT,THE BEST TRADERS ARE EXPERTS IN RISK MANAGEMENT,THEY ALL HAVE ZERO EMOTION,THEY DONT CHASE WHAT IS LOST.
GOODLUCK
#BITCOIN #BTCUSDT #BTC #CRYTO
BTCUSDT.3L trade ideas

Bitcoin Channel Analysis - Breakout or Breakdown Incoming?Bitcoin has been trading within a pristine ascending channel for nearly a year and is now at a critical decision point after rejecting from key resistance.
The Setup:
📊 Pattern Formation: Year-Long Ascending Channel
- Clean parallel channel structure established since early 2024
- Lower boundary providing consistent support with multiple successful tests
- Upper boundary acting as strong resistance, most recently at $121,682
- Mid-channel support zone around $115,000-$117,000 has been reliable
- Current price: $122,205, consolidating after rejection from upper resistance
🎯 Potential Targets:
Bullish Scenario: $130,000-$135,000 zone
- Measured move from channel breakout above $122,500
- Continuation of the established uptrend structure
- Next major psychological level at $130K
Bearish Scenario: $105,000-$108,000 zone
- Drop to lower channel boundary if current support fails
- Would still maintain channel integrity
- Critical support at $100,000 - breakdown below invalidates entire structure
What to Watch For Validation:
✅ Decisive Close Above $122,500
- Need a strong 4-hour or daily candle close above this level to confirm breakout
- Not just a wick testing - require solid body close with conviction
- Previous resistance at $121,682 must flip to support
✅ Volume Surge
- Breakout must occur with significantly elevated volume
- Recent volume has been declining during consolidation (visible in lower panel)
- Need at least 2-3x average volume to confirm genuine buying pressure
✅ Support Hold at Mid-Channel
- Current pullback testing $115,000-$117,000 zone
- This area has provided multiple bounces throughout the channel
- Strong bounce with increasing volume = bullish continuation signal
✅ Follow-Through Above $125,000
- After confirming breakout, price should push toward $130K relatively quickly
- Hesitation or immediate rejection would suggest weak momentum
- Watch for sustained trade above previous resistance
Key Levels:
🔸 Resistance: $121,682 (recent rejection) → $122,500 (breakout confirmation) → $130,000 (target)
🔸 Support: $115,000-$117,000 (mid-channel) → $105,000-$108,000 (lower channel) → $100,000 (invalidation level)
🔸 Volume Context Declining volume during pullback is actually bullish - suggests lack of seller aggression
Pattern Context:
Ascending channels represent sustained bullish momentum with well-defined risk parameters. The current consolidation near the upper boundary, combined with declining volume, suggests coiling energy for the next significant move. The 9-day pullback of -7.55% is healthy profit-taking, not distribution.
Invalidation Signals:
❌ Break and close below $112,000 with volume
❌ Breakdown through lower channel boundary (~$105K)
❌ Multiple failed attempts at $122,500 with declining volume
❌ Close below $100,000 = trend reversal confirmed
The channel must resolve. Bitcoin is compressing near resistance after a year of respecting this structure. A breakout above $122,500 with volume opens the door to $130K+. However, failure to hold mid-channel support could send us to test the lower boundary around $105K.
Watch for that decisive move - volume will tell the story.
Not financial advice - DYOR.

Will US Gov Shutdown Continue to Support Bitcoin Prices?Fundamental approach:
- Bitcoin prices this week have been driven by renewed risk appetite and positive spot ETF inflows, with sentiment supported by the US government shutdown’s data blackout and expectations of further Fed easing as labor market signals soften. The institutional demand narrative strengthened as US spot ETFs returned to inflows, with assets under management remaining elevated, thereby bolstering dip-buying interest.
- Drivers included a modest uptick in the ISM manufacturing PMI, which is still in contraction, and ADP private payrolls showing job losses, reinforcing the view that looser policy could persist and liquidity conditions may remain supportive for the crypto beta. The shutdown has curtailed government data releases, prompting markets to rely on private indicators and amplifying sensitivity to risk sentiment and ETF flow headlines throughout the week.
- Bitcoin prices could sustain momentum if ETF inflows remain positive and macro uncertainty keeps rate-cut expectations intact, though volatility may rise with limited official data.
Technical approach:
- BTCUSD broke the triangle pattern and rose higher, positioning itself above both EMAs, indicating an upward momentum.
- If BTCUSD remains above 117000, the price may retest the previous swing high at around 123000.
- On the contrary, closing below 117,000 may prompt BTCUSD to retest the broken triangle pattern and the area between both EMAs.
Analysis by: Dat Tong, Senior Financial Markets Strategist at Exness

BTCUSDT Potential ShortHello Traders,
BTCUSDT Potential reversal here for some big move, if this level respect it and doesnt cross 121k.
Thanks,
Minters

New sell above 123K$ with low risk setupWe are long-term bullish yet and looking for at least targets like 130K in this market but also remember that price had huge amount of rise and gain and now short-term correction is needed.
so we are looking for dump and correction to one of the major support zones mentioned on the chart.
The day will come which No one would believe BTC towards 222222Here I am expressing my Thought about BTC
if we look at the Previous Data
( TOP 10540 LOW 3621)
(LOW 3621 TOP 69198)
(TOP 69198 LOW 15443)
(LOW 15443 TOP would be 222222) by March 2026
From there we would be having two year downtrend and the LOW would be $76000 around December January 2028.
Those who believe and know this assets from the beginning they will certainly believe this possibilities .
This is not a financial advice so take your decision on your own
However everything is Possible in this world as more and more institutions are getting into it and everyday the tech is improving.
Remember me if this wild Prediction is going to be True.
Thanks,

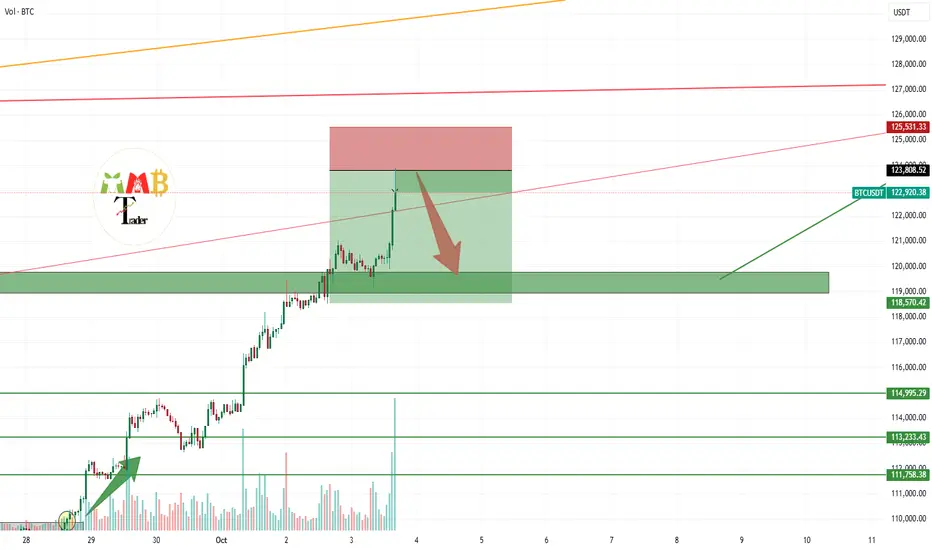
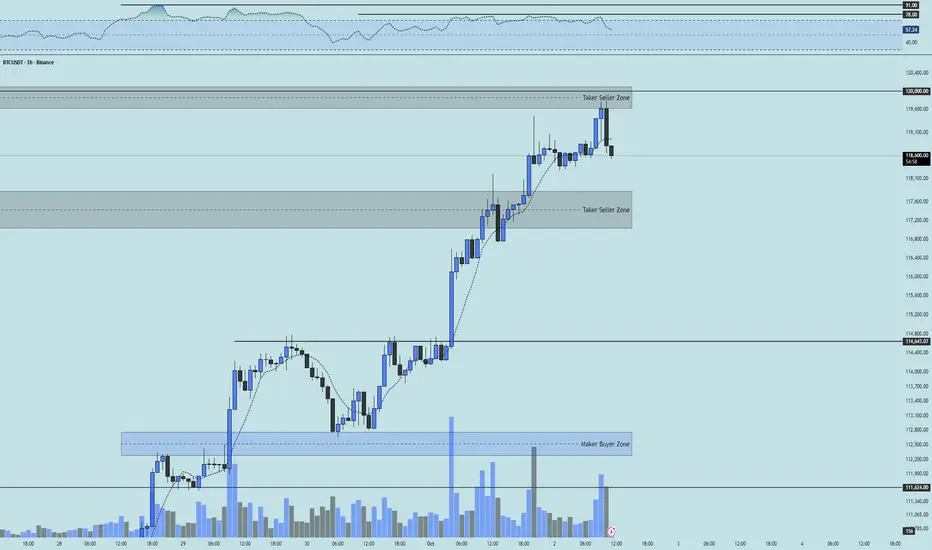
BTC 1H Analysis - Key Triggers Ahead | Day 50☃️ Welcome to the cryptos winter , I hope you’ve started your day well.
⏰ We’re analyzing BTC on the 1-Hour timeframe .
👀 On the 1H timeframe for Bitcoin, after breaking through the taker-seller zone around $117,550, price pushed up toward its resistance area near $120,000. From there, we’ve started to see early signs of rejection. With a 1H candle close rejecting this zone, we can say that after such a strong rally, Bitcoin is now entering its corrective phase, moving back toward its key support levels. Let’s break it down deeper.
🧮 The RSI oscillator, after consolidating for about 1 day and 6 hours around the overbuy boundary, has now started to exit that zone. This suggests potential downside momentum toward its key swing supports. Keep in mind, a static swing resistance formed at the 78 level in overbuy territory. If that breaks — along with the taker-seller zone — long trades could push RSI up toward 91 before facing a possible rejection (a less likely scenario for now). At this stage, I don’t have a clear key support zone to highlight, but with corrective structure forming, I’ll point out the levels to watch in future updates.
🕯 Today’s buying candles expanded slightly in size and volume following the weaker USD news. However, because the move up has been sharp and the number of selling candles limited, hitting the taker-seller zone increases the probability of a pullback. A strong close with solid selling volume would confirm corrective pressure for Bitcoin.
🧠 I believe the smarter approach is to wait for the corrective structure to play out first. Once the new resistance levels are defined and broken, we can look for setups. Keep in mind, shorting here isn’t ideal — the broader trend is still strongly bullish and momentum is very powerful. The goal is to position for the next high-probability move, not fight the trend.
↗️ Long scenario: A Bitcoin long could be considered on a clean break above RSI 78 combined with a strong candle close above the marked taker-seller zone, ideally supported by increasing buy volume. Multi-timeframe candle setups would give stronger confirmation for entry.
📉 Short scenario: At the moment, I don’t see a high-probability short setup. Long positions are simply carrying more edge (and dopamine).
❤️ Disclaimer : This analysis is purely based on my personal opinion and I only trade if the stated triggers are activated .

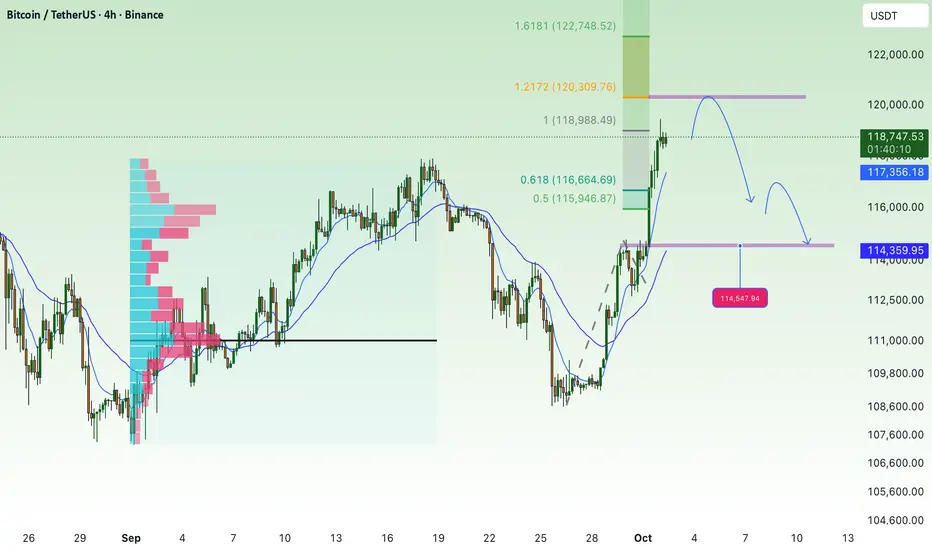
Be careful with the continued downward correction.BTC Plan Analysis
Currently, BTC has rallied strongly toward the 118,700 – 118,800 zone and is testing the 1.0 Fibonacci resistance. This area may trigger short-term profit-taking.
Main outlook: After a sharp rally, the market is likely to see a corrective move.
Key Levels
Resistance:
118,800 – 119,000 (near-term resistance, currently being tested)
120,428 (strong resistance on the higher timeframe)
122,500 (major resistance, extended wave target)
Support:
116,485 (Fibo 0.786, important confluence support)
114,837 (previous resistance turned support + EMA200)
114,150 – 114,050 (lower support, Fibo 0.236)
Possible Scenarios
BTC may face selling pressure at 118,800 – 119,000, leading to a correction back to 116,500.
If 116,500 breaks, the next support zone is 114,800 – 114,000.
If BTC holds above 116,500 and bounces, the market will likely retest the higher resistance at 120,400 – 122,500.
👉 Summary: Price is currently at short-term resistance. It’s better to wait for a reaction before making decisions. The correction toward 116.5K remains the primary scenario before the next clear move.
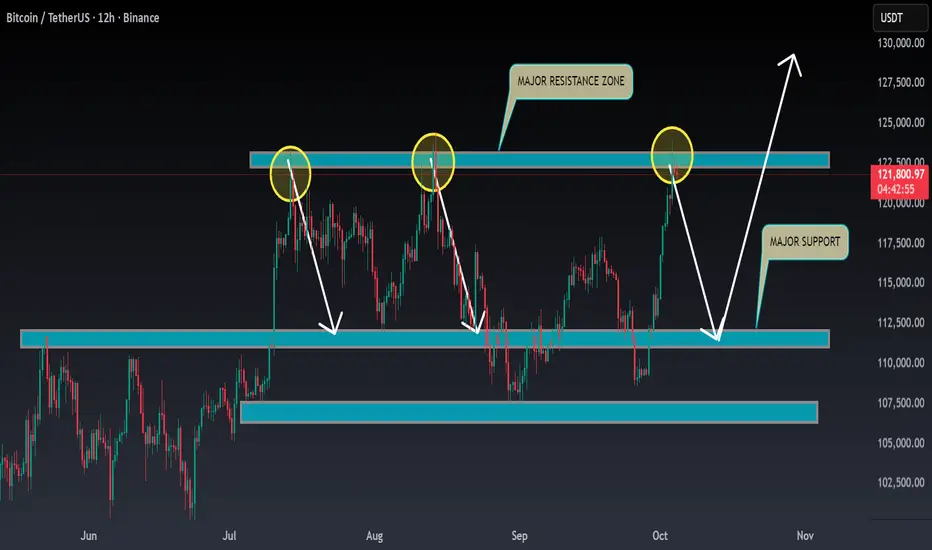
BTC ANALYSIS🔮 #BTC Analysis 🚀🚀
💲💲 #BTC is trading between support and resistance area. There is a potential rejection again from its resistance zone and pullback from support zone. If #BTC breaks the major resistance zone then we would see a bullish move or else we will get a downfall towards its major support zone
💸Current Price -- $1,21,800
⁉️ What to do?
- We have marked crucial levels in the chart . We can trade according to the chart and make some profits. 🚀💸
#BTC #Cryptocurrency #DYOR
BTCUSD BITCOIN ADVANCED STRUCTURE BITCOIN OVERSIGHT AND CORRECTIONS FOR EDUCATIONAL PURPOSE ONLY
(1)DEMAND FLOOR AT 109,060.77 was a retest to the neckline of double bottom a bullish price action signal on daily candle close as illustrated from our line chart and it came with another confluence from an ascending trendline to add more impetus to the buy rally and many missed and lost money too.
(2) SUPPLY ROOF 117,383.70 a previous demand floor on daily after break of structure it became supply roof and stopped upswing twice ,but due to buy rally that key level is broken after 2 retested attempt ,on technical a broken supply roof is now our demand floor except the sell order exceed buy order that zone 117,383.70 holds support on daily candle close .
(3) 123,387-124,478.66-125k daily supply roof and our current all time high .
this zone has an ascending trendline connecting the two highs and on technical the next high should be 127,071-128k for sell in the direction of the previous two all time highs(123,387-124,478.66)
my ideal zone to attempt sell should be 127,071-128k zone
note ;you can avoid selling and wait for buy zone 117,383.70 and its possible tat price wont return to this level.
trading is 100% a game of probability.(win/loss) comes with it.
No holy gril,nothing like best strategy.
what we have is masters in RISK MANAGEMENT,THE BEST TRADERS ARE EXPERTS IN RISK MANAGEMENT,THEY ALL HAVE ZERO EMOTION,THEY DONT CHASE WHAT IS LOST.
GOODLUCK
#BITCOIN #BTCUSDT #BTC #CRYTO

BTC.D & BTC TOPI feel strongly that this next higher high will be BTC’s last. Hopefully BTC.D can support our alts, because BTC looks done.

Bloody October ?Always manage your own risks this is not a investment advise, I am not responsible neither your loss nor profit.

BITCOIN SIGNAL: LEVERAGE DRIVEN PUMP! (where it ends??!)Yello Paradisers! Enjoy the video!
And Paradisers! Keep in mind to trade only with a proper professional trading strategy. Wait for confirmations. Play with tactics. This is the only way you can be long-term profitable.
Remember, don’t trade without confirmations. Wait for them before creating a trade. Be disciplined, patient, and emotionally controlled. Only trade the highest probability setups with the greatest risk to reward ratio. This will ensure that you become a long-term profitable professional trader.
Don't be a gambler. Don't try to get rich quick. Make sure that your trading is professionally based on proper strategies and trade tactics.

First Major Bounce 81.1kThe last Short was clearly premature, and was based purely on a technical level. Volume bust through it. Had I have waited for a stall and confirmed Distribution, the situation would have been better.
Now that Shorts have been wiped, and the majority of the market is in a Long, I believe we can now drop to the first major bounce at 81.1k.
When one side starts winning for an extended period of time, the losing side becomes "Unfavourable". Many who opened a Short and lost, fear opening another.

This will shock you, BTCUSDT Cup and Handle on WeeklyJust tested the built-in indicator, it is interesting, on Weekly chart Bitcoin seems that it formed a Cup and Handle Pattern. This could mean 2x from this level lol. Not financial advise, just interesting what the indicator shows as an educational idea.

No one wants to sell BTC anymore?Bitcoin has reached a new ATH, and it’s time to take a look at the chart to see how strong this trend is and whether it can continue:
➡️ Money Flow shows a powerful liquidity spike, meaning the trend is supported by new money inflows. However, the indicator still shows a divergence that has persisted since November 2024. Every new ATH since then has been set with decreasing capital inflows into Bitcoin.
This means it’s not that everyone is rushing to buy Bitcoin with billions — it’s that no one wants to sell, and we’re getting closer to a supply shock. Bitcoin reserves on exchanges keep hitting new lows each month.
➡️ The Dynamic Supply and Demand indicator only confirms this theory — there’s simply no supply zone left. No one wants to sell. The price right now is battling only short traders on futures.
During the recent rise, the GAP I mentioned earlier — between $124,400 and $119,100 — was closed. So this rally was exactly what we expected!
⚡️ What’s next?
If the price manages to hold above the $123,000 support, the growth will likely continue toward the next target at $130,000.
If not, the first target becomes $120,000 — the nearest support and a minor psychological level. Also, during the rise, a GAP formed between $118,900 and $113,230. So if the price fails to hold at current levels, a retest of that area can also be expected.

Bitcoin Consolidates Above Support — Main Trend IntactBitcoin (BTC/USDT) — Holding Strong Above Key Support Zones 💪
Bitcoin continues to trade above the low-timeframe support at $122,100, showing resilience and consolidation after its recent upward move.
✅ Low Time Frame Support ($122.1K): BTC remains stable above this short-term structure, suggesting buyers are still in control.
✅ Main Trend Support ($110.2K): The larger bullish structure remains intact as long as price holds above the $110.2K region.
📈 Momentum Outlook: A sustained hold above $122K could set up another push toward $126K–$130K, confirming bullish continuation.
Summary:
BTC remains bullish above both its low-timeframe and main-trend levels. Short-term consolidation is healthy, and the next breakout could target new local highs if momentum strengthens.
🎯 Support: $122.1K / $110.2K
🎯 Resistance: $126K / $130K
📊 Bias: Bullish continuation

Shorting BTC.2-Month on BTC is closing and it doesn't look great. Monthly is getting rejected as well. Daily currently as of now doesn't look good. Taking a short position.

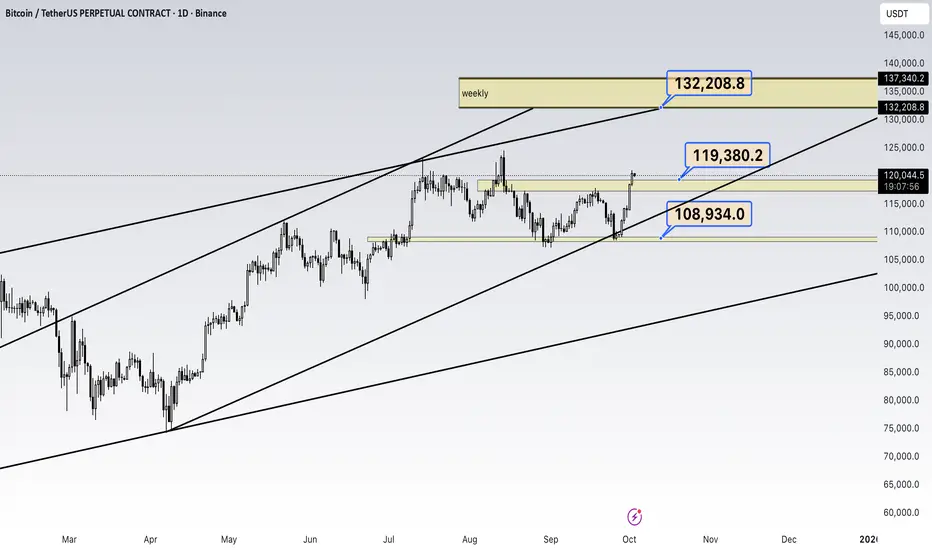
What is the next level in Bitcoin?On weekly timeframe, we had a macro liquidity on 109.000$ that made the chart to move to 119.000$ level. If the price firm on this level in weeky timeframe, it can go to the next level that is 132.000$
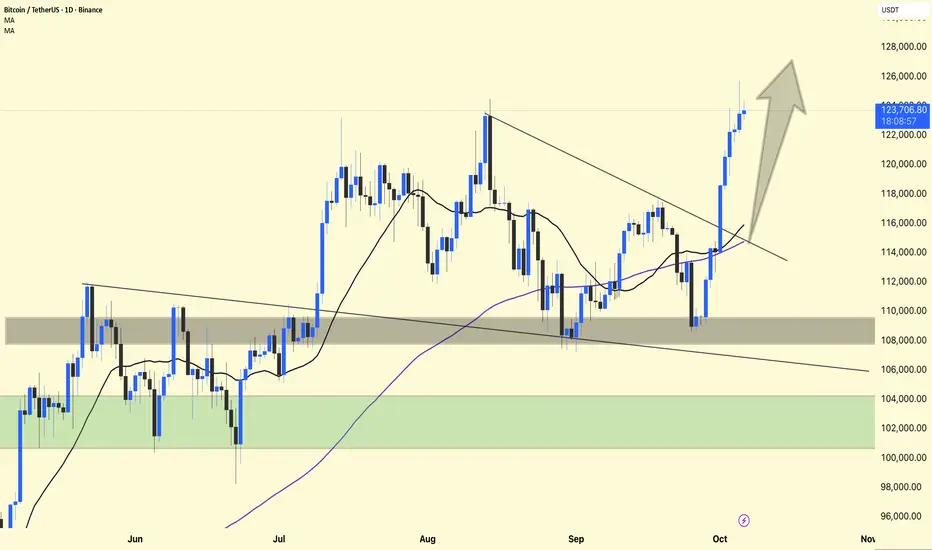
Bitcoin Technical Update – Strong Breakout!Bitcoin has successfully broken out of the descending trendline that had been holding the price down for several weeks. This breakout confirms a shift in market structure from bearish to bullish.
After finding strong support around the $110,000-$112,000 area, BTC bounced sharply and reclaimed both the 21-day and 100-day moving averages – a powerful bullish signal. As long as the price remains above $115,000 to $116,000, we can expect continued upward momentum.
The current move shows healthy strength with volume support, indicating strong buyer interest. If momentum persists, the next potential target is around the $125,000-$128,000 area, where some profit-taking could occur.
Support: $115,000 – $116,000 (previous resistance turned support)
Resistance: $125,000 – $128,000 (short-term target area)
Currently, the upside remains in bullish favor. If the market structure remains stable, any decline towards $116,000-$118,000 could provide a potential buying opportunity.
Remember: Avoid blindly chasing breakouts. Allow the price to retest or consolidate before entering — patience pays off in trend trades.
BTC LAST CALL BEFORE TAKE OFF??!!This area should be the last opportunity for entry before we might see the biggest bull run in the history (institution + retail FOMO). 115-116K might be a sweet spot for entry before BTC continues the rally.
DYOR ! NFA
-MaxVesting

Bitcoin Range Analysis: 110k-124k Breakout WatchHello everyone, as we can see, Bitcoin has bounced off the last major support at 109-110k. Currently, the latest resistance is at 124k, so the range to play in at the moment is 110-124k. We are waiting to see if the range will be broken upwards or downwards.
