Btcusdt This disgraced will go down to 115k 114k no reason why it keeps going up . Gold and stocks index hitting all time high every other day , this will end up very bad soon
Trade ideas

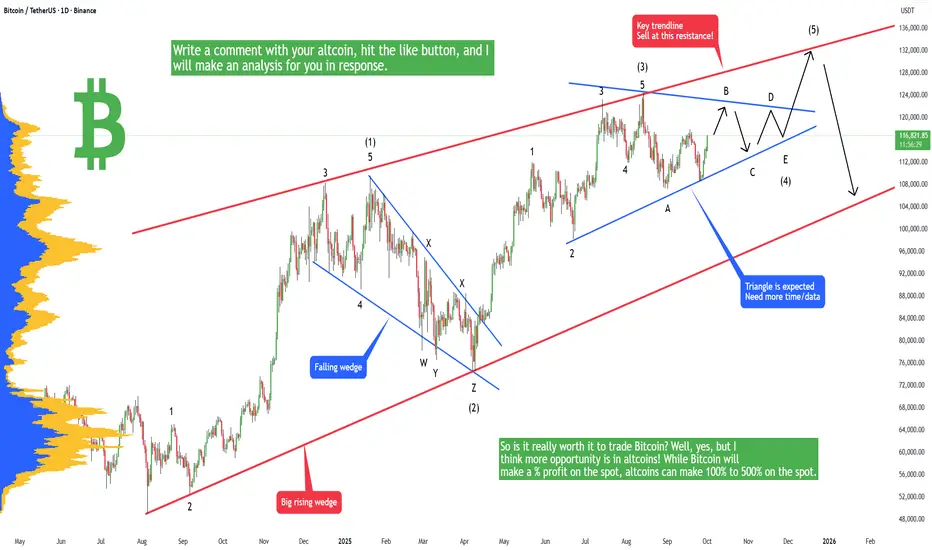
Bitcoin - LifeTime opportunity if you read this!Bitcoin is in the last stage of the current bull market (from 15k to 130k) and you definitely want to know where to sell otherwise you can experience a huge loss in 2026. You don't want to watch your portfolio dropping by 50% to 80%. You probably already know that the market is completely manipulated by banks and huge institutions, so you have to trade with big money. In the Elliott Wave theory there is a well-known fact that triangles usually occur in the last stage of the trend, so if you see a triangle, you should be aware of this fact and act accordingly. I think this is exactly what can happen on Bitcoin during the September-October-November-December time period.
So what is the plan? I think Bitcoin may go sideways in the next weeks, as you can see on the chart, to form a triangle, and then in December we may see a big breakout to the upside. 128k to 132k is something very real for the price at the end of this year. So is it really worth it to trade Bitcoin? Well, yes, but I think more opportunity is in altcoins! While Bitcoin will make a % profit on the spot, altcoins can make 100% to 500% on the spot. Choosing the right altcoins is not that easy, but I can tell you that DOGE looks promising, and we may see a new all-time high on this coin this year! Why is DOGE a good investment in the next weeks? First, because big players, they like this coin, and they want this coin to go up. There is really no second reason, because you want to trade with big money, not against it. No, there is another reason, and it's that you like dogs and you like this MEME.
But if you are not sure about your coin, please leave me a comment + hit the like button, and I will make an analysis in response to you! Trading is not hard if you have a good coach! This is not a trade setup, as there is no stop-loss or profit target. I share my trades privately. Thank you, and I wish you successful trades!
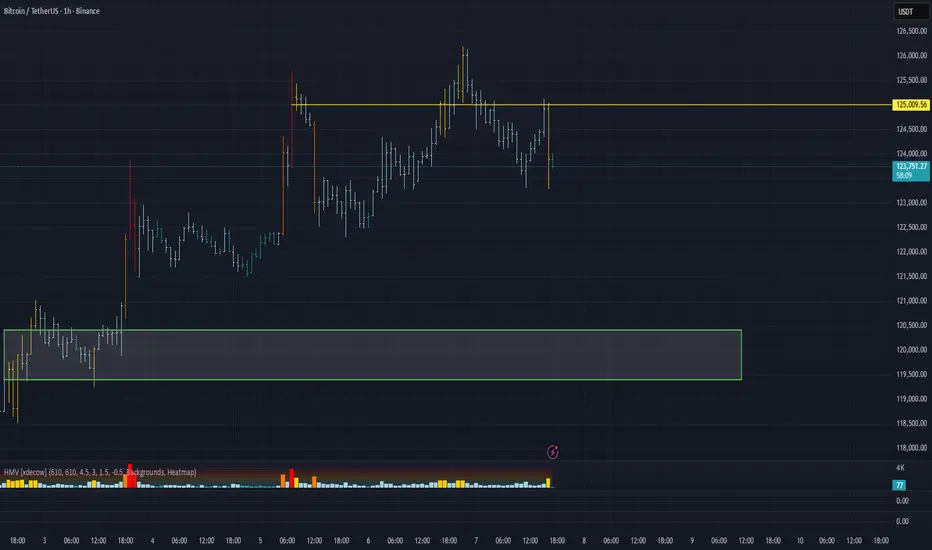
BTC/USDT | BTC Uptober Begins – Massive Rally Loading!By analyzing the Bitcoin chart on the 4-hour timeframe, we can see that the price moved exactly as expected — it hit the $118,000 target and even rallied up to $123,900 . After reaching this key supply zone, which we had marked earlier, BTC faced selling pressure and is now trading around $121,800.
If Bitcoin can hold and stabilize above $120K , we could see a new ATH soon ! “Uptober” has just begun, and it looks like we’re in for a strong bullish month. The next upside targets are $125K, $132K, and $138K.
Please support me with your likes and comments to motivate me to share more analysis with you and share your opinion about the possible trend of this chart with me !
Best Regards , Arman Shaban

Bitcoin (BTC/USD) - Bullish Breakout Alert : Targeting $130k ?🚀 Bitcoin (BTC/USD) - Bullish Breakout Alert: Targeting $130K+ in October 2025! 🚀
Hello Traders! In today's chart, I’ve analyzed Bitcoin’s recent movements. As of October 8, 2025, BTC is trading above $123,500, showing an 8.6% surge last week. Following September’s 5.35% gain, the market is in a bullish mood, aligning with the historical "Pumptober" trend.
What to Watch on the Chart:
Double Bottom Pattern: Two troughs formed near $113,000, signaling a bullish reversal. The neckline resistance at $117,300 has been broken, with the next target at $122,000-$125,000.
Symmetrical Triangle Breakout: A breakout from a two-month descending channel has occurred, indicating a sharp upside move, potentially up to $138,000.
Moving Averages: Both the 50-day MA ($118K) and 200-day MA ($115K) are rising, providing strong support. RSI at 65 is in the bullish zone but not overbought.
Volume Trend: ETF inflows ($175M+ last month) and increasing institutional buying volume suggest sustainability, potentially pushing BTC to $130K-$135K.
Prediction: If $124K holds, the target by the end of October is $131,500 (6-8% upside). Worst case, support at $118K-$120K may be tested. Long-term: $150K+ is possible in 2025 due to ETF and halving effects.
Risk: A US government shutdown or macro volatility could lead to a 5-10% dip. Always DYOR and use stop-loss!
Share your thoughts in the comments – bullish or cautious? Like & share if helpful! 📈 #Bitcoin #BTC #CryptoAnalysis #TradingView

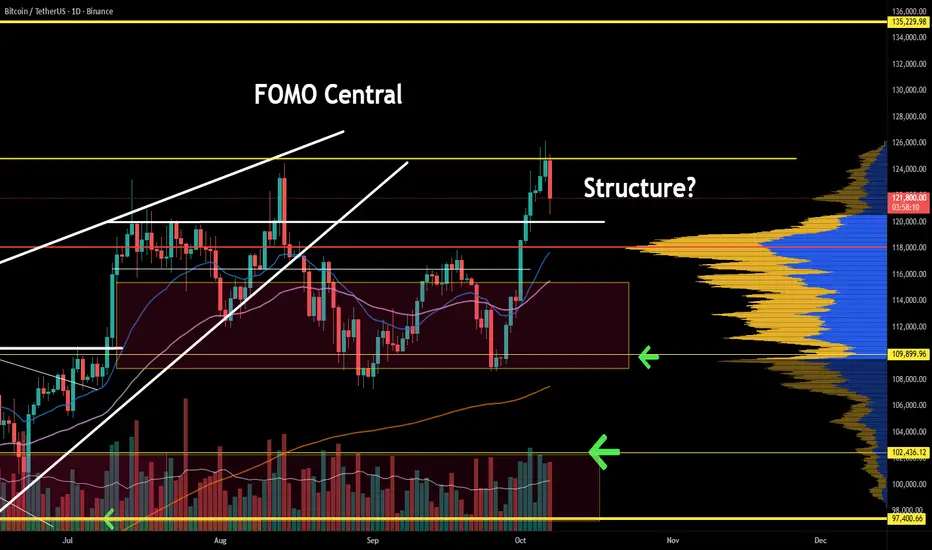
Bitcoin getting rejected at all time highBTC is preparing for another BOS; however, it seems that big players want to suppress the price. Momentum remains bullish, and so does the trend, but more importantly, the sentiment is still bullish. A bearish response that fails to produce a lower low is an opportunity to accumulate.
BTC to new ATH. Next reversal pullback at $132K-$135K$BTC. Congrats new ATH after ATH. Price heading to 132-135K zone.
I put resistance/reversal zone on the chart. Based on two different Fibonacci projections on different weekly swings.
Lets see how accurately it works. On backtesting it has been amazingly accurate. Especially when price going to discovery mode.

BTC short We have a strong MSB at 1/4h with IMB in the high zone and short reactions on imbalances, a good chance for a possible short reaction from this zone
A strong OB with imbalance and the zone above is defended as a possible manipulation of a bigger short, regardless this is a chance for a smaller but safer R, although nothing is certain with BTC . . .

BTC market snapshotBTC has reached a new high, clearing out short positions, but it’s still within the wedge pattern (a technical trend-reversal formation). Volumes indicate a weakening of momentum and the approach of a potential correction

BTC/USDT Update
📊 BTC/USDT Update
⚔️ This level is the battle line between Bulls 🐂 and Bears 🐻.
✅ Bullish as long as price holds above support.
❌ If this support breaks, expect BTC to dive below $90K 📉.
🔎 Stay alert — this zone will decide the next big move 🚀.

Harmonic Pattern made ...Hello everyone
According to the chart that you can see the price of BTC was completed the harmonic pattern and according to the rules of the classical technical we expect the market after some correction rise up to the PRZ level that we shown and after that we update the analysis.
Be your hero
AA

What if...?A rising wedge pattern in the final stages makes sense to me. We've been trading up only since 2023 and past cycles always end before everyone keep waiting for the "last leg up" to sell. Why this time should be any different?

BTC Lower highs - nose diving soonWe've seen this movie too many times. Lower highs, then crossing 50SMA / 200SMA down. We are an inch away from this happening. Never get sensitive about any of this! Follow the trend, technicals, and understand the f&ckery that is taking place. Every single time it drops, esp. when many of the people in crypto are just profit takers. Again, diminishing YoY returns, doesn't solve any real problems, high transaction cost, and still can't buy a banana with it. CBOE:MSTZ CBOE:UVIX are nice hedges and prob the only thing going up in a down market.
Best of luck and always do your DD!

Short BTC at 123,200A potential ABC correction is forming of the 30min chart, that will take BTC down to 117,400 from 123,200. The short entry also coincides with a minor support tuned resistance and SMA(200).
Short Entry - 123,200
Target - 117,500
Stop - 124400

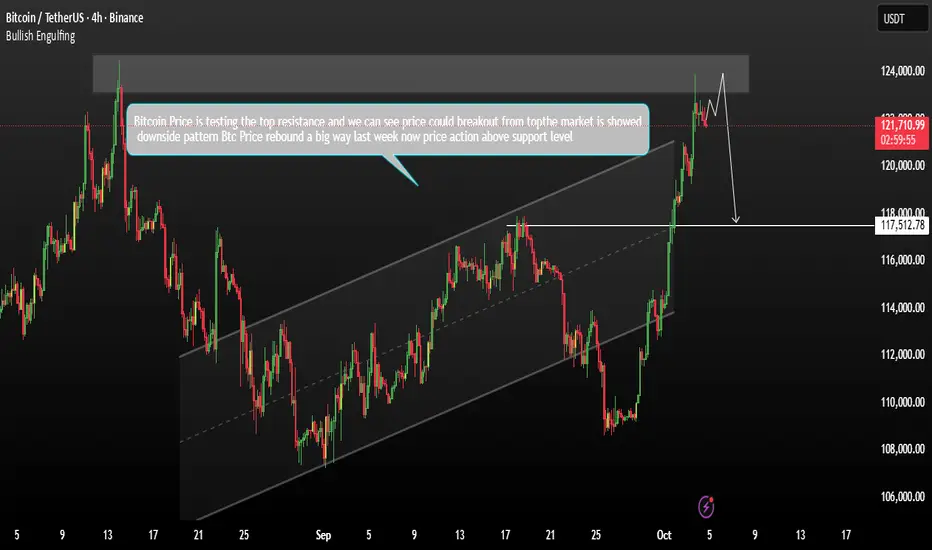
Bitcoin Showed Breakout zone from top SideBitcoin’s price is currently testing a new all-time-high zone and encountering strong resistance around 123,000. A false breakout has formed at this level, and the market has entered a phase of local consolidation.
Price action is now moving aggressively toward testing the uptrend support zone. While a retest of 123,000 cannot be completely ruled out, technical signals from Friday’s sell-off — including profit-taking and a long upper shadow on the daily candlestick — suggest that a medium-term correction is likely.
I expect Bitcoin to retrace toward the local break-even / imbalance zone near 117,500 before attempting another move to the upside.
You may find more details in the chart.
Trade wisely best of Luck Buddies.
Ps; Support with like and comments for better analysis Thanks for Supporting.
#BTCUSDT 4H ChartPrice retraced after reaching a new ATH and left a minor supply at 124k. MACD is showing some bearish weakness, RSI is neutral and EMAs are bullish. We may see price tap into our minor supply before potentially retracing again.

BTC - DAILY UPDATE#BITCOIN - Daily update 🟠 (Oct 8, 2025)
Spotted a clean bear div yesterday → pullback into 121k–120k; 118.5k possible.
Daily/weekly still constructive; no clear reversal. 📈
H1: neutral, triangle in play.
🎯Levels
Resistances:
122,800 • 123,300 • 125,000 • 125,900 💥
Supports:
121,000–120,000 • 118,500 • 115,800 🛡
Scenarios:
🟩 H1 break and close above 122,800 → room toward prior ATH.
🟨 Triangle break down or rejection near 123,000 → retest ~119,000 - 199,500 before any attempt higher.
#Alts market : will likely stay green while holds above ~115,500.

Trades for today Tuesday 10/7 BTC shortTrades for today Tuesday 10/7 BTC short....Using PAR, Pd highs and lows and divergences.

BTC Pullback to $117K?”Bitcoin has recently reached a new all-time high. However, after such a strong upward move, the market could enter a correction phase, potentially pulling back to around $117,000 before continuing the larger trend.


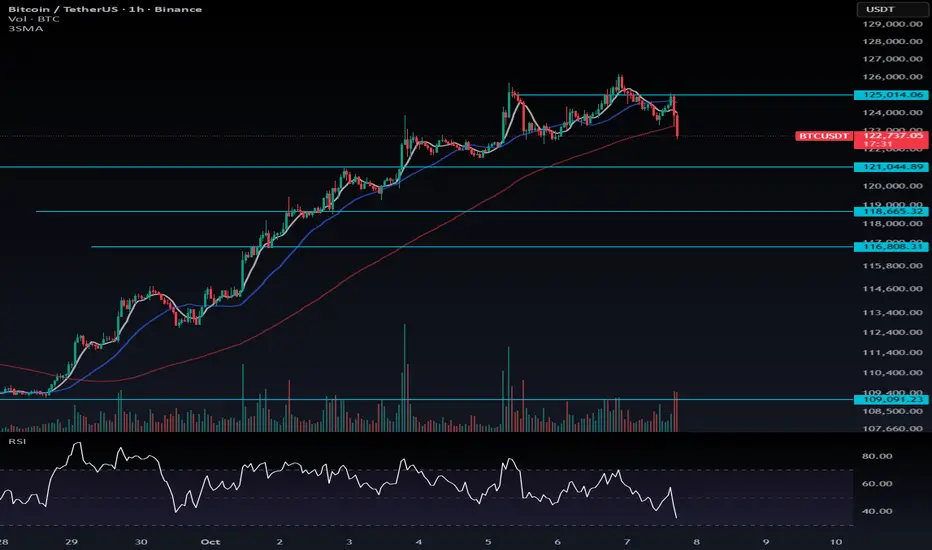
Bitcoin Correction Outlook: Healthy Pullbacks and Key LevelsDon’t fear a Bitcoin correction — embrace it. As I’ve mentioned before, a healthy trend requires both upward moves and corrections. The longer the correction takes to occur, the more powerful and volatile it can be, often accompanied by large candles.
🔹 Key Levels to Watch:
121,000: Maintaining above this level is bullish. Even if BTC dips below and fakes a breakdown, it can still be a positive sign.
Next supports: 118,665 and 116,808.
📈 Trading Note:
Above 125,000, consider long positions.
If BTC Dominance drops during a breakout, shift your focus to altcoins.
For now, observe the market carefully and wait for the right setup — patience is key.
BTC/USDT Analysis. Correction Likely
Hello everyone! This is CryptoRobotics trader-analyst with the daily market analysis.
Yesterday, Bitcoin followed our scenario, but with a slight deviation: we tested $125,000 (cluster anomalies) and retested the ATH, after which a correction followed.
At the moment, we have retested this level and received a fairly strong reaction. We expect a correction with targets at $120,000 and $116,000, or, if selling pressure is insufficient, the development of a prolonged sideways movement to accumulate liquidity for the next upward move.
Buy Zones:
$120,400–$119,400 (sales absorption)
$116,700–$115,000 (pushing volumes, strong graphical imbalance)
$112,500–$111,500 (mirror zone, volume anomalies)
$110,000–$108,800 (strong sales absorption)
This publication is not financial advice.
Positive Market - BTC Continues to Find New ATHBTCUSD Analysis
Bitcoin is currently testing the upper boundary of a long-term ascending channel, where price has previously faced rejection several times (as shown by the red arrows).
The market recently completed a strong rally toward 124K, aligning with the 1.618 Fibonacci extension (123,609) — a significant resistance zone that triggered selling pressure.
Key observations:
• Resistance area: Around 124K–125K, aligning with the upper channel line — potential for short-term correction.
• Support zones: The first support lies near 118,100, followed by 115,000–115,500, both acting as Fibonacci retracement zones.
• Possible scenarios:
1. Price may retrace toward 118K–115K to gather liquidity before another push upward.
2. If the market holds above 123K, a breakout toward 132K–133K could be confirmed.
Overall, momentum remains bullish, but the current zone requires caution — a short-term pullback is likely before the next major move.

BTC market snapshotWe’ve reached a new high, and there’s still some room to grow — maybe up to 130K — but I’m maintaining a bearish bias and skipping long entries.
😱 Monthly timeframe divergence is getting stronger, signaling that the overall momentum is fading and the market is overheated.
😱 A rising wedge has formed — a classic trend reversal pattern.
😱 Recent data shows that smart money is selling while retail is buying (judging by gold charts, big players seem to be positioning there in anticipation of a dump).
😱 Social media sentiment is overheated, full of euphoria and belief in endless growth.
😱 The real chaos in the U.S. hasn’t even started yet — the economy is in trouble.
😱 There’s a strong imbalance in open interest.
