BTCUSDTHello Traders! 👋
What are your thoughts on Bitcoin?
Bitcoin continues to move within a valid ascending channel. After a recent correction, price successfully broke above the descending trendline and reclaimed a key resistance area.
Currently, the previous high near the 120,000 level is acting as a resistance barrier. A short-term pullback toward the broken structure is expected. If this area holds as support, the price is likely to resume its upward move and attempt to break the previous high.
As long as the price holds above the support zone and the bottom of the ascending channel — and does not break below the previous low — this bullish scenario remains valid.
The medium-term outlook remains positive, and pullbacks may offer new buying opportunities.
What do you think? Will Bitcoin break above the previous high, or is a deeper correction ahead?
Don’t forget to like and share your thoughts in the comments! ❤️
Trade ideas

U.S. GOVT SHUTDOWN.WHAT HAPPENED?After Senate Republicans and Democrats failed to reach an agreement on a new continuing resolution Wednesday, the U.S. government shut down for the first time since 2019. Leaders from both parties issued statements blaming each other, and President Trump has threatened to fire more federal workers during the shutdown.
Social security payments will continue to be made, and active duty members of the U.S. military will continue to be paid. But many other government agencies will be forced to close their doors and cease operations until a new budget bill is passed by Congress.
Why it Matters
The government shutdown will affect tens of thousands of federal employees, hundreds of government agencies, and millions of people in the United States who rely on those agencies for a wide range of services. Most federal workers will be placed on leave without pay for the duration of the shutdown, and if President Trump follows through on his firing threats, for some of those workers, the shutdown could be the end of their government service.
According to the Washington Post, the lapse in funding for the federal government means crucial government functions, from small business loan services to national parks to job training for veterans, will be halted until lawmakers pass new budget legislation. Federal work deemed essential for national security will continue.
Wednesday’s budget impasse created the twenty-second federal government shutdown in the past fifty years. The longest government shutdown lasted thirty-five days in 1995, and the shortest shutdown lasted less than one day. Thus far, leaders in both major political parties have given no indications they are ready to make concessions. Cuts to health care were at the center of the dispute this time, just like they were during the 2013 shutdown, which lasted sixteen days.
The reason for the shutdown is the lack of a normal budget process in Congress. Rather than passing a budget to cover the costs of government operations for an entire fiscal year, Congress has gotten into the habit of using continuing resolutions to fund the government. A continuing resolution is a temporary measure to keep the government funding for a set period of time, but rather than being used as a stopgap measure, they have instead become the norm.
Using continuing resolutions to fund the government is at the root of much of the dysfunction in the federal government. Because without a normal budget, many agencies have no choice but to adapt their operations to the provisions of the temporary funding bills, which can curtail and interfere with normal procedures.
Will this Impact the Market ?
1. Safe-Haven Assets like Gold and BTC prices often rise during shutdowns as investors seek refuge.
2. USD Fluctuations: The U.S. dollar might weaken initially, reflecting risk-off sentiment.
3. Delayed data like the Non-Farm Payroll (NFP) report and other Economic reports.
Historical Context
Past shutdowns have had limited long-term effects on equities if resolved quickly. However, prolonged closures (like the 35-day shutdown in 2018-2019) introduced volatility and eroded confidence.
Potential Outcomes
- *Brief Shutdown*: Minimal lasting impact, historically common.
- *Extended Shutdown*: More pronounced negative effects on GDP growth and confidence.
- *Resolution*: Markets often recover swiftly once funding is restored.
Overall, the impact depends on the shutdown's duration and the broader economic context.

Bitcoin Enters Target Zone: Correction or Breakout ?In the end, the 5th wave extended, and the price has entered our expected zone. In the near term, we could see a local correction toward the trendline and the 116,230 level.
A breakout above 120,200 would be a positive signal for further growth.

Be careful with the continued downward correction.BTC Plan Analysis
Currently, BTC has rallied strongly toward the 118,700 – 118,800 zone and is testing the 1.0 Fibonacci resistance. This area may trigger short-term profit-taking.
Main outlook: After a sharp rally, the market is likely to see a corrective move.
Key Levels
Resistance:
118,800 – 119,000 (near-term resistance, currently being tested)
120,428 (strong resistance on the higher timeframe)
122,500 (major resistance, extended wave target)
Support:
116,485 (Fibo 0.786, important confluence support)
114,837 (previous resistance turned support + EMA200)
114,150 – 114,050 (lower support, Fibo 0.236)
Possible Scenarios
BTC may face selling pressure at 118,800 – 119,000, leading to a correction back to 116,500.
If 116,500 breaks, the next support zone is 114,800 – 114,000.
If BTC holds above 116,500 and bounces, the market will likely retest the higher resistance at 120,400 – 122,500.
👉 Summary: Price is currently at short-term resistance. It’s better to wait for a reaction before making decisions. The correction toward 116.5K remains the primary scenario before the next clear move.
#BTC/USDT Analysis — Pullback Before Bullish Continuation#BTC
The price is moving within a descending channel on the 4-hour frame, adhering well to it, and is heading for a strong breakout and retest.
We have a bearish trend on the RSI indicator that is about to be broken and retested, which supports the upward breakout.
There is a major support area in green at 111600, which represents a strong support point.
We are heading for consolidation above the 100 moving average.
Entry price: 111750.
First target: 112684.
Second target: 113672.
Third target: 115048.
Don't forget a simple matter: capital management.
When you reach the first target, save some money and then change your stop-loss order to an entry order.
For inquiries, please leave a comment.
Thank you.

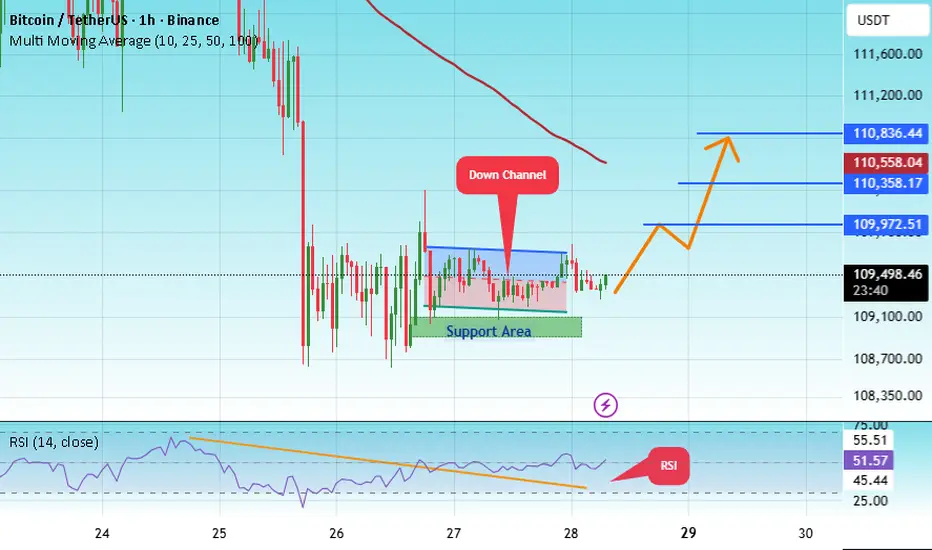
#BTC/USDT Analysis: Key Level to Watch#BTC
The price is moving within a descending channel on the 1-hour frame, adhering well to it, and is heading for a strong breakout and retest.
We have a bearish trend on the RSI indicator that is about to be broken and retested, which supports the upward breakout.
There is a major support area in green at 109100, representing a strong support point.
We are heading for consolidation above the 100 moving average.
Entry price: 109470.
First target: 109900.
Second target: 110360.
Third target: 110836.
Don't forget a simple matter: capital management.
When you reach the first target, save some money and then change your stop-loss order to an entry order.
For inquiries, please leave a comment.
Thank you.

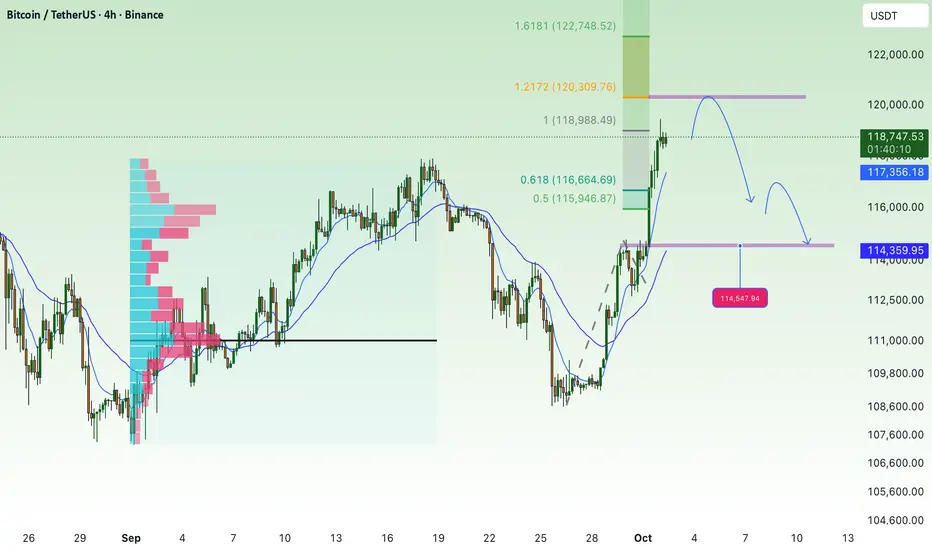
#BTCUSDT 4H ChartPrice moved up and reached the 4h breaker zone at 119k where it got rejected from as we predicted. MACD is now showing some bullish weakness, RSI is overbought and EMAs are turning bullish. We might now see a retest of the support at 117.5k before potentially expecting further bullish movements towards the next 4h supply zone at 122.5k.

DeGRAM | BTCUSD seeks to the $118k level📊 Technical Analysis
● BTC/USD bounced from the demand zone near 111K and reclaimed 114K resistance, signaling a structural shift toward bullish momentum.
● Current price action shows potential continuation with targets around 118K–124K if higher lows sustain above 112K.
💡 Fundamental Analysis
● Optimism in crypto markets is supported by rising institutional inflows and growing expectations of U.S. rate cuts, boosting risk assets.
✨ Summary
BTC/USD holds above 114K, with upside targets at 118K and 124K. Support rests at 112K for medium-term bullish continuation.
-------------------
Share your opinion in the comments and support the idea with a like. Thanks for your support!

Bitcoin growthlook this chart
whithout tecnical
auto_awesome
Translate from: Persian
Just a simple look.4How is it possible that this chart does not grow?

Will US Gov Shutdown Continue to Support Bitcoin Prices?Fundamental approach:
- Bitcoin prices this week have been driven by renewed risk appetite and positive spot ETF inflows, with sentiment supported by the US government shutdown’s data blackout and expectations of further Fed easing as labor market signals soften. The institutional demand narrative strengthened as US spot ETFs returned to inflows, with assets under management remaining elevated, thereby bolstering dip-buying interest.
- Drivers included a modest uptick in the ISM manufacturing PMI, which is still in contraction, and ADP private payrolls showing job losses, reinforcing the view that looser policy could persist and liquidity conditions may remain supportive for the crypto beta. The shutdown has curtailed government data releases, prompting markets to rely on private indicators and amplifying sensitivity to risk sentiment and ETF flow headlines throughout the week.
- Bitcoin prices could sustain momentum if ETF inflows remain positive and macro uncertainty keeps rate-cut expectations intact, though volatility may rise with limited official data.
Technical approach:
- BTCUSD broke the triangle pattern and rose higher, positioning itself above both EMAs, indicating an upward momentum.
- If BTCUSD remains above 117000, the price may retest the previous swing high at around 123000.
- On the contrary, closing below 117,000 may prompt BTCUSD to retest the broken triangle pattern and the area between both EMAs.
Analysis by: Dat Tong, Senior Financial Markets Strategist at Exness

BTC/USDT: Bullish Surge to 136K?BINANCE:BTCUSDT is gearing up for a bullish move on the daily chart , with an entry either from the current level or a pullback to the specified trendline .
The target at 136000 aligns with the next major resistance, signaling strong upside potential. Set a stop loss on a daily close below 108500 to manage risk effectively.
A break above 118000 with solid volume could trigger this surge, driven by market sentiment and BTC dominance. Watch key news! 💡
📝 Trade Plan:
✅ Entry: From current price or on a pullback to the trendline
❌ Stop Loss: Daily close below 108,500 to manage risk
🎯 Target: 136,000 (next major resistance)
Ready for this lift-off? Drop your take below! 👇

Bitcoin Reclaims Point of Control as Bulls Target New ATHBitcoin has confirmed a runaway gap on CME futures while reclaiming the point of control on Bybit. This shift turns resistance into support, setting the stage for a potential run to new highs.
Bitcoin began the week with powerful momentum, building on weekend lows to reclaim a major resistance level on futures charts. The confirmation of a runaway gap and strong close above the point of control have strengthened the bullish outlook, raising expectations for further expansion.
Key Technical Points:
- Bitcoin closed above the point of control (POC), turning it into support.
- Runaway gap on CME futures confirmed, boosting momentum.
- Dips below POC likely to be bought, indicating demand.
The CME futures chart highlighted a runaway gap that has now been confirmed, often signaling strong continuation in the dominant trend. On Bybit futures, Bitcoin followed through by closing above its long-time resistance at the POC, a decisive technical shift that suggests buyers are regaining control.
As long as the POC remains a support base, dips beneath are expected to find demand, reinforcing the bullish structure. This structural development provides a clear path for price to challenge and potentially surpass its all-time high.
What to Expect in the Coming Price Action:
Bitcoin remains highly bullish above its point of control. If support holds, momentum favors continuation toward a new all-time high, with market demand underpinning the move.

Bitcoin : Stay heavy on positionsBitcoin : Stay heavy on positions (2x~3x)
Maintaining the same outlook as before.
** This analysis is based solely on the quantification of crowd psychology.
It does not incorporate price action, trading volume, or macroeconomic indicators.

BTC LAST CALL BEFORE TAKE OFF??!!This area should be the last opportunity for entry before we might see the biggest bull run in the history (institution + retail FOMO). 115-116K might be a sweet spot for entry before BTC continues the rally.
DYOR ! NFA
-MaxVesting

BTC – Testing Ascending Channel Midline
📆 On the Daily timeframe, CRYPTOCAP:BTC is pressing against the midline resistance of the ascending channel 🚨.
This same level previously triggered a sharp rejection, sending price down toward 109,000.
A decisive move here could determine short-term direction — either a clean breakout above or another pullback toward channel support.
👀 Critical test zone to monitor closely!
Not financial advice.

BTCUSDT: Potential Reversal at Key Support👋Hello everyone, what do you think about the trend of BINANCE:BTCUSDT ?
Bitcoin is currently undergoing a short-term correction after forming a peak above $114,500. The price is now heading toward a key support zone around $110,000, which is also seen as an important confluence zone.
If Bitcoin stabilizes here and confirms the support level, we could see another potential bounce, pushing it back towards previous resistance levels. Pay attention to the possibility of a price reversal from this support zone, as it might create a buying opportunity.
What do you think about BTCUSDT? Let me know your thoughts in the comments below!
Good luck!

Trading Strategy
Hello, fellow traders!
By "Following" us, you'll always receive the latest information quickly.
Have a great day.
-------------------------------------
The conditions that lead people to start trading vary.
Before starting a trade, you should consider a trading strategy.
A trading strategy should include:
1. Investment period
2. Investment size
3. Trading method and profit realization method
You should categorize the coins (tokens) you wish to trade based on items 1-3 above.
1. The investment period is the most important.
While the investment period varies from person to person, BTC and ETH are generally considered long-term investments.
Since BTC and ETH are important coins that support the cryptocurrency market, I recommend investing in either BTC or ETH.
All coins other than BTC are broadly categorized as altcoins. However, among them, BNB, SOL, XRP, TRX, and ADA LINK, which have high market capitalizations and have been around for a long time, are suitable for mid- to long-term investment.
However, since these coins are also broadly categorized as altcoins, it's recommended to increase the number of coins (tokens) that generate income, if possible, for mid- to long-term investment.
This method involves selling the original purchase price (plus transaction fees) when the price rises, leaving the remaining coins (tokens) available for profit.
This allows you to increase the number of coins (tokens) with an average purchase price of zero, making mid- to long-term investment feasible.
While it's certainly advisable to sell your holdings to generate cash profits, this practice is not suitable for mid- to long-term investment.
This is because if you make a mistake, you could end up buying at a high price and incur losses for a long period of time.
-
2. You should determine your investment size based on your investment period.
In other words, if you're making a long-term investment and have already invested all your capital, you could miss out on good opportunities in the future.
Therefore, it's best to invest in the following order: long-term investment < mid- to long-term investment < short-term investment.
Furthermore, you should keep approximately 20% of your total investment in cash.
This allows you to trade when a good opportunity arises.
If you run out of cash after trading, try to sell when the price rises to secure cash.
Furthermore, you should avoid investing in too many coins (tokens).
-
3. Once you've determined your investment period and size, you need to find the right buy and sell points for actual trading.
Therefore, you need to define your trading method and profit-making method.
The basic trading strategy is to buy in the DOM(-60) ~ HA-Low range and sell in the HA-High ~ DOM(60) range.
However, if the price rises in the HA-High ~ DOM(60) range, a stepwise upward trend is likely, while if the price falls in the DOM(-60) ~ HA-Low range, a stepwise downward trend is likely.
Therefore, the basic trading strategy should be a split trading strategy.
In other words, if you buy in the DOM(-60) ~ HA-Low range and the price rises to form the HA-High ~ DOM(60) range, it's best to sell in splits and observe the situation.
This stabilizes your psychological state, allowing you to re-analyze the charts.
Maintaining a stable psychological state is crucial for trading.
If your psychological state is unstable, you're more likely to make unexpected trades.
Therefore, it's important to have a basic trading strategy that suits your investment style.
As mentioned earlier, to maintain a mid- to long-term investment, you need to decide whether to increase the number of coins (tokens) that generate profits or to generate cash returns. Before conducting a trade, you need to decide whether to do so.
Since the coin market is increasingly interconnected with the stock market, you can try to interpret it using the same method as the stock market.
In other words, rather than examining the flow of funds within the coin market itself, you should prioritize assessing the stock market, social issues, the economy, and politics to determine market trends.
I believe this problem stems from a lack of understanding of the coin market.
While some external factors may influence the flow of funds within the coin market, they are not suitable for predicting it.
Therefore, you should check the USDT, USDC, USDT.D, and BTC.D charts to confirm the flow of funds within the coin market.
Next, you should check the charts of the coin (token) you wish to trade to determine if it fits your basic trading strategy and develop a trading strategy.
Finally, by examining issues beyond the coin market, you can make an objective decision about your trading.
Otherwise, you will likely make inappropriate trades based on subjective opinions stemming from issues outside the coin market.
To analyze and interpret the coin market like the traditional stock market, the two markets must be integrated.
Otherwise, I believe the coin market should not be analyzed or interpreted like the stock market.
-
Thank you for reading to the end.
I wish you successful trading.
--------------------------------------------------

$BTC to $150KLast quarter is extremely bullish for BTC. It seems that it's going through a pattern after $150K it'll drop and that will be the last drop you'll see in a while, it won't be going down $100K until maybe 2027, 2026 is primed for BTC to go beyond $200K with a personal target of $260-70K a BTC.

BTCUSD NEXT POSSIBLE MOVEBitcoin has shown a strong bullish push recently and is now facing resistance at the top. From here, one of the key possible scenarios is a rejection leading to a corrective move toward the lower support zone.
If sellers gain momentum at this level, the market could shift into a downward move, testing important demand areas. However, if buyers continue to hold strength, the uptrend could sustain longer before any major pullback.
Market is currently at a crucial point — watch closely for confirmation before entering. Both directions hold potential, but probability favors a short-term correction unless strong bullish pressure breaks through resistance.

$BTC BULL RUN RALLY & Showing a WOLF PATTERN 2025Road to Bull Run 2025, price Growing upward movement starting at $108K — $115K — $122K — 128K — $136K Who Entry at $111K and using $100K stoploss.
Bitcoin trades near $116,200, rebounding from $109,000. A close above $117,500 may boost buying, while rejection could trigger profit-taking. Key support is at $113,000. Traders are anticipating a 99% chance of a 25 basis points rate cut at the next Federal Open Market Committee meeting, which is viewed as favorable for Bitcoin. Bitcoin surged past $116,000, rising nearly 3% in a single day, following the U.S. government shutdown.
Key facts: Bitcoin trades near $116,200, rebounding from $109,000. A close above $117,500 may boost buying, while rejection could trigger profit-taking. Key support is at $113,000.
#Write2Earn #BinanceSquareFamily #Binance #BTC☀ #SUBROOFFICIAL
Disclaimer: This article is for informational purposes only and does not constitute financial advice. Always conduct your own research before making any investment decisions. Digital asset prices are subject to high market risk and price volatility. The value of your investment may go down or up, and you may not get back the amount invested. You are solely responsible for your investment decisions and Binance is not available for any losses you may incur. Past performance is not a reliable predictor of future performance. You should only invest in products you are familiar with and where you understand the risks. You should carefully consider your investment experience, financial situation, investment objectives and risk tolerance and consult an independent financial adviser prior to making any investment.

Continue uptrend if..."Continue the uptrend as the price remains strong after breaking through the zone."

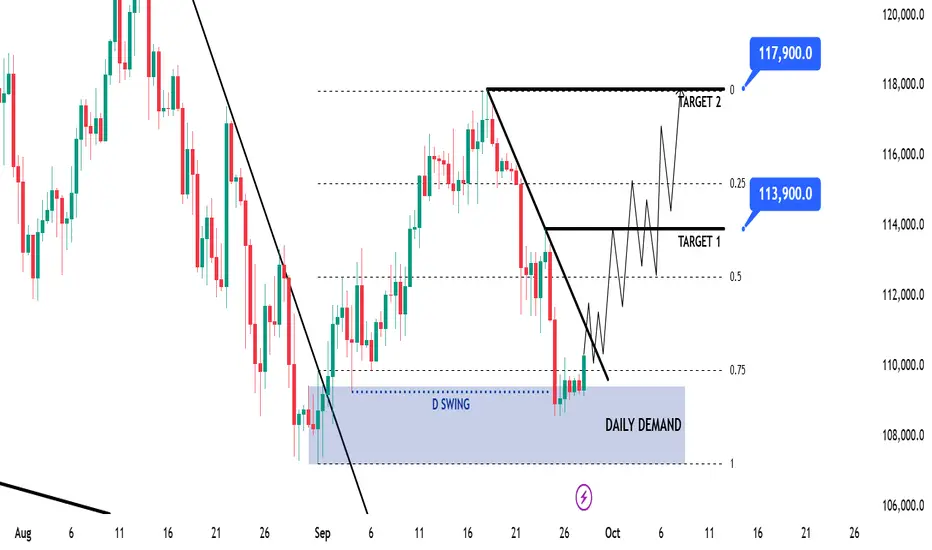
BTC Game Plan – (LDMD Model)BTC Game Plan – (LDMD Model)
📊 Market Sentiment
FED has resumed its rate-cutting cycle, starting with a 0.25% cut in September, with two more expected. Institutional liquidity inflows have accelerated as the U.S. officially adopts crypto as part of its reserves. Despite elevated inflation, a weakening labor market is forcing the FED to ease, pushing more capital into risk-on assets.
📈 Technical Analysis
BTC is trending strongly bullish on the HTF, so long setups remain the priority. Recently, price broke the bearish trendline that had capped price action since August 13, signaling a shift in momentum. That breakout created a Daily Demand zone, which was tapped once before price moved higher — confirming liquidity inside the zone.
Currently, BTC ran the daily swing low (the first tap of that demand), revisited the Daily Demand, and repriced into the 0.75 Fibonacci max discount level. This strong confluence suggests accumulation and potential continuation higher.
📘 Model to be used – LDMD (Liquidity Run inside Daily Demand w/ Max Discount Zone)
In this model, I start by confirming the HTF trend to set directional bias. Then, I identify key Demand/Supply zones that carry significant liquidity. A sweep of HTF swing lows adds confluence by trapping liquidity. Finally, I align this with the 0.75 max discount retracement zone for a high-probability entry point.
📌 Game Plan
1-Wait for a daily close above the bearish trendline.
2-Enter long on confirmation.
🎯 Setup Trigger
Daily close above the bearish trendline.
📋 Trade Management
Stoploss: 108,500$
Targets:
TP1: 113,900$
TP2: 117,900$
After TP1, move SL to breakeven to secure profits.
💬 Like, follow, and comment if this breakdown supports your trading! More setups and insights coming soon — stay connected!
⚠️ Disclaimer: This content is for informational and educational purposes only and does not constitute financial, investment, or trading advice. Always DYOR before making any financial decisions.