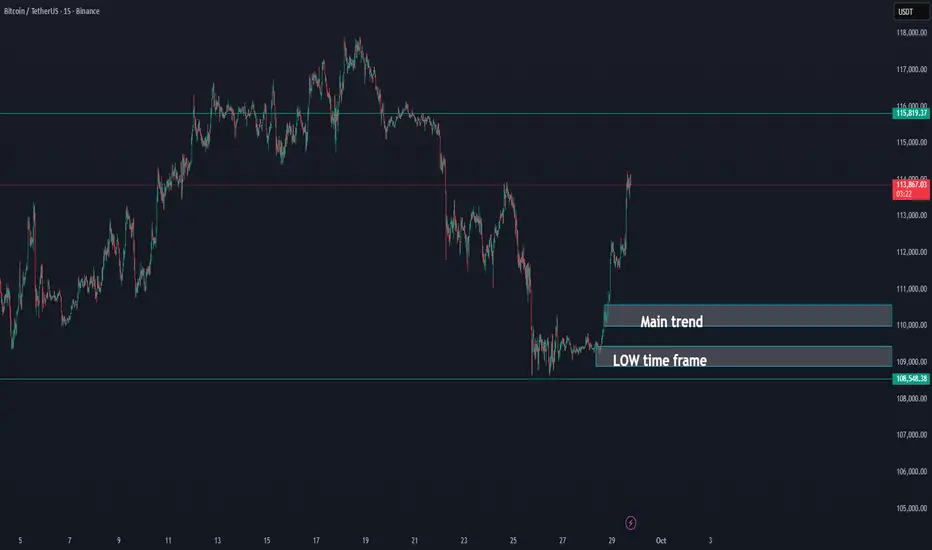
Bitcoin going on the flow UPDATE 29-09-2025BTC/USDT Update
✅ Bitcoin has successfully moved above the main trend, a strong signal that momentum is shifting positively.
🔑 As long as BTC holds this main trend support, the outlook remains bullish.
📈 This structure opens the door for further upside continuation, with buyers maintaining control above this level.
📌 Summary:
BTC is currently holding above the main trend, which keeps the short-term outlook positive as long as this level is defended.
Trade ideas
BITCOIN BITCOIN WATCH 114-116 ZONE descending trendline rejection and break and close will be 119-120k.
then we will change our chart to reflect the new upswing.
#btc #bitcoin

Bitcoin Recovery: Key Levels to Watch This WeekIn the past 24 hours, Bitcoin has shown a solid recovery — but will it continue?
This week’s pivot point is at 112,054 , while the risk level is 110,307 . If that breaks, there’s a high probability of seeing a move down toward 105K (explained in more detail in the video idea).
At the moment, the price is above key moving averages. The last breakout happened on increased volume, and as long as momentum holds, the outlook remains bullish. Still, the price can’t rise forever, so a local correction would be logical, with the support zone for such a move in the 111,400 – 110,700 range.
Targets for this week: 114,636 , 116,231 , and 118,813 .

Deep Learning Model for 24-Hour BTC Price PredictionHi everyone,
I’ve developed a deep learning AI model designed to predict BTC's price movement over the next 24 hours on the 15-minute timeframe.
It’s important to note that this model does not directly provide exact entry points for trades. Instead, it indicates the likely direction of the market, meaning you’ll still need basic trading knowledge to apply it effectively.
After testing it over the course of one month, I achieved a success rate of around 90% in my trades when using the model as part of my strategy.
The model was trained using the following features:
Time-related: Hour, DayOfWeek
Price & volume lags: Close_lag_1, Close_lag_2, Close_lag_4, Close_lag_8, Close_lag_12, Volume_lag_1, Volume_lag_2, Volume_lag_4, Volume_lag_8, Volume_lag_12
Moving averages & statistics: MA_4, Std_4, Dist_MA_4, MA_16, Std_16, Dist_MA_16, MA_48, Std_48, Dist_MA_48, MA_96, Std_96, Dist_MA_96
Technical indicators: Return_log, MACD, RSI
Hourly Forecast for the Next 24 Hours

TradeCityPro | Bitcoin Daily Analysis #183👋 Welcome to TradeCity Pro!
Let's dive into today's Bitcoin analysis. The market has had an upward movement. Let's see what's ahead in the market.
⏳ 1-Hour Timeframe
Yesterday, I mentioned that there was a high probability of movement and that it would be a good idea to keep an eye on the chart during the New York session as the market could move.
📊 With the start of the New York session, good buying volume entered the market, and after breaking 109890, Bitcoin started an upward wave.
🔑 The first area where the price could have faced resistance was 111605, which was broken on the first attempt. After a pullback, the next leg started.
🚀 The break of 109890, along with RSI entering Overbuy and the entry of buying volume, was a good trigger for a long position, and we could have opened a position with it.
⭐ Now, the price has reached a very important resistance zone, and the probability of a correction starting is high. For taking profit, I suggest you lock in profits whenever RSI exits the Overbuy zone, as this will reduce the upward momentum and increase the chances of a correction.
📈 For new positions, no triggers are available yet, and it's better to wait until the market gives us a clearer structure. However, if the price reacts several times to the level, we can open a long position in subsequent attempts if it breaks.
❌ Disclaimer ❌
Trading futures is highly risky and dangerous. If you're not an expert, these triggers may not be suitable for you. You should first learn risk and capital management. You can also use the educational content from this channel.
Finally, these triggers reflect my personal opinions on price action, and the market may move completely against this analysis. So, do your own research before opening any position.

Last Point of Supply - 110k to 117kAfter today, it is in my opinion that the drop will be DELAYED!
I believe we will visit around 110k or lower, get everyone shorting and then 116.8k-117.4k will be revisited for a "BULLISH OCTOBER" before 100k breaks down
The majority loses

BTCUSDT LongBullish points
1. Support area
2. Daily breaker block
3. Tested 0.68 fib level of last
aggresive buy leg
4. Hidden bullish divergence
5. Price above Bull market
support band

#BTCUSDT 6H ChartPrice moved up aggressively once again after liquidating the low at 109.33k. MACD is showing strong bullish momentum, RSI is bought and EMAs are neutral. Price needs to close above the resistance at 113k in order to expect further bullish movements.

BTC long, because ... why not?BTC is "THE" asset against monetary expansion and Powell kind of gave the green light, not for more rate cuts, but he acknowledged that Trump might be "irght" about cutting rates.
Market still price 2 or 3 rate cuts by EOY.
there is no reason BTC does not trade above 120k soon, and why not 144k when we are at it?
H12 200 MA/EMA as a nice inflection point here.

BITCOIN DAILY upwards towards $130,000!1). Rate cuts have begun! 2). ABC correction still in progress with MACD convergence. 3). Volume is fading! 4). Risk Assets are positive across the board!
23 minutes ago
Note:
I've been analyzing charts for over 20 yrs. as my strategies "trend" to be very accurate! A lot of effort goes into this, so please consider a "Boost".

Bitcoin’s Next Big Move: Buy the Dip Before $138K!Hello guys!
Bitcoin is once again at a critical stage, and the chart is giving us a clear roadmap for the next move. Let’s break it down:
Current Setup
Price is holding above $108K–109K and has shown strength around the $103K support zone.
The structure remains bullish as long as BTC trades above $100K.
Strategy
1- Entry zones for buying:
Current market price (~$109K)
Support zone around $103K (a good second chance for buyers).
2- Stop-loss: Around $99K, just below the psychological and structural support of $100K.
3- Target: Upside potential points toward $138K , which aligns with the next major resistance zone.
⚠️ Risk Factor
If BTC breaks below $100K, the bullish phase ends, and we should expect a bearish shift in momentum. In that case, caution and defensive trading will be the smarter play.
📌 Conclusion
For now, the play is simple:
👉 Stay bullish and buy dips while BTC is above $100K.
👉 Watch the $103K zone for re-entries.
👉 Protect your capital with a $99K stop-loss.
👉 Aim high-> the next big target sits around $138K.

BtcusdtBears have the momentum in the weekly , no news other than saylor buying btc 😂 on the monthly bulls buying pressure is getting weak . I think the market will hit 100k in the coming weeks

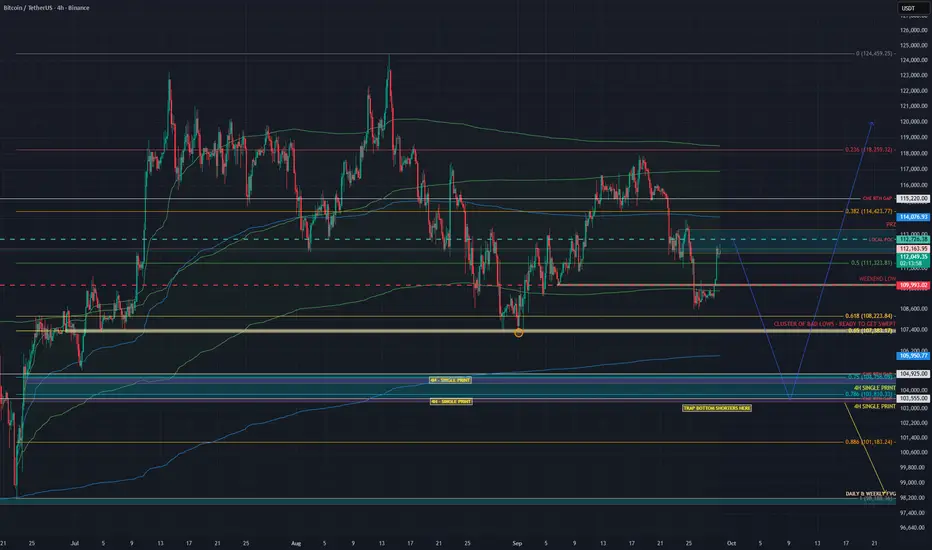
SHORT BITCOIN – THE TRAP IS BELOW, NOT ABOVE!Traders,
From the current levels around $112.8K–$113K, I believe Bitcoin is setting up for another leg down into the $104K region.
Why? Because at current levels we already have multiple Anchored VWAPs (AVWAPs) lining up from different swing high → low auctions, which makes this area heavy resistance.
That means the probability of retracing higher is limited, and instead, the market is more likely to drop into $104K — where there’s significant unfinished business — before a proper bounce can occur.
🔮 Hypothesis
From current levels ($112.8K–$113K), price will reject and move down toward $104K.
Retracement higher than $113K is unlikely given AVWAP confluence + resistance stack.
The $104K region will act as a bounce zone, potentially with a Swing Failure Pattern (SFP) wick.
📊 Data & Confluence
🔻 Why $104K Is a Magnet
HTF Point of Control (POC): The high-volume node where markets naturally seek equilibrium.
HTF AVWAP: Anchored VWAP from major pivots aligns here, marking fair value.
4H TPO Single Prints + Fib Retracements (0.75–0.786): Gaps in auction structure converge with key Fibonacci levels.
CME Gap: The $104K CME RTH gap still needs filling — markets often return here for balance.
Sept 1st Low (Weekly TPO): Poor excess signals unfinished auction business, pulling price back down.
🔼 Why Current Levels Won’t Hold
Clustered AVWAPs (different swing high → low auctions): Acting as strong dynamic resistance.
Multiple POCs at current zone: Volume saturation suggests exhaustion.
Fibonacci confluence + harmonic pattern: Pointing to lower continuation.
💵 Macro Flows
USDT Dominance (USDT.D): Breaking higher → capital shifting to stablecoins → bearish BTC.
Aggregated CVD: Spot CVD drifting slightly higher, but futures CVD flat with no OI expansion.
→ No real demand behind the move.
📌 My Take
Bitcoin is most likely to:
Reject from current AVWAP resistance ($112.8K–$113K).
Drop into $104K, clearing imbalances and luring in shorts below the 0.786 fib.
Trigger a wick/squeeze move up (Swing Failure Pattern) to trap those late shorters.
⚠️ If $104K fails to hold, next target is the imbalance zone around $98.5K.
✅ Conclusion
The market is loaded with resistance at current levels. Until that’s broken with conviction, the path of least resistance is down into $104K.
That’s where the real battle will be.
Trade safe, manage risk, and don’t get trapped on the wrong side of the wick.
btcBitcoin is at resistance
We are waiting for it to break through and enter the sale after reaching resistance

BTC Accumulates in Downtrend - CorrectionBTC Analysis
BTC is currently moving in line with the broader trend structure. After a strong bearish leg, the price reacted precisely at the 108k demand zone, rebounding sharply by around +4,000 points. This confirms that buyers are still actively defending this critical level.
At present, BTC is trading near 112k, with the next resistance levels to watch at 113,925 – 116,132. A short-term bullish continuation into these zones is possible, but strong selling pressure is expected there.
If the price fails to hold above the 113k – 114k area, a pullback toward the 109k demand zone could follow. A deeper bearish continuation would then likely target 106k – 106.2k, which aligns with the next key Fibonacci extension and a major support area.
Key Notes:
• The broader trend remains intact; buyers successfully defended 108k.
• Watch resistance at 113.9k – 116.1k for potential reversal signals.
• Key support zones: 109k (demand) and 106k (major target).

BITCOIN SIGNAL: MOST PEOPLE ARE DOING THIS NOW (wrong)Yello Paradisers! In this video, we are going through multi-timeframe analysis on Bitcoin as professional traders. We are using advanced technical indicators, and we are properly analyzing with an Elliot Wave perspective. We are digging deep into the sub-waves and structure. Enjoy.
And Paradisers! Keep in mind to trade only with a proper professional trading strategy. Wait for confirmations. Play with tactics. This is the only way you can be long-term profitable.
Remember, don’t trade without confirmations. Wait for them before creating a trade. Be disciplined, patient, and emotionally controlled. Only trade the highest probability setups with the greatest risk to reward ratio. This will ensure that you become a long-term profitable professional trader.
Don't be a gambler. Don't try to get rich quick. Make sure that your trading is professionally based on proper strategies and trade tactics.

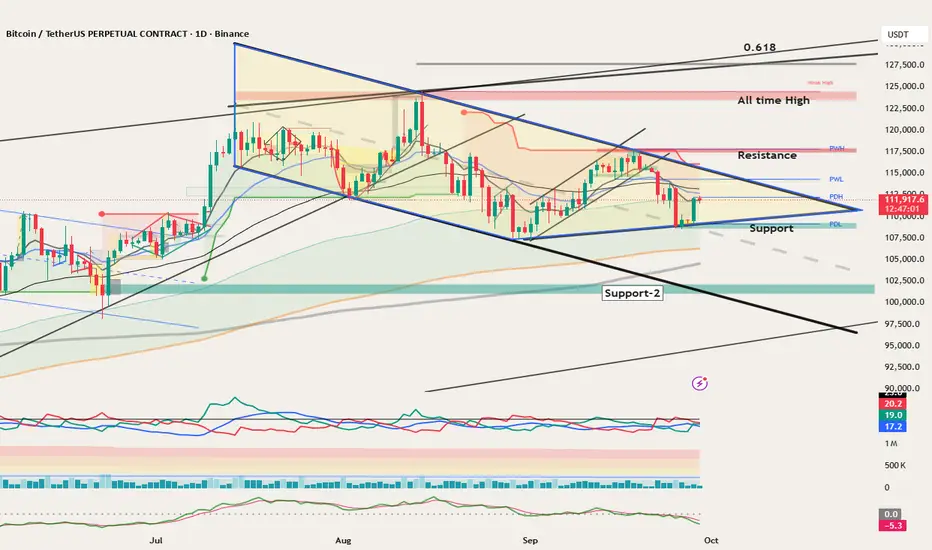
BTC coiling within daily triangle at 112k – watch 110k support aBTC/USDT daily chart shows price compressing inside a large symmetrical triangle, trading near $112K. With upcoming catalysts (NFP Oct 3, CPI Oct 15, FOMC Oct 28–29), the next breakout could set the trend.
BTC has formed lower highs since July and higher lows since June, creating a wedge. Recent support is at 108,723, with deeper support near 101,000. Resistance is at 117,711, with higher targets near 124K–126K. A breakout above 117,711 opens the way toward 128,000, while a breakdown below support risks a slide toward 101,000. EMAs are clustered, momentum is neutral, and volume is fading.
Trade Plan:
Long Setup: Break and daily close above 117,711 → enter on retest; stops below 110K. Targets: 124K–126K, extension to 128K.
Short Setup: Breakdown below 108,723 → short on retest; stops above 114K. Targets: 106K and 101K.
Takeaway:
BTC is coiling tightly within the triangle. With critical macro data ahead, a clean break beyond 117,711 or below 108,723 will likely decide the next leg.
Disclaimer: Educational content only, not financial advice.
$8 Billion Bitcoin Accumulation Could Launch Price to $115,000At the time of writing, Bitcoin is trading at $111,966, just shy of the $112,500 resistance. The recent bounce from below $110,000 reflects investor demand, but breaching key resistance remains critical for further upside momentum.
If Bitcoin successfully climbs past $112,500, the crypto king could reclaim $115,000 as a support level. This would open the door for a rally toward $120,000 in the coming days, fueled by accumulating investor demand and reduced selling pressure on exchanges.
However, failure to overcome $112,500 resistance would expose Bitcoin to further downside risks. A drop back to $110,000 or even $108,000 remains possible. This would invalidate the bullish outlook and trigger renewed skepticism about Bitcoin’s near-term recovery.

$BTC - LTF PlayCRYPTOCAP:BTC | 1h
If we can hold 111k during New York session, I think we can still tag 113.5k (swing point)
We could see a rejection around 113.2-113.5k, though I'm still looking to tag 114.5-114.8k to rebalance (bearish imbalance)

BTC market snapshot BTC level at 108K has held so far. A breakout above 116K would send us to test a new all-time high. But I’m still holding a short position — there’s a divergence on the higher timeframe, and if we reach new highs, there’s a strong chance of a short squeeze. For now, it’s the classic sideways movement where there’s nothing to do.
Alerts: 108K and 116K.
A breakout to new highs would be my opportunity to open a short.

28/09/25 Weekly OutlookLast weeks high: $115,537.51
Last weeks low: $108,606.86
Midpoint: $112,072.19
As BTC continued to trend down post FOMC the key HTF level of $108,500, after some chop at this level a late rally on Sunday has pushed BTC back to the Midpoint of the range for this week.
As September comes to a close we are at the point where banks window dress their balance sheets by de-risking going into Q4. Banks taking cash out of the market to appear there is less risk and more liquid to hide their true risk over the quarter. This lowers liquidity and for this reason I do not expect the bulls to be out of the woods yet and the weekly low ($108k) could be under attack again before the week closes.
The story is the same for much of the altcoin market, after continued downtrend majors are bouncing off key HTF S/R levels but conviction is still low due to quarter end.
This week I am looking at how BTC finishes the week once the month/quarter end is out of the way. If their is renewed optimism October.
In terms of seasonality October has an average return rate of 21.89% since 2019.
Should price break below weekly low the bullish HTF trend would be questioned and would open the door to a deeper correction. With the 4-year cycle predicted to end in late October there would be huge talk of the cycle repeating and the bear market beginning.
Good luck this week everybody!

BTC/USDT - BREAKOUT Or BREAKDOWN AHEADThe price is currently trading around the 112,112 USDT level with slight intraday fluctuations. The chart highlights a key horizontal support and resistance (S/R) structure with two red horizontal lines marking these zones.
1. Resistance (R) Zone
The upper red horizontal line, marked as “R,” is acting as a resistance level around the 112,400 USDT region. Price has tested this level multiple times in the recent sessions. A clear breakout above this resistance could signal further bullish continuation.
2. Support (S) Zone
The lower red horizontal line, marked as “S,” is situated around the 111,600 USDT level. This zone has provided a strong demand base for buyers. If the price retraces, this level will act as a critical support.
3. Current Price Action
At the time of observation, Bitcoin is consolidating right above the resistance zone, suggesting a possible breakout attempt. The candlesticks indicate bullish momentum leading into the resistance, with a series of higher lows forming before the test of resistance. This pattern reflects increasing buying pressure.
4. Possible Scenarios
• Bullish Scenario: If the price successfully breaks and holds above the resistance zone (R), it may trigger a move towards the next target to the upside, projected around the 112,800 – 113,200 USDT region. The structure suggests the possibility of forming a bullish continuation pattern, with traders targeting higher resistance levels.
• Bearish Scenario: If the breakout attempt fails and Bitcoin gets rejected at resistance, price could retrace downward. A move below the support zone (S) at 111,600 USDT would likely signal bearish momentum, with the next target projected around the 111,200 – 110,800 USDT range.
5. Market Sentiment
The price action is consolidating in a range-bound structure between support and resistance. This often reflects market indecision before a breakout. A breakout from this range, either above resistance or below support, will provide a clearer directional bias.
⸻
Conclusion:
The BTC/USDT 15-minute chart is currently at a critical juncture. Traders should closely monitor whether Bitcoin sustains above the 112,400 resistance to confirm a bullish breakout, or if it fails and drops back below support at 111,600, signaling bearish continuation. Patience and confirmation of breakout direction are key before entering new trades.

BTCUSDT.P SHORTBTCUSDT.P SHORT
The market has the potential for an downtrend
Price: 111658.3 $
Main target 110156.0 $
SL 114334.0 $
