BTC/USDT Weekly AnalysisBitcoin is currently in a corrective phase after a strong weekly sell-off.
Price has a clear Weekly Fair Value Gap (FVG) sitting around the previous weekly high in the 95k–97.5k area.
📌 Technical idea:
Price could retrace back into the weekly FVG to rebalance inefficiency and grab liquidity above the previous weekly high.
After tapping that zone, a bearish reaction is expected.
Final target is the previous weekly low, where major liquidity rests.
📍 Key levels:
Weekly FVG zone: 95,000–97,500
Liquidity grab above previous weekly high
Target: previous weekly low around ~75,000
🎯 Bias: Bearish after mitigation
Trade ideas

Bitcoin Only after breakout chanel resistance bull market again Soon we can expect price broke above channel resistance now it is near 93K$ and after that market will face huge gain only.
Step 1: Confirm the Breakout (The "Is It Real?" Check)
Don't buy the first tiny wick above the line. Wait for confirmation to avoid a false breakout:
Daily Close: Wait for a daily candle close (UTC) decisively above the $93K trendline.
Volume Surge: The breakout should be accompanied by significantly higher buying volume than average . This shows conviction.
Follow-Through: The price should hold above the trendline and not immediately fall back in.
Step 2: The Trade Entry Strategy
Aggressive Entry: Buy on the first strong 4-hour or daily close above $93K.
Conservative Entry : Wait for a "retest" of the broken trendline. After breaking out, price often pulls back to touch the former resistance, which should now act as new support. This is a higher-probability, lower-risk entry.
Step 3: MY Bullish Targets - A Realistic Roadmap
my targets are logical and align with measured moves and previous all-time high extensions.
First Target: ~$110,000
This is the first major psychological barrier and would represent a strong resumption of the bull market.
Second Target: ~$120,000 - $125,000
This area is a common 1.618 Fibonacci extension from key swing points and represents the next significant resistance zone.
Extended Target: ~$140,000+
This is the "blue sky" target that comes into play if the bullish momentum becomes parabolic, likely fueled by a FOMO (Fear Of Missing Out) influx of new capital.
DISCLAIMER: ((trade based on your own decision))
<<press like👍 if you enjoy💚

Waiting for a pullback on BTCUSDTInteresting to see Bitcoin continuing pushing high.. a pullback suitable for entry.

BTC INTO FEB/APR '26 then 4Q recessionBTC trajetcory given wrt the elliot wave structure, ideally chopsolidation at 74k can bring about higher targets but this is my base case wherein we can dip to 65-67k then rebound. Else if we are forming an A to B now then 58k would be the mark for the final dip. Wherever we dip now will tell us how 4Q '26 will look like. Ciao

BTCUSDT - BullishBTCUSDT is trading in a bullish channel on 1H timeframe. We will place our buy limit near fib level 0.618 which also seems to be its channel support.

BTC Trading Inside a Well-Defined RangeBitcoin continues to move inside a horizontal range with clearly visible zones used by smart money.
🔴 Distribution Zone (sells): 94,000 96,000
This area has repeatedly shown aggressive selling pressure. Smart money hunts liquidity here, taking out short stops and creating short-term reversals. As long as BTC stays below this zone, there is no confirmed bullish breakout.
🔵 Accumulation Zones (buys):
90,000 – 88,500
87,000 – 84,500
These zones show clean, consistent buyer reactions. Every deeper dip gets bought instantly — classic smart-money behavior when building positions step-by-step and defending key levels.
BTC is essentially trading between two zones of major interest.
Top = distribution.
Bottom = accumulation.
This is a typical balance phase before the market chooses a direction.
What matters now:
Price is pushing toward the top of the range without making new lows — buyers still hold the initiative.
But without a breakout above 96K, this remains a range controlled by smart money.
My focus:
Watch who takes initiative at the boundaries
Wait for either a strong breakout above 96K with volume, or a deeper test of the accumulation zones
No predictions inside the range only reacting to clear signals
For now BTC continues to trade in a structure where accumulation and distribution are clearly visible. True decisions happen at the edges.

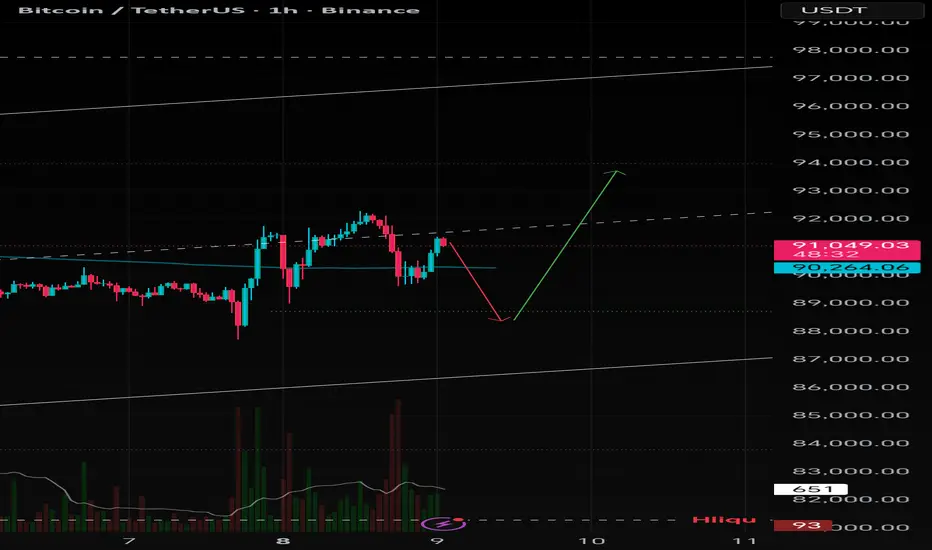
My view
***Price will drop to the green line.** That’s my key support level.
* **Then it will bounce back up.** I expect a reversal after touching that green line.
***The overall trend is still up.** The big white uptrend line at the top shows the main direction hasn't changed yet.
***It’s a pullback, not a crash.** This dip to the green line is just a normal correction before the next move higher
BTCUSDT BUY NOW!!!!!BTCUSDT Completed my last analysis predictions by meeting up 87k level with a sharp rejections on my recent previous post on btc am in on a buy right now to 94k then expecting to make a rejections off 100k level......

Bitcoin at the Key Point Many are already burying Bitcoin and believe that it has been in a bear trend for almost all of 2025. But if you look at the situation technically and without emotion: the structure level at $74,450 has not been broken, and the price has not even come close to it yet.
The diagonal support level was tested and a bounce followed. And this is the main thing to watch right now. Because if the two-year diagonal support level (the purple arrow) is broken down again and the price fails to move back above it, this will be the first major signal of the start of a bear market.
✅ This drop as a whole was predictable and has closed a large number of gaps below after the wild rally in the summer. One last big gap remains, and I find it hard to believe the price will go down to close it now, because it — surprise — ends at $74,450.
During the decline two more gaps were also formed at $97,030–$103,265 and $112,296–$121,541. And this means these levels strongly attract the price.
✅ At the same time, selling volumes since November 21 are forming a divergence, which may mean that we have already passed the peak of buying pressure. But buying volumes also still remain at the lows, which means there are still few people willing to buy the dip.
✅ The Supply and Demand indicator shows that demand at the current levels is still low, while supply is high. But a large demand zone has formed at $69,000 and below. I certainly hope we won’t see such prices, although if so many large orders are placed exactly there, maybe they know something?
🌐 In many ways, there is fear dominating the crypto market right now, after it proved its inability to function when, during the crash in October, market makers pulled their orders and many even top altcoins almost went to zero.
And now companies that have been buying crypto on their balance sheets are being threatened with exclusion from all indices, and they are rushing to sell off their holdings.
➡️ Right now the crypto market is not about charts, but about macro factors. And the main macro factor is Strategy. If they are excluded from the index, Saylor will have to sell and reduce the balance to get back into the indices, and then we will see a real crash 2.0.
That’s how it goes in the crypto industry: when Bitcoin’s price is rising, Saylor is a genius on magazine covers; when it’s falling, Strategy gets excluded from all indices.
So don’t fall for talks about technology and the future — that’s what the rich feed you with while they are already closing their positions.
But nevertheless, I believe that we are still at the beginning of a new season, and at least the start of 2026 will be green for the markets 🔥

$BTC -Ropium-Copium!Heya! Just a quick CRYPTOCAP:BTC update, traders!
FOMC turned out to be a nothing-burger, and 94.5k (yearlyOpen) is proving to be a trouble zone. We didn’t have enough strength to break through, and if we can’t reclaim 92k soon, a retest of the 84–82k base is still pretty likely since we still need to sweep or tap that area at some point.

BTCUSDTBitcoin Analysis
In the previous analysis, I mentioned that every time Bitcoin corrects more than 30% from its price top, it enters a downward phase.
Although the price dropped close to $80k (36%), it didn’t establish a solid consolidation there, so our scenario is still valid. With a confirmed consolidation below the $86k–$87k range, we would officially enter a bearish phase, with the first potential target around the $74k zone.
For now, the price is being held up well, and we need to see what tonight’s interest-rate decision and Jerome Powell’s remarks will signal for the market.
It’s also worth mentioning that we are in the final month of the calendar year, and historically, this month has consistently shown stronger selling pressure in previous years.
Even though the rate cut has already been priced in, the announcement itself could still generate demand in the market — unless Powell, in his speech afterward, tries to emphasize strengthening the U.S. dollar, which could create selling pressure across markets.
Overall, tonight will give us a much clearer direction for Bitcoin’s price action, and as always, we will move in sync with the market.


BTC will drop soon....this is massively manipulatedThis may be related to the potential rate cuts which is being "priced in," but nothing fundamentally is improving BTC position and it still doesn't solve any real problems and will go back to 80k or even lower real soon. Retailers will jump in as exit liquidity and will get wiped out when it drops back from the massive losses taking place. Great to time to get into MSTZ! Easy 5-10% upside IMHO....

Bitcoin Analysis – Yesterday the Market Went Crazy Hey traders!
Let’s jump into today’s Bitcoin analysis.
Yesterday the market went full crazy mode
As I told you before, you could take both long and short positions from the extremes — and I did exactly that. Both directions activated ✔️
First things first, like always, the Fear & Greed Index:
24 — still in the Fear zone.
🔍 Quick Look at the Daily Timeframe
I want you to open your daily chart with ZERO indicators.
Just look at the structure.
The daily trend is still bearish, and right now we are simply in a correction of that bearish trend.
According to Dow Theory, if we consider the primary trend as down, then we’re currently in the secondary movement.
Keep that in mind — it matters.
🚀 Scenarios & Triggers
📈 Bullish Scenario (LONG)
If price wants to move up:
👉 Breaking 92,000 is my main LONG trigger.
I will definitely take a long there, especially if the move starts during the US session or if I see clean stepping volume.
You can also long from 91,500,
just wait for a clean 1-hour candle close.
📉 Bearish Scenario (SHORT)
For shorts on Bitcoin itself — honestly,
👉 there’s NOTHING until 89,200.
Market structure isn’t giving any short setup yet.
Until then:
🔸 either wait
🔸 or look for altcoins that are bearish against BTC — those can give great short setups.
🟢 About Yesterday’s Trades
Both trades activated:
Short → closed at 2R, solid.
Long → almost hit 2R, but because my entry was a bit far, price reversed and hit SL.
Totally normal when the market has no clear direction.
🎯 Final Notes
Keep the scenarios in mind.
Watch the volume.
And as always — risk management comes first.
Stay profitable 💚🔥

Bitcoin 1more dipThere is a possibility that after Bitcoin reaches the 99k area, it falls again due to many resistances in that area, and then goes to 110k.

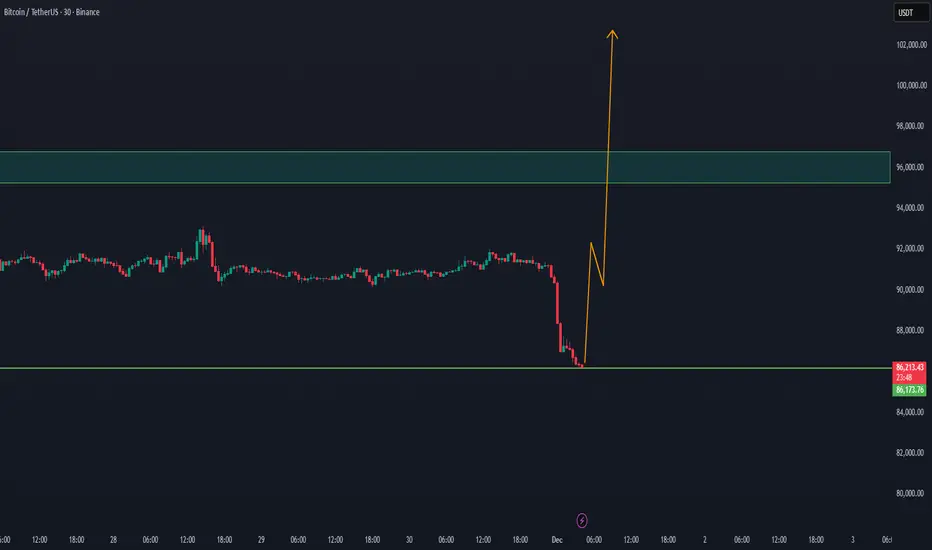
AFTER THE EXPECTED CORRECTION BTC ON WAY TO 100k+WE did expect with the last BTC update that a correction could happen at Bitcoin.
With the new study update, there is a good chance BTC will return step by step to the 100k level
Since the price action, new whale volume can enter BTC.
our previous update with the expectation of BTC fall
$BTC Top-Down Analysis (Short & Simple)Here’s a quick breakdown of what I’m seeing in $BTC.
Overall, all major timeframes are still bearish including the lower ones. CRYPTOCAP:BTC is currently holding weekly bullish OB zone along with a dynamic trendline support.
Weekly TF: We have one good sign and one bad sign.
Bad sign: Red trendline has already broken, and price is trading below it. (not ideal)
Good sign: There’s another trendline (light black) still acting as support, and confirmations on the weekly timeframe would strengthen this level.
Moving to Daily: Still very low momentum since Oct 10th crash no strong volatility.
On 4H: Structure looks slightly better, but any bullish shift would need a clean breakout above marked red resistance zone. 4H + Daily candle close above it would confirm a trend shift in internal (Daily) and external (4H) structure.
I kept chart simple so it’s easy to understand.
As for the big question: Is 80k the bottom?
Ans: Given that all timeframes are bearish and momentum is weak, calling it a confirmed bottom is premature. Only a strong pump from the current zone can support that idea. Most likely bottom should form somewhere around 80k - 75k.
This analysis is pure price action with multiple confluences (FIB, orderflow, ICT, SMC concepts).
If this analysis helped or you learned something new, please boost this post i appreciate the support!


08/12/25 Weekly OutlookLast weeks high: $94,171.14
Last weeks low: $83,809.87
Midpoint: $88,990.51
Bitcoin performs a double Swing Fail Pattern (SFP) as price sweeps both extremities of the range before closing out near the midpoint. After such a dramatic drawdown during Q4 so far, the possibility of a V-shape reversal as the year comes to a close was never going to be a high probability. With that we have seen a steady base being built and a higher low printed, certainly a more bullish structure than last weeks opening.
This week we have FOMC on Wednesday:
Previous: 4.0%
Forecast: 3.75% (-25bps)
Actual: ?%
A 25bps cut is forecast with an 87% chance. Could this finally reignite some buyside volume? The timing of year end doesn't help, I think volume stays relatively subdued until 2026 where the Fed ending QT & lowering rates help risk-on assets. For now I will maintain that a $80,000-$100,000 range is where Bitcoin stays for some time, thin orderbooks creating short term volatility but not necessarily strong moves in either direction.


BTC: The 15-Year Prophecy (Hosoda Time & The Diagonal)There is a ghost in the machine.
For the last few months, amidst the noise of breakouts and new highs, a specific signal has been flashing a warning that defies the rules of a standard Bull Market. It is a "glitch" in the data—a silence where there should be noise.
Most are ignoring it. Some are confused by it. Today, we are going to try solving it.
Below is the full evolution of the Bitcoin setup, from the Daily traps to the Macro truth, revealing why the "Silence" is actually the loudest signal we have ever seen.
Part 1: The Micro Trap (1D Chart)
Zooming into the daily timeframe, the structure of the decline is textbook. We are currently navigating Wave (4), but the context provided by the previous move is critical.
The "Extended" Wave 3: The drop we just witnessed wasn't a standard correction; it was an impulsive sell-off where Wave 3 was extended. when the third wave extends, it confirming strong momentum in the direction of the trend. The bears are in control.
Current Status (Wave 4): We seem to be in the middle of a Wave (4) relief rally, potentially unfolding as an ABC correction.
Sub-waves 'a' and 'b' appear complete, with 'b' potentially establishing a local higher low.
What's Next: We are likely waiting for Wave 'c' to expand upwards to potentially complete the structure.
The Potential Resistance ($99k): If this structure holds, Wave 'c' might push towards the resistance confluence around $99,323. This area could serve as a ceiling for this corrective phase.
The Downside Risk ($79k): Traders should remain cautious. If Wave (4) finds resistance near $99k, the Elliott Wave guidelines suggest a Wave (5) decline could follow. If that scenario plays out, the market might target the major support zone near $79,000.
Part 2: The Time Anomaly (1W Chart)
While the daily chart showed us the immediate price action, the Weekly chart reveals the true scale of the move. As discussed in previous updates, we are navigating a large-scale Irregular Flat Correction, and we are currently at the tail end of Wave (1) of the 5-wave impulse that makes up the larger C-Wave.
So, the entire impulsive structure we just analyzed on the Daily chart? That was just the first leg of this Weekly move.
☁️ The Ichimoku Signal: Testing "Senkou Span B" Price action has now entered the Ichimoku Cloud (Kumo), a critical zone of turbulence.
The Level: you can see candles trading inside the cloud. We have already tested the bottom support, specifically the Leading Span B (Senkou Span B).
The Forecast: Hitting this level signals that Wave (1) is either ending or has already ended. However, the market rarely makes it easy. I am expecting a potential "False Breakout" below the Cloud to trigger panic, followed by a sharp reclamation. That fake-out would likely mark the bottom of Wave (1) and start of Wave (2).
⏳ The Time Anomaly: Why so fast? There is a strange disconnect in the "Time" dimension of this cycle compared to history (see picture).
2021 Cycle: In the previous bull run, the correction for Wave 1 typically took 70 days to cool the RSI down to 37.
Current Cycle: We have smashed down to an RSI of 35.8 in just 42 days.
The Question: Why is the market correcting nearly twice as fast as before? This "Time Compression" indicates the cycle is moving faster and more violently than we are used to.
The "BBWP Mystery" Finally, look at the BBWP (Volatility) in the below picture. This presents a genuine anomaly. Throughout this cycle, we have seen contractions many times, yet the spectrum never reached the extreme 90% expansion levels. Now, at the very end of the cycle, we are seeing another massive BBWP Contractions.
Why is this happening? Is it just noise, or is this contraction actually telling us the truth?
Part 4: The Truth (6-Month Macro Chart)
Why is the market moving so fast? And what is the "BBWP Signal" we mentioned Before? Look at the 6-Month Logarithmic Chart below.
The Big Picture: Elliott Wave Supercycle on 6M Log Scale
On the logarithmic chart, Bitcoin appears to be wrapping up a massive impulse wave that started from its early days:
Wave (I): Peaked around 2013 (~$1,200 high).
Wave (II): Bottomed in 2015 (~$200 low).
Wave (III): Explosive rally to the 2021 all-time high (~$69,000).
Wave (IV): The 2022 bear market low (~$15,500).
Wave (V): Ongoing since late 2022, but here's the twist—it's unfolding as an ending diagonal (wedge pattern with overlapping subwaves: 1-2-3-4-5).
2.Applying Hosoda Time Theory (Ichimoku Time Theory indicate potential future market turning point).
The vertical lines in the chart are not Fibonacci; they are Hosoda Numbers (9, 13, 17, 21...),
9: Marked the 2023 Bull Run start.
13: Exactly Marked the Jan 2025 Top as end of wave 3, which matches the irregular flat analysis on Weekly chart which states that Cycle top was on Jan 2025.
17 (±1): Matches our projection for the next major pivot—the end of wave IV and the start of the final Wave V run on Jul-2026 or Jan-2027.
The "Mystery": The BBWP Anomaly
BBWP is contracting sharply now on weekly chart—at what feels like the end of the cycle, not the start. This flips the script on historical behavior. Why? I tie it back to the higher-degree Elliott count: The ending diagonal's converging nature naturally squeezes volatility, compressing Bollinger Bands as momentum fades. Instead of signaling a fresh bull, this late-cycle contraction could be foreshadowing a reversal—think trend exhaustion rather than accumulation.
A Possible Explanation: If the macro structure is indeed an Ending Diagonal, then this volatility crunch (BBWP contractions) and the market correcting nearly twice as fast as before makes perfect sense. We would be squeezing into the apex of a 15-year wedge. The market might be running out of "oxygen".
The Verdict: With the 6-Month structure potentially squeezing into a corrective Wave IV, the weight of evidence suggests that the path of least resistance is down. Until the market touches the lower boundary of this diagonal (or invalidates the structure), the only logical macro view is bearish.

BTCUSDTBTCUSDT is trading within a tight range near a key technical zone, indicating indecision between buyers and sellers.
Such market conditions often lead to false breakouts and emotional overtrading.
A disciplined approach is to wait for clear price acceptance or rejection before entering trades.
Position size should remain controlled to manage risk effectively.
Reacting to confirmed price action, rather than anticipating direction, improves consistency.
At this stage, capital preservation and patience are more important than aggressive trade execution.

BTC: The Final RallyBTC has repeatedly dipped below $90K, presenting clear buying opportunities—and I’ve been consistently signaling to keep buying, locking in steady profits along the way. Right now, all you need to do is hold tight and wait for the final upward push.
Our first target to watch is $100K, and there’s still massive upside potential on the horizon for the longer term.
All signals have been 100% accurate for two consecutive weeks. I will keep delivering precise signals to help you lock in consistent profits.
