78980 next tp BTC now prepared for new ATH which will be around 78980 plus minus , this may be the last rally of 1st bullish rally , still time to decide , if this is last rally which confirmed triggered recession pullback of all world financial intrument to ground , floor inclu nasdaq gold
BTCUSDT.3S trade ideas

BITCOIN NOTCOINAccording to the chart, Bitcoin can break the 74,000 Tether static resistance break.
The next targets on the chart will be 78,000 Tether and 61,000 Tether.

BTCUSDT | 15M FALSE BREAKOUTExciting movements on BTC today! The last two 1-hour candles were intriguing, showing some notable volume. On the 15M timeframe, we broke the low and then bounced back up. With a false break on the 1H timeframe, we might see a retest of the 15M low. This sets up an interesting opportunity to go long. I've set my order—let's see how it plays out!

EYES on the patternI think everything is clear on the chart.
seat tight and wait. and...
Enjoy your hot (BTC) coffee

BTC: Bitcoin in a complex scenarioBTC: Bitcoin in a complex scenario
Bitcoin is near a strong resistance zone.
If you are looking for sales opportunities, you should know that BTC has a more complex scenario than it seems.
📺You may watch the video for further details📺
Thank you and Good Luck!
❤️PS: Please support with a like or comment if you find this analysis useful for your trading day❤️

IT'S PLAYING MY GAME BTCI don't know if you remember the previous idea i shared about Bitcoin. As you can see, BTC price has perfectly followed my line. Actually the price has broken above the main daily trend line as i was expecting. IMHO we will see a little correction there that will lead It inside the triangle again and the real pump should start next week/Friday.

Lingrid | BITCOIN'S favorite trend CONTINUATION patternThe price perfectly fulfilled my last idea. BINANCE:BTCUSDT is currently squeezed within a triangular formation, with the price bouncing off the lower channel boundary and now testing the pattern. At this point, it's possible that the price will break out of the pattern and surge upwards towards the next level of resistance. However, an alternative scenario is that the false breakout of the support level and upward channel, that could shake out weak holders. Given the current situation, I expect the market to continue compressing and eventually break out upwards, potentially leading to a significant upswing. My goal is resistance level around 72000.
Traders, if you liked this idea or if you have your own opinion about it, write in the comments. I will be glad 👩💻

BITCOIN CHART UPDATE !!Hello friends, welcome to this BITCOIN update from Crypto Sanders.
#BTC/USDT Analysis
The crypto market has entered a strong bullish rally following the successful breakout and subsequent retest of the symmetrical triangle pattern. This rally faces horizontal resistance, a crucial level influencing short-term price movements.
Symmetrical Triangle Pattern: The breakout and retest of this pattern have led to the current bullish rally.
50-Day Moving Average: This moving average is moving upwards, indicating ongoing bullish momentum and acting as a dynamic support.
Resistance: Bitcoin is facing horizontal resistance. A decisive break above this level will further validate the current bullish sentiment.
Support: The 50-day moving average is providing dynamic support, reinforcing the upward trend.
If Bitcoin breaks above the horizontal resistance with strong volume confirmation, consider entering a long position. This move could lead to continued upward momentum and new highs.
Place a stop-loss order below the 50-day moving average or recent support level to effectively manage risk. Summary: Bitcoin (BTC/USDT) is showing strong bullish momentum after the breakout and retest of the symmetrical triangle pattern. The current rally is facing horizontal resistance, which is a crucial level for short-term price movements. A decisive break above this resistance could lead to continued upward momentum and new highs, while the 50-day moving average provides dynamic support. Stay tuned for further updates and analysis.
I have tried to bring the best possible results in this chart.
If you like it, hit the like button and share your charts in the comments section.
Thank you.

Long term BTC chart: when resistance becomes supportThis time a very simple chart, on the day timeframe. After the top of the 2017 bull run was broken at a price level of 20,000, we can clearly see that the next bull run has been kicked off. In my view a clear scenario of resistance becomes support. I therefore expect that the bottom for this bear market has been reached and I personally buy my long term bags here.

BTC/USD Technical Analysis and Trade IdeaDuring the recent rally, Bitcoin (BTC) displayed significant bullish momentum. In our video analysis, we delve into a potential buy opportunity, provided that price action aligns with our entry criteria. We look closely at the 1H chart:
1: Market Structure Breakout: The previous bearish trend has been disrupted by a bullish breakout in market structure.
2: Long Bias: While my bias leans toward a long position, it remains contingent on price action developments retracing into my fibo zone as outlined in the video.
Please note that this content is for informational purposes only and does not constitute financial advice.

Fast Short on BTCUSDTWe are currently in a wide sideways channel. We gradually move down from its upper border. After a short five-day up - down movements, I think we will continue to move towards the lower part. Let's see.

#BTC bullish cup-and-handle structure📊#BTC bullish cup-and-handle structure📈
🧠From a structural point of view, we have successfully broken through the turning point, which means that the bullish structure of the cup and handle has been established. It is reasonable to use the bullish structure as a supporting force to continue the upward trend in the future.📈
➡️From a morphological perspective, the ascending triangle is established.
⚠️But we need to be clear that we are currently in the red target zone, so we cannot chase the rise. If there is a good correction and the price reaches the buy zone, it will be a long trading opportunity worthy of our attention.
Let's see if the market can give us such an opportunity.👀
⚠️Don’t forget risk management💯
✔️Trade safe✔️
🤜If you like my analysis, please like 💖and share it
👋follow me. Learn about further structural evolution💕
BINANCE:ETHUSDT.P

BTC Bitcoin Technical Analysis and Trade IdeaIn this video, we discuss a #BTC #Bitcoin trade idea based on bullish price movement As always, the video covers my trade entry points, opinions on trend analysis, market structure, and price action. Remember that this information is educational and not financial advice. 📈🚀📊

BTCUSDT - Market Analysis (ICT Concepts)Hi everyone,
Here is a quick analysis on Bitcoin using predominantly the Monthly and Daily chart for my analysis.
We see a reaction from a Monthly Bisi with price moving higher. On the Daily timeframe for a closer look, we see that there is a Premium Sibi and a Discount Bisi. So we may see some back and forth movement between the two. But, I will be looking for where the Daily candle(s) close in the Premium Sibi, either inside/below it, or above it. This will likely determine my next course of action. I provide further analysis in the video so do check it out.
- R2F

Bitcoin (BTC)19-15k is a good opportunity for buying the dip and hold it for long term
as you see bitcoin and whole crypto market following the macro economy and even if you compare it companies like Meta or Alibaba you will understand how mature this market gets and how bright future it has. right now btc stuck at 18500 and 20300 channel which is a great signal for future traders.many altcoins pumping as well and we have plan to cover it as much as possible too


BTC Price Prediction and Elliott Wave AnalysisHello friends,
Thank you for joining me in my analysis. Remember to like, subscribe, and stay tuned for more updates. See you soon!
Thanks, Bros

Short bitcoin from 73k . scalp only ALL trading ideas have entry point + stop loss + take profit + Risk level.
hello Traders, here is the full analysis for this pair, let me know in the comment section below if you have any questions, the entry will be taken only if all rules of the strategies will be satisfied. I suggest you keep this pair on your watchlist and see if the rules of your strategy are satisfied. Please also refer to the Important Risk Notice linked below.
Disclaimer

SHORT BTC 1MSHORT BTC 1M timeframe :)
If Bitcoin closes above 76500 for two to three weeks on a weekly basis, this analysis will be canceled.

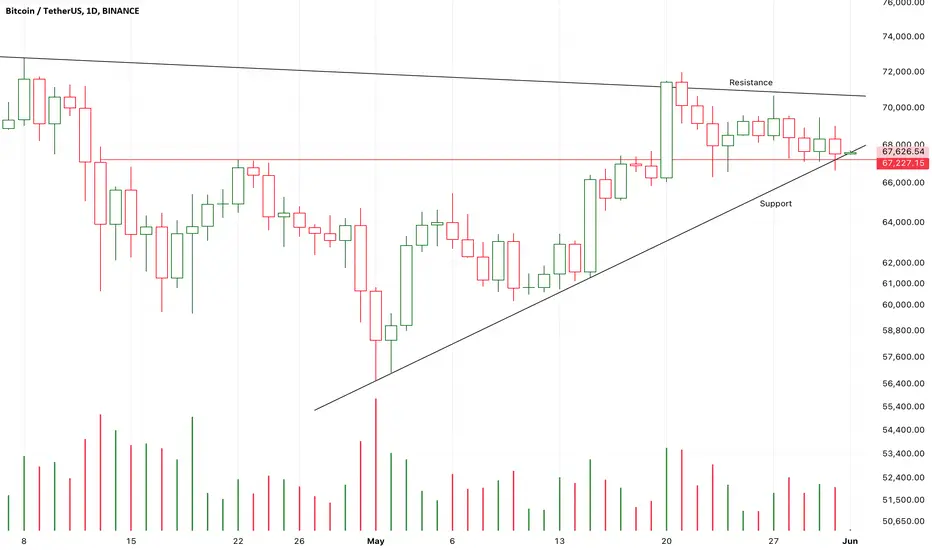
Chart Pattern Analysis Of Bitcoin
Trend Analysi:
From the chart, we can see that after experiencing a downtrend, Bitcoin's price is currently in a relatively stable consolidation range.
The recent price action shows Bitcoin fluctuating between $67,000 and $70,000. Although there have been several attempts to break through $70,000, they have all failed, and the price is currently around $67,650.
Support and Resistance Levels:
Support Level: The current support level is around $67,000, which is a strong support area. If the price breaks below this support level, it may further decline to around $60,000.
Resistance Level: The main resistance level is around $70,000. If the price can effectively break through this resistance, it may usher in a new round of upward movement.
Candlestick Patterns:
The recent candlestick patterns show a few bullish candles, but overall, the price movement is not significant, indicating market hesitation.
Observing the trading volume, we can see an increase in volume in recent days, indicating increased market activity, which may suggest a significant price movement ahead.
Conclusion
Combining the above analysis, Bitcoin is currently at a key support level, and the increase in trading volume indicates higher market activity. If it can hold above $67,000 and show signs of breaking upwards, it may be considered a good point to start building a long position. However, close attention should be paid to market movements and volume changes to prevent risks if the price breaks below the support level.
Operational Suggestions:
Aggressive Investors: Can start building long positions around $67,000, with a stop loss set below $66,000.
Conservative Investors: Wait for the price to break and hold above $70,000 before entering a long position to confirm the upward trend.
Please proceed with caution based on your personal risk tolerance and market conditions. It is advisable to combine this with other technical indicators and market information for comprehensive analysis.
Bitcoin will push to the upside BTC will go the upside with chart pattern inverted head and shoulder

Bitcoin_ Prices_ Under_ USDT _ Trading _ Venue _ Binance:Bitcoin_ Prices_ Under_ USDT _ Trading _ Venue _ Binance:
This will be 99.9% accuracy!
$73,304.76
$73,414.93
$74,430.44
$74,459.31
$74,998.31
Distribution price: $75,338.68

BTC resuming uptrend?Seems like supply is drying up, forming a contraction with inverse head and shoulders. Good probability of breakout on upside.
