BTC Price Prediction and Elliott Wave AnalysisHello friends,
Thank you for joining me in my analysis. Remember to like, subscribe, and stay tuned for more updates. See you soon!
Thanks, Bros
BTCUSDT.3S trade ideas


Manage your risk! My next trade🚨In todays video we talk about:
the importance of risk management as a fundamental pillar in trading
the global outlook on bitcoin
the local outlook on bitcoin
potential setups: sweeps of the internal range highs
Follow for more

BTCUSDTmy entry on this trade idea is taken from a point of interest BELOW an inducement.. I extended my stoploss area to cover for the whole swing as price can target the liquidity there before going as i anticipate.. just a trade idea, not financial advise

BTC Price Prediction and Elliott Wave AnalysisHello friends,
Thank you for joining me in my analysis. Remember to like, subscribe, and stay tuned for more updates. See you soon!
Thanks, Bros

Optimizing Returns: Position Sizing, Leverage and Spot TradingWhomever told you "Size doesn't matter" in trading, has never had a big "size" and probably just borrowed someone elses.
In the dynamic landscape of trading, where fortunes can be made and lost in the blink of an eye, various strategies vie for attention. Position sizing, leverage trading, and spot trading each offer distinct approaches to navigating the volatile markets. Understanding the nuances and risks associated with each is essential for traders seeking to optimize their returns while managing risk effectively.
Position Sizing: A Prudent Approach
Position sizing is a strategy that emphasizes determining the appropriate amount of capital to allocate to a trade relative to one's overall portfolio. Rather than relying on borrowed funds to amplify gains, position sizing focuses on prudent allocation and risk management.
Consider this scenario:
Here is something that happened to me recently:
Over a week ago I invested just $80 in #Bitcoin and the price moved 12% since
My return: $11.75
A few days ago I invested $1,000 in Bitcoin and the price moved only 3%
My return: +$26.00
Despite the smaller percentage gain in the first scenario, the return on investment is substantially lower due to the smaller position size.
This highlights a fundamental principle: the size of one's position significantly impacts the magnitude of returns. While the absolute gains may seem modest in the examples provided, they demonstrate the potential for consistent growth without the need for excessive risk-taking.
Leverage Trading: Temptation and Risk
Leverage trading offers the allure of magnified returns by allowing traders to control positions larger than their initial capital. However, this comes with inherent risks, including fees associated with borrowing and the potential for significant losses.
Many traders are drawn to leverage trading in pursuit of exponential gains. Yet, they often overlook the substantial risks involved. Despite the promise of greater returns, the reality is that losses can mount swiftly, eroding profits and even leading to negative balances.
Furthermore, the psychological toll of leverage trading can be significant. Constantly chasing high-risk, high-reward opportunities can result in emotional exhaustion and impulsive decision-making, fueling a cycle of loss and frustration.
Spot Trading: Proceed with Caution
Spot trading stands as a stalwart option for those seeking to invest without the complexities of leverage. However, even in this seemingly straightforward arena, there are nuances to be wary of, particularly when it comes to leveraging spot positions.
Spot trading entails purchasing and holding an asset with the expectation of long-term appreciation. Unlike leverage trading, where borrowed funds amplify gains and losses, spot trading relies solely on the investor's own capital. This approach is often favored for its simplicity and reduced risk exposure.
However, the temptation to employ leverage in spot trading can lead to unforeseen consequences. Leveraging spot positions increases the potential for losses, as the borrowed funds magnify both gains and losses. Moreover, the dynamics of unrealized and realized profit and loss (PnL) can confound inexperienced traders.
Finding Balance: The Art of Risk Management
The key to successful trading lies in finding the balance between risk and reward. While leverage trading offers the potential for rapid growth, it requires a disciplined approach to risk management. Instead of fixating on borrowed size, traders should focus on optimizing position size relative to their available capital.
Understanding the interplay between unrealized and realized PnL is crucial for making informed trading decisions in both leverage and spot trading. By exercising prudence and restraint, traders can optimize their returns while safeguarding against undue exposure to market volatility.
In the end, what truly matters is finding a harmonious balance between these strategies. Whether it's careful position sizing, navigating the highs and lows of leverage trading, or sticking to the grounded principles of spot trading, it's all about embracing a method that resonates with your risk tolerance and goals. With a keen understanding of the intricacies involved and a disciplined mindset guiding your every move, you'll be well-equipped to chart your course through the markets and seize every opportunity that comes your way.

BTC SIGNALS ALTCOIN SEASONWhen there is a new high on the chart for BTC, I believe ALTCOINS will severely out perform BTC

One of the strongest moving possibilities of BitcoinThis is not investment advice.
It only shows the strongest possible movement of Bitcoin for the higher time frame

Possible Cup and Handle pattern for BTC!Keeping an eye on BTC with fingers crossed it will go upwards and complete the cup and handle pattern it seems to have formed. Not financial advice and always DYOR!

Overbought vs Oversold - What do the Stochastic Levels mean?There is a lot of speculative information around the Stochastic RSI and its levels. Many strategies are just outright wildly false for example talking about crossovers of levels but I want to give you guys some insight of what these levels actually mean to help you better use the stochastic RSI. In this article I mention many levels but I want to focus on the 50 level or the MIDLINE depending on the Stochastic that you use.
I want to point out something very important here. The Stochastic was LEVER meant to be used as an entry exit tool so if youre trying to find the perfect settings to tell you when to GO / NO GO, stop looking. There arent any. No perfect timeframe, no perfect lengths, etc.
THis is to be used in combination with other tools and analysis to help confirm whats about to happen. The stochastic is lagging like any other indicator. But its calculation is very fast so you need to devise a plan of action on your charts well before putting it into use.
This articles content is based on a few things:
My experience with the Stochastic.
How it's math works.
What does momentum mean across an oscillator.
The physics of momentum and force. (Science stuff huh?)
So lets get into it.
First off if you want to get your hands on my special and custom version of the Stochastic, you can. Its on called "The Stocashi" A Heiken Ashi version of the stochastic with a few hidden features.
STOCASHI + Caffeine Crush: A heiken ashi stochastic
The Big Issue At Hand is the Stochastic 50 (mid level) value and what does it mean.
Let's talk about the Mid-Level (50) in the Stochastic Oscillator
Neutral Point - Midline
The 50 level in the Stochastic Oscillator represents a neutral zone where neither bullish nor bearish momentum is dominant. It is the midpoint between the extremes (0 and 100 in the traditional Stochastic).
Momentum Indication
Above 50: When the %K line is above 50, it indicates that the asset is gaining bullish momentum. The higher the value, the stronger the bullish momentum.
Below 50: When the %K line is below 50, it indicates that the asset is experiencing bearish momentum. The lower the value, the stronger the bearish momentum.
Trend Confirmation and Reversals
Crossing Above 50: If the %K line crosses above the 50 level, it may signal the beginning of a bullish trend or an increase in bullish momentum. Traders might look for additional confirmation from other indicators or price patterns.
Crossing Below 50: Conversely, if the %K line crosses below the 50 level, it may indicate the start of a bearish trend or an increase in bearish momentum.
Strength of Momentum
The distance from the 50 level reflects the strength of the current momentum. The farther the %K line is from 50, the stronger the momentum:
Near 100: Indicates strong bullish momentum.
Near 0: Indicates strong bearish momentum.
Near 50: Suggests weak or neutral momentum, which could mean consolidation or indecision in the market.
Market Conditions
Overbought/Oversold: Traditional overbought and oversold levels (80 and 20, or in your adjusted version 50 and -50) provide additional context:
Overbought: %K above 80 (or 50 in your version) suggests the asset might be overbought and due for a correction.
Oversold: %K below 20 (or -50 in your version) suggests the asset might be oversold and due for a bounce.
Relative Strength
The mid-level can also be seen as a relative strength indicator. Staying above 50 for extended periods indicates sustained strength, while remaining below 50 indicates sustained weakness.
Practical Interpretation
Trend Identification:
When the %K line is consistently above 50, it indicates that the asset is in an uptrend. Traders may use this information to stay long or look for buying opportunities.
When the %K line is consistently below 50, it suggests a downtrend. Traders might use this to stay short or look for selling opportunities.
Signal Filtering:
Crossovers of the mid-level can be used to filter signals. For example, a buy signal might be considered more valid if the %K line is crossing above 50, while a sell signal might be more valid if the %K line is crossing below 50.
Consolidation and Breakouts:
When the %K line hovers around 50, it can indicate a period of consolidation. A breakout from this zone can signify the start of a new trend.

BTCUSDT :I should analyze the American time, but I'm not at that time
Bitcoin has a range, that range of liquidation of people is high, which means that it may pump that area and we will have an upward trend.
You can give us up to 74,000 bitcoins
72190 is an important resistance for me. Go to the exchange book and look, wherever there is more book, put a stop buy there.
In three days, the weekly will be closed, either it has to be closed or it has to be rejected, if it is closed, we will go for 85 thousand.
The ascending wave that has started is much smaller than the previous ascending wave
Today, opening a short position is very risky, open a long position above 69639, that is, after 71644, it is a very good point to open a long position.
Early position is not necessary for Bitcoin, 71644 is good
BTC - Short-term View! Update...Hello TradingView Family / Fellow Traders. This is Richard, also known as theSignalyst.
📈As per my last analysis, attached on the chart, BTC rejected the blue circle and traded higher.
What's next?
🏹 For the bulls to maintain control, and take over from a long-term perspective, a break above the $72,000 resistance is needed.
In parallel, if the lower blue trendline is broken downward, a bearish correction would be expected.
📚 Always follow your trading plan regarding entry, risk management, and trade management.
Good luck!
All Strategies Are Good; If Managed Properly!
~Rich

BTC - Short-term View!Hello TradingView Family / Fellow Traders. This is Richard, also known as theSignalyst.
📈 BTC has been overall bullish, trading within the rising channel in blue.
Currently, BTC is undergoing a correction phase and it is currently approaching the lower bound of the channel.
Moreover, it is retesting a structure and trendline in red.
🏹 Thus, the highlighted blue circle is a strong area to look for trend-following buy setups as it is the intersection of the red structure and lower blue trendline acting as a non-horizontal support.
📚 As per my trading style:
As long as the red support zone holds, I will be looking for bullish reversal setups (like a double bottom pattern, trendline break , and so on...)
📚 Always follow your trading plan regarding entry, risk management, and trade management.
Good luck!
All Strategies Are Good; If Managed Properly!
~Rich

BTCUSDT Can Break the Bullish Flag Pattern....!Dear Traders,
We are convening a discussion focused on #BTCUSDT
A Bullish Flag Pattern is Formed
Now it's Ready to Break the Pattern
In Case of Successful Breakout, Expecting a Bullish Move of 20%🚀
#crypto #cryptocurrency #bitcoin #ethereum #blockchain #btc #cryptotrading #cryptonews #eth #cryptocurrencies #nft #bitcoinnews #bitcoins #trading #bitcoinmining #forex #binance #cryptoart #nfts#trading #forex #trader #investing #stocks #forextrader #stockmarket #daytrader #forextrading #invest #bitcoin #daytrading #cryptocurrency #crypto #investor #investment #forexsignals #nse #chartpattern #cedarforex #candlepatterns #learntrading #bseinstitute #shorttermtrade #bankniftytrading #stockmarketph #calloptions #mqlsignal #futuretrader #tradingmemes #chartpatterns #tradingview #tradinglife #tradinglifestyle #tradingstrategy #tradingtips #tradingplan #tradingsignals #tradingaccounts #tradingsignal #tradingforex #tradingsync #tradingroom #litecoin #ethereum #bitcoincash #cryptocurrencies #ripple #btc #bitcoinnews #bitcoinmining #blockchain #eth #bitcoin #bitcoins #coinbase #cryptocurrency #crypto #bitcointrading #dogecoin CRYPTOCAP:BTC CRYPTOCAP:ETH CRYPTOCAP:USDT CRYPTOCAP:PEPE CRYPTOCAP:DOGE NASDAQ:ALT

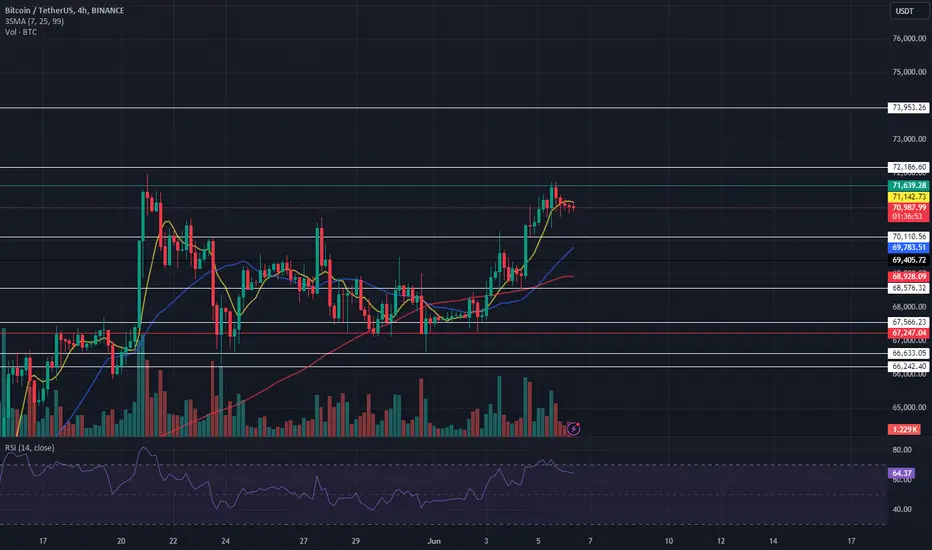
Bitcoin and altcoins overview(June 6-7)Yesterday we tried to consolidate above the volume zone in bitcoin , but so far unsuccessfully.
We are still trading within this zone.
Local expectations are the same, with a higher probability we will go for a small correction.
Globally, longs should be considered from the nearest buyer zones with the aim of renewing ATH.
Buyer zones: $70,000-$69,000 (pushing volumes), $68,200-$67,200 (accumulated volume), $64,500-$62,700 (pushing volumes), $61,200-$60,400 (volume zone) $58,500-$57,000 (volume anomalies).
Interesting altcoins.
For the TIA coin, it is worth considering a long, at least to the upper border of the local sideways, when forming this structure (consolidation above ~$10.6).
When the lower border is hammered, a strong buyback appears, as well as quite large volumes are formed, for the positioning of which it is interesting to observe.

December 2022 = major short squeeze???Boring times in the crypto market so great opportunity to analyze deeper than usual. What I have found is that when BTCLONG crossed above RSI 50 level (monthly close March 2021), a long squeeze followed and it is still going on since April 2021. With monthly closure of November 2022 BTCSHORT will close above RSI 50 so I wonder whether there would follow a major short squeeze like, long squeeze in April 2021. I draw a Fib retracement and maximum pain for both sides show us a price level of around $ 31000. Maybe a Santa rally till this level is coming? What do you think?

BTC 1 H /06.06.20204The market frequently created a structure like this when there is POI above. The price must tap an extreme POI before starts dropping.


BTC UPDATE#BTC did attempt to breakout and again closed before turning it into a fakeout. We have a support at $70,500 which price rejected and looks like it’s going for a retest now. A new HH is expected very soon, by the end as structure is bullish.

Bullish Continuation on BitcoinA Bullish Bat Pattern, discovered on the 4 Hour....first confluence
Confirmation Low put in....second confluence
Green Bullish Engulfing, suggesting aggressive buying from the bulls....third confluence

#BTCUSDT ( binance )A beautiful channel with two leading red resistors.
First, let's see what he does with the first one, until then......
Some bullish and bearish patterns are also evident in the chart.

Bitcoin $BTCUSD EoM ReviewBitcoin currently rangebound with areas of importance being:
$70,687.56 Buystop Liquidity
$66,312.16 Sellstop Liquidity
Macro: $59,005 - $72,797

Btc possibility 75k Friday evening sell off could be an amazing opportunity for easy pips. Wait for yor setup don't sell blindly at this level it may just blow off 5k points .
This is only one of many possibilities. Protect your account take possessions accordingly
