Bitcoin riding long term trendsIt’s looking like BTC is readying for a retest of $100k. Let’s see if the economy continues to expand in January or not.
Trade ideas

BitcoinBitcoin currently traded at third corrective bullish wave from recent lower high so forcasted retracement to range from 90k to 88k with invalidation point which close daily below 86k . Target for third bullish corrective wave is 102k .

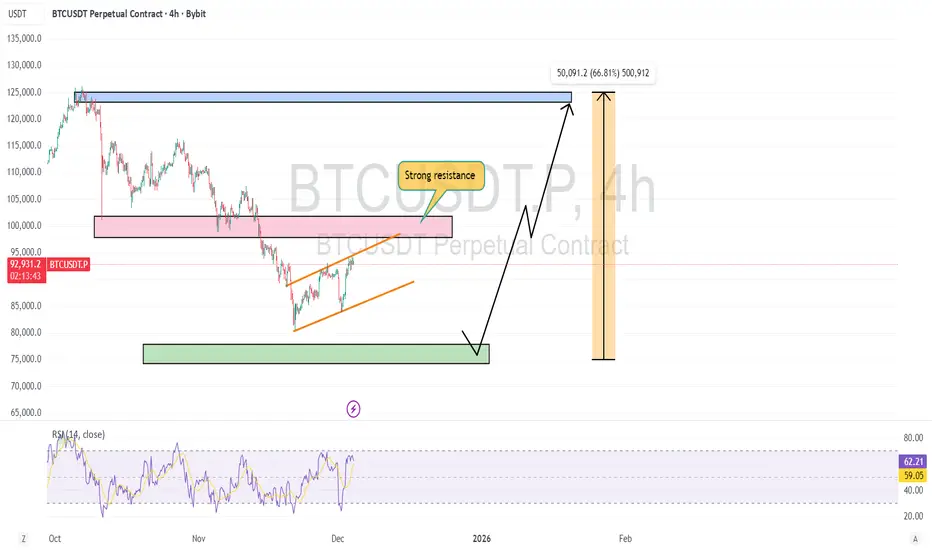
$BTC 4H CHART UPDATE 📌In my opinion, CRYPTOCAP:BTC has not fully recovered yet ✅
📌 CRYPTOCAP:BTC may turn bearish again from the STRONG resistance zone above ✅
📌I still have to say that a strong bull needs to touch a strong support zone🔥
Bitcoin Potentially break Shift to downside Bitcoin’s price a rising parallel channel. Price recently reached the upper boundary of the channel, entering a highlighted supply zone around 94,000. After touching this zone, the chart indicates a potential rejection.
A projected path is drawn suggesting small consolidation or minor pullback within the supply zone followed by a deeper downward move toward the mid-channel region and possibly extending toward the 88K support level a further extension toward 84K is marked as a deeper support target if the decline continues I expect Bitcoin price continue its downtrend if the price react we could see a more server sell off in the crypto market.
You may find more details in the chart,
trade wisely best of luck Buddies.
Ps; Support with like and comments for better analysis thanks for supporting.

BTC 4H Chart Review1. Market Structure: Rising Channel (Upward Wedge / Rising Channel)
The chart clearly shows that BTC is moving within an ascending channel, with:
the upper boundary around USD 95,000–95,500,
the lower boundary currently reaching USD 86,500–87,000.
This is a potentially exhausting formation, and lower breakouts are often dynamic.
2. Current Situation: Rebound from the upper band and Stoch RSI overbought → decline
The price has stopped exactly at the upper resistance of the channel and has begun a correction.
This is typical behavior – the market usually returns to the middle or lower edge of the channel.
Stoch RSI on 4H – has made a strong reversal from the overbought zone
→ a signal for a short-term correction has already been generated.
3. Support Levels (most important):
🔴 USD 90,500–90,000
A very important zone – previous resistance ⇒ now support.
Breakout = increased risk of a deeper breakout.
🔴 USD 88,500–88,000
A strong demand level for the 4-hour period, also aligned with the MA and local lows.
🔴 USD 86,500–87,000
The lower band of the channel – the most likely place for buyers to become active.
4. Resistance Levels:
🟢 USD 94,800
Previous local high – a breakout will be bullish.
🟢 USD 98,000–98,900
Strong resistance on the chart, likely target after a breakout of the channel to the upside.
5. Scenarios for the coming hours:
📉 Correction scenario (more likely based on the Stoch RSI)
The price could fall to one of the following zones:
92,000 → test in progress
90,500–90,000 USD → main market decision level
If it loses 90,000 → a move to 88,500–88,000 is natural.
Deeper correction: test of the lower channel line – ~86,500 USD.
In this scenario, we remain in an uptrend unless the channel breaks below.
📈 Uptrend scenario
The current decline could only be:
a local correction,
a retest of the previous demand zone.
Uptrend condition:
➡️ 4-hour candlestick retracement and close above ~94,000 USD.
Then the target:
94,800
95,500
and after the channel breakout → $98,000–$99,000

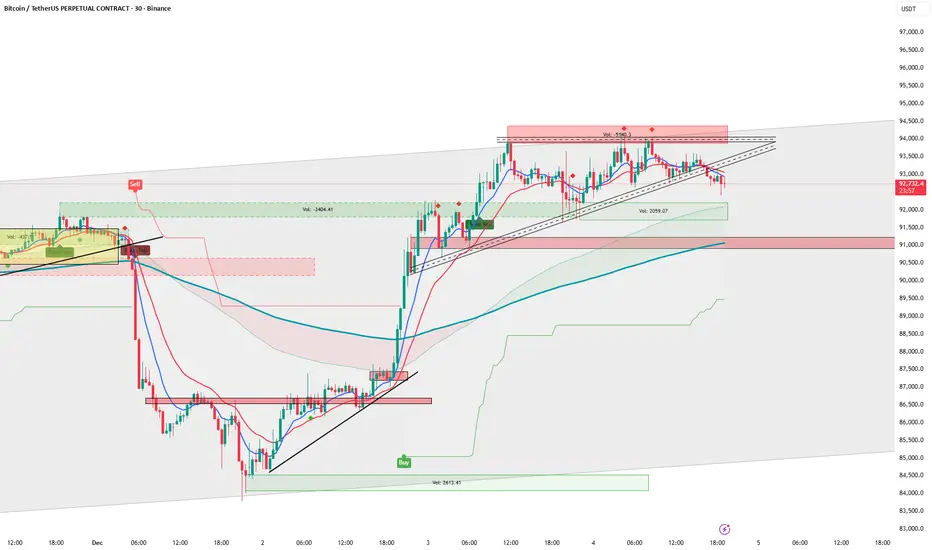
BTCUSDT.P 30min Short Setup: 92,799 Testing Support BreakdownBTCUSDT.P at 92,799 on 30min consolidates near lows (92,610), with SELL signals strong amid tight range post-pullback.
Bitcoin Analysis (4H)Bitcoin is in a bearish phase. It appears that Wave C of the bearish phase has transformed into a dimaetric.
The price is expected to bounce back from the green zone toward the upside, and then we may see the main rejection from the red box. The bullish wave we are expecting for Bitcoin corresponds to Wave D.
Let’s see whether a double bottom forms to support the price upward or not.
A daily candle close below the invalidation level will invalidate the bullish Wave D.
For risk management, please don't forget stop loss and capital management
When we reach the first target, save some profit and then change the stop to entry
Comment if you have any questions
Thank You

BTC/USDT Analysis. Reached Key Resistance
Hello everyone! CryptoRobotics trader-analyst here, and this is your daily market update.
Yesterday, Bitcoin reached the important resistance area at $94,000–$97,500 (high-volume zone). At this level, buyer price action weakened noticeably, and cumulative delta shows a clear dominance of sellers — indicating that upward momentum is fading locally.
Given this context, we expect a correction toward the nearest support zones, from which the uptrend may resume with targets above $100,000.
A move back into the $84,000–$82,000 (volume anomalies) zone from current prices would cast doubt on the strength of the current bullish wave, making this scenario unfavorable for continued growth.
Buy Zones
$91,000–$89,800 (mirror volume zone)
$87,800–$86,400 (volume zone)
$84,000–$82,000 (volume anomalies)
Sell Zones
$94,000–$97,500 (volume zone)
$101,000–$104,000 (accumulated volumes)
$105,800–$106,600 (local resistance)
This publication is not financial advice.

The Hidden Skill Every Great Trader Masters; And It’s Not Chart!Most traders spend years perfecting chart patterns, indicators, and entries…
Yet only a handful ever master the real skill that separates professionals from the rest, the art of waiting.
📉 Anyone can draw support and resistance.
📈 But not everyone can wait for price to reach them.
The market rewards patience, not predictions.
It’s not about catching every move, it’s about being ready when your setup aligns perfectly.
That’s when you strike. That’s when probability works for you, not against you.
Think of trading like fishing 🎣:
You don’t chase the fish, you position your line where it’s most likely to bite, then you wait.
So next time you feel the urge to jump in early, remind yourself:
You’re not just a trader. You’re a waiter, paid in precision and patience.
📚 Key takeaway:
Great traders don’t predict, they prepare.
They let the market move first, then respond with clarity.
⚠️ Disclaimer: This is not financial advice. Always do your own research and manage risk properly.
All Strategies Are Good; If Managed Properly!
~Richard Nasr

BTC (bitcoin) Double-Bottom Reversal Testing Key ResistanceHi!
The chart shows Bitcoin forming a clear double-bottom pattern, supported by bullish RSI divergence on the lower panel. This combination often signals exhaustion of downward momentum and a potential trend reversal. The price has rallied strongly from the second bottom and is now pressing directly into the neckline zone, which aligns with a broader descending trendline drawn from previous swing highs.
This overlap creates a high-confluence resistance area. The current reaction here is critical: if price decisively breaks above the neckline and closes above the descending trendline, it would confirm the reversal structure and open the path toward the next major liquidity pocket around the 100k–104k region, marked on your chart as the target. This region matches previous consolidation and supply, making it a realistic upside magnet if breakout momentum is strong.
However, without a confirmed breakout, the neckline remains a potential rejection level, and price could retest the mid-range or even revisit trendline support. Bulls need continuation volume above resistance to flip the zone into support.
Overall, market structure has shifted from aggressive selling to a constructive bottoming phase. The key now is whether bulls can convert this pattern into a sustained trend reversal.

BTCUSDT Reversal Play: My High-Probability Short Setup ## 🟠 BTCUSDT Reversal Play: My High-Probability Short Setup with Defined Risk
### 🧠 Why I’m Taking This Trade
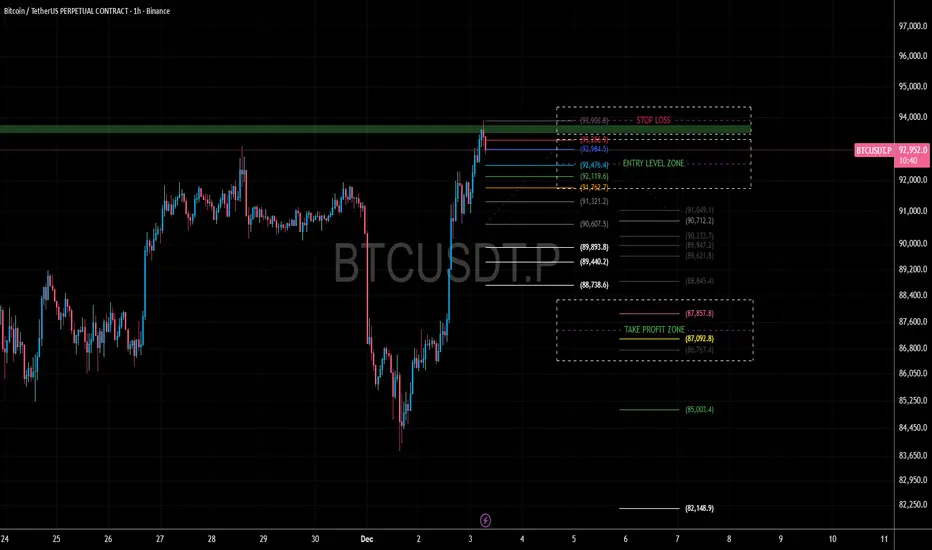
I’m positioning for a **short trade** on BTCUSDT after observing a sharp upward move followed by signs of exhaustion and a potential reversal. The recent rally pushed price into a zone where I expect sellers to step in. My goal is to catch the retracement while keeping risk tightly controlled.
I’m entering between **92,284.5 and 92,826.5**, which is a zone I’ve identified as a likely turning point. This area aligns with previous resistance and shows signs of rejection on lower timeframes.
### 🔍 What I’m Seeing on the Chart
- **Current Price**: 92,897.6
- **Recent High**: 93,903.8
- **Entry Zone**: 92,284.5 to 92,826.5
- **Stop Loss**: 93,903.8
This is placed just above the recent high to protect against a breakout continuation.
- **Take Profit Zone**: 86,767.4 to 87,857.8
These levels are based on prior support zones and Fibonacci retracement targets.
### 📊 Risk vs Reward
This setup offers a strong edge. I’m risking about **1,077 points** (from 92,826.5 to 93,903.8) to potentially gain **4,969 to 6,059 points** (down to the TP zone). That gives me a **risk-reward ratio between 4.6 and 5.6**, which is excellent for a swing short.
### 🧭 My Strategy in Simple Terms
- I’m not shorting blindly—I’m waiting for price to enter a zone where sellers have previously shown strength.
- My stop is placed above the recent high, so if price breaks that level, I know the setup is invalid.
- My targets are realistic and based on previous support zones where buyers may re-enter.
This is a **structured, disciplined trade** with clear boundaries. I’m not guessing—I’m following a plan based on price behavior, structure, and risk control.
TradeCityPro | Bitcoin Daily Analysis #237👋 Welcome to TradeCityPro!
Let’s move on to the Bitcoin analysis. The market experienced a strong drop yesterday, and with the start of a new week and a new month, a fresh trend is beginning to form.
⏳ 1-Hour Timeframe
Yesterday, we had a long trigger on Bitcoin at 91,089. After activation, the price moved upward toward 91,813.
🔔 The 91,813 level was our next long trigger, and breaking it could have pushed the price toward the main resistance at 93,555.
✔️ But that didn’t happen.
The price was rejected from 91,813, and gradually, selling pressure increased across the market.
📊 Once the price stabilized below 90,421 — which was our short trigger — the main bearish move began. Bitcoin dropped sharply with a large bearish candle all the way down to 85,770.
🔍 The support zones at 89,082 and 87,942 did not hold either, because the move was extremely sharp and the price ignored them entirely.
💥 If you remember, we also had a momentum support on the RSI at 42.11.
💫 Once RSI stabilized below that level, the bullish momentum completely disappeared. Momentum shifted fully to bearish.
⚡️ Right now, RSI is still in the oversold zone and is pulling back toward the 30 level.
⚖️ If RSI starts moving downward again from here, Bitcoin has the potential to drop much further.
💡 Today, opening a position is much riskier than yesterday, but if you missed the move, breaking 85,770 isn’t a bad option for a continuation short.
✨ Just be careful: the market today is far more risky, so take positions with smaller risk and tighter management.
❌ Disclaimer ❌
Trading futures is highly risky and dangerous. If you're not an expert, these triggers may not be suitable for you. You should first learn risk and capital management. You can also use the educational content from this channel.
Finally, these triggers reflect my personal opinions on price action, and the market may move completely against this analysis. So, do your own research before opening any position.

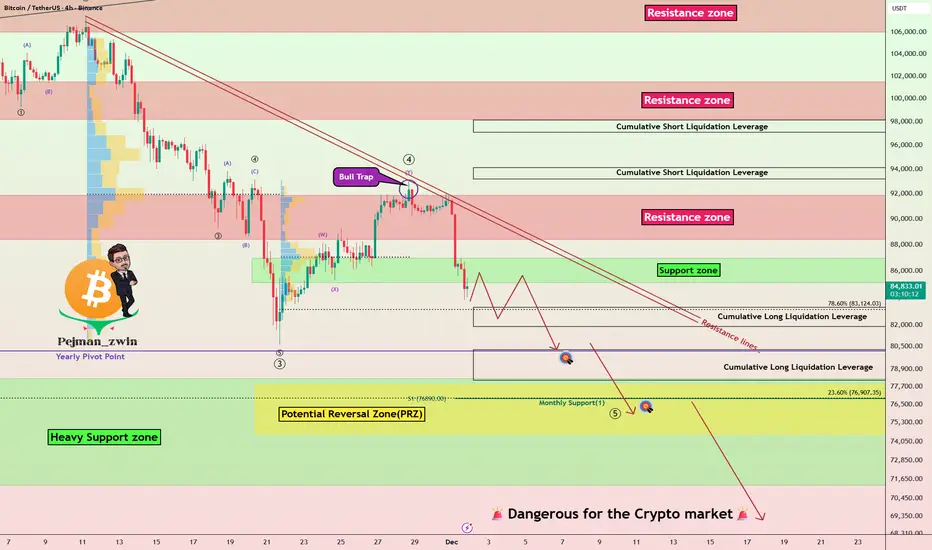
Bitcoin’s Worst November Ever — More Dump?In the past 24 hours, Bitcoin( BINANCE:BTCUSDT ) has dropped by more than -8%, marking its worst November performance ever, with a decline of about -17.67% this month alone.
Now, the question is whether Bitcoin will continue its downward trend or start to rebound. So, stay tuned!
At the moment, it seems that Bitcoin has successfully broken through the support zone($87,000-$85,130) and is moving toward the Cumulative Long Liquidation Leverage($83,273-$81,900).
From an Elliott Wave perspective, it appears that Bitcoin has completed its main wave 4, forming a bull trap, and is now in the process of completing the main wave 5.
On the fundamental side, we need to pay attention to a few key factors:
1-For one, the USDT.D% ( CRYPTOCAP:USDT.D ) is on the rise, and this could put downward pressure on the crypto market.
2-Another point is that the stock market is also trending upward, but unlike stocks, Bitcoin tends to react more negatively when the stock market declines.
3-The US 10-Year Government Bond Yield ( TVC:US10 ) also appears to be trending upward, causing riskier assets like stocks and Bitcoin to decline.
4-Additionally, geopolitical tensions, especially between the US and Venezuela over the past 72 hours, could also trigger further declines in Bitcoin if they escalate.
Considering all of this, I expect Bitcoin to continue its downward trend and test the heavy support zone($78,300-$71,280). The Potential Reversal Zone(PRZ) might serve as a rebound point for Bitcoin, but if the heavy support zone($78,300-$71,280) is broken, we could see a more severe sell-off in the crypto markets.
What do you think? Will Bitcoin drop below $70,000 or not? Let me know your thoughts!
Cumulative Short Liquidation Leverage: $97,100-$98,135
Cumulative Short Liquidation Leverage: $93,215-$94,130
Cumulative Long Liquidation Leverage: $80,263-$78,131
First Target: Cumulative Long Liquidation Leverage: $80,263-$78,131
Second Target: Potential Reversal Zone(PRZ)
Stop Loss(SL): $90,423
Points may shift as the market evolves
💡 Please respect each other's opinions and express agreement or disagreement politely.
📌Bitcoin Analysis (BTCUSDT), 4-hour time frame.
🛑 Always set a Stop Loss(SL) for every position you open.
✅ This is just my idea; I’d love to see your thoughts too!
🔥 If you find it helpful, please BOOST this post and share it with your friends.
Uptrend confirmed It's best to operate from confirmations, even when you know you're right
I have all the confirmations I need to confirm the we are in an uptrend on Bitcoin

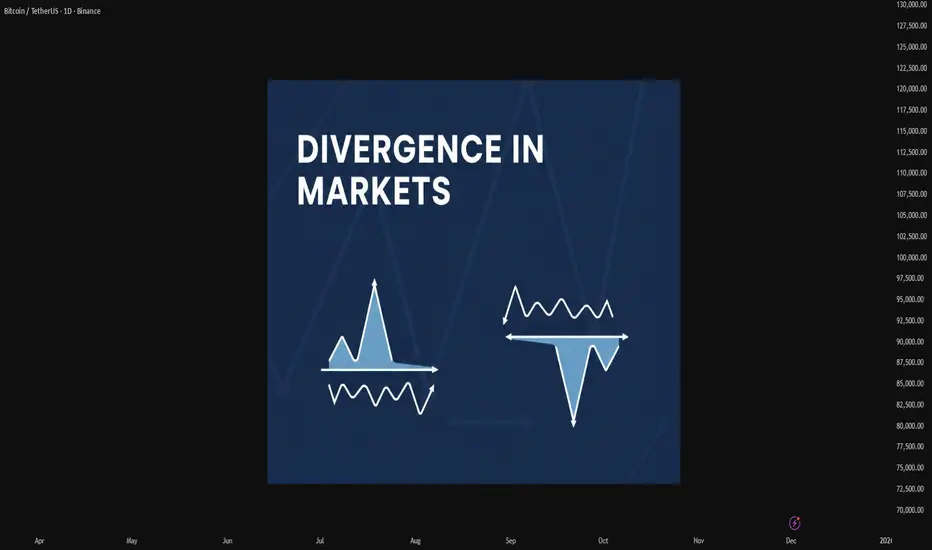
Mastering Divergence in Technical AnalysisIn technical analysis, a divergence (also called a “momentum divergence” or “price/indicator disagreement”) is one of the most powerful early warning signals available to traders. In simple terms, divergence occurs when price and a momentum indicator (such as RSI, MACD, or Awesome Oscillator etc.) move in opposite directions.
This disagreement often signals that the current trend is losing strength and that a pause, pullback, or full reversal may be approaching.
1. What Is Divergence?
Normally, in a healthy trend:
In an uptrend, price makes higher highs and momentum indicators also make higher highs.
In a downtrend, price makes lower lows and momentum indicators also make lower lows.
A divergence appears when this alignment breaks.
Typical example with RSI or MACD:
Price makes a higher high,
But the indicator makes a lower high.
This tells us that, although price has pushed to a new extreme, the underlying momentum is weaker. Smart money may be taking profits, and the late participants are driving the final leg of the move.
2. Types of Divergence
There are two main families of divergence:
Regular (classic) divergence – often associated with potential trend reversals.
Hidden divergence – often associated with trend continuation after a correction.
Within each family, we have bullish and bearish versions.
2.1 Regular Bullish Divergence – Potential Trend Reversal Up
This suggests that sellers are still pushing price to new lows, but momentum is no longer confirming the strength of this selling pressure. The downtrend is weakening and a bullish reversal may develop.
Context where it’s most powerful:
After a prolonged downtrend.
At or near a higher-timeframe support level (daily/weekly support, major demand zone, trendline, or Fibonacci confluence).
2.2 Regular Bearish Divergence – Potential Trend Reversal Down
This signals that buyers are still able to push price higher, but each new high is supported by less momentum. The uptrend is aging, and a bearish reversal or deeper correction becomes more likely.
Context where it’s most powerful:
After a strong, extended uptrend.
Around major resistance levels, supply zones, or upper trendlines.
2.3 Hidden Bullish Divergence – Trend Continuation Up
Here, price structure still shows an uptrend (higher lows), but the indicator has overshot to the downside. This often appears during pullbacks within an uptrend, suggesting that the correction is driven more by short-term emotion than by real structural weakness.
Interpretation:
Hidden bullish divergence indicates trend continuation. Bulls remain in control, and the pullback may provide an opportunity to join the uptrend at a better price.
2.4 Hidden Bearish Divergence – Trend Continuation Down
Price structure still favors the bears (lower highs), but the indicator has spiked higher, often due to a sharp counter-trend rally. This suggests that the bounce is corrective rather than the start of a new uptrend.
Interpretation:
Hidden bearish divergence favors continuation of the downtrend and often appears before the next impulsive bearish leg.
3. Which Indicators to Use?
Divergence can be spotted on many oscillators, but the most commonly used are:
RSI (Relative Strength Index) – very popular for spotting overbought/oversold zones and divergences.
MACD (and its histogram) – useful for trend and momentum, especially on higher timeframes.
Stochastic Oscillator – often used in range-bound environments.
Awesome Oscillator, CCI, etc. – alternative momentum tools, depending on your preference.
The concept is the same: price and indicator should generally confirm each other. If not, you have a divergence.
4. Timeframes and Reliability
Divergences can be found on all timeframes, but their reliability increases with higher timeframes:
On M5–M15, divergences are frequent but often short-lived. Better for scalpers.
On H1–H4, signals have more weight and can lead to multi-session moves.
On Daily/Weekly, divergences can mark major tops and bottoms, but they may take longer to play out.
A good practice is to:
Identify major divergences on higher timeframes (H4, Daily).
Refine entries on lower timeframes (M15, M30, H1) using structure and price action.
5. How to Trade Divergences (Practical Framework)
Divergence by itself is not a complete trading system. It is a signal of potential imbalance, which should be combined with:
Key levels (support, resistance, supply/demand zones).
Trend structure (higher highs/lows or lower highs/lows).
Price action confirmations (reversal candles, break of structure, etc.).
Risk management (position sizing, stop loss, invalidation level).
6. Common Mistakes When Using Divergences
- Trading every divergence blindly.
Not every divergence leads to a big reversal. Many will result in only minor pullbacks.
- Ignoring the trend.
Regular divergences against a strong trend can fail multiple times before a real top or bottom forms. Hidden divergences are often more reliable in trending markets.
- Forcing divergences where they don’t exist.
Only connect clear, obvious swing highs and lows on both price and indicator. If you have to “stretch” the lines, the signal is probably weak.
- No risk management.
A divergence is just a probability edge, not a guarantee. Always define invalidation and manage position size accordingly.
7. Best Practices
Combine divergence with market structure (trendlines, channels, higher highs/lows).
Use higher-timeframe context and drop to lower timeframes for refined entries.
Pay attention to confluence:
Divergence + key level + candlestick signal is stronger than any single factor.
Keep a trading journal of divergence setups, including screenshots from your charts. Over time, you will see which conditions work best for your style.
Divergences are not magic, but they are one of the cleanest ways to see when price and momentum disagree. Used correctly, they can:
Help you avoid entering late in a trend,
Alert you to potential reversals before they are obvious to the crowd, and
Provide high-probability continuation entries via hidden divergences within strong trends.
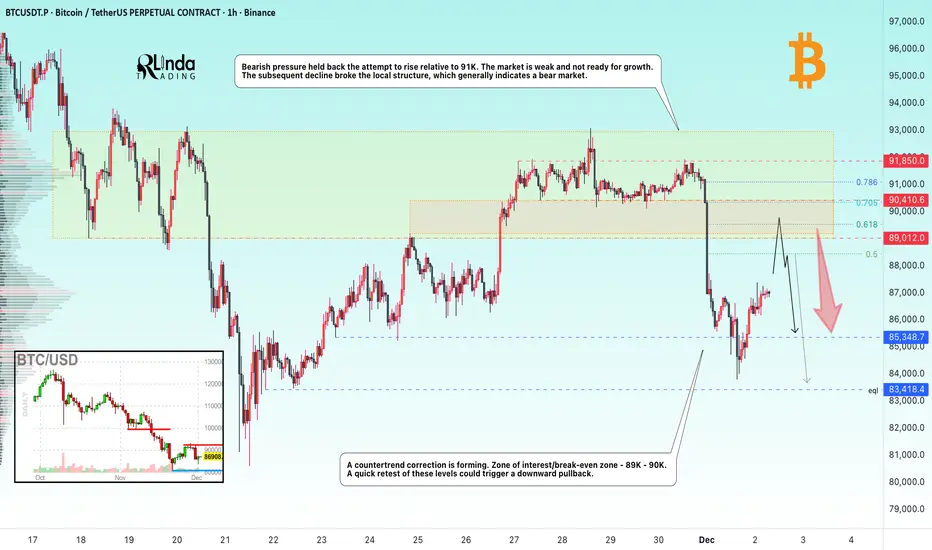
BITCOIN → The hunt for liquidity before the fallBINANCE:BTCUSDT.P continues to update lows within the global downtrend. The retest of 91K confirmed the dominance of bears...
The downtrend continues. The technical and fundamental situation for the crypto market is neutral to weak.
Bearish pressure held back the attempt to rise relative to 91K. The market is weak and not ready for growth. The subsequent decline broke the local structure, which generally indicates a bear market, but after updating the local minimum to 83700, a countertrend correction is forming. Zone of interest/break-even zone - 89K - 90K. A quick retest of these levels could trigger a downward pullback.
Resistance levels: 89K, 90K
Support levels: 85,400, 83,400
A retest of the range boundary and zone of interest could trigger a liquidity squeeze and a further decline if the bears keep the price below these boundaries.
Best regards, R. Linda!
TradeCityPro | Bitcoin Daily Analysis #238👋 Welcome to TradeCity Pro!
Let’s move on to today’s Bitcoin analysis. The market is currently in a correction phase after the bearish leg it experienced yesterday.
⏳ 1-Hour Timeframe
After the drop Bitcoin made, even fake-breaking the 85,220 level,
✔️ the price has started its correction, reaching up to 87,088.
🔔 During this correction, a Head & Shoulders pattern has formed, with the activation trigger being the 87,088 level.
💥 If this pattern gets activated, deeper corrections could follow.
The next resistance zone to watch is 89,082.
📊 Market volume has increased with the start of the new week, but during this correction, the volume is decreasing. This indicates that the downtrend still holds strength, and the likelihood of the trend continuing remains high.
💡 In this case, we can open a short position either after a fakeout at 89,082 or by confirming a Dow Theory breakdown.
The main short trigger right now is the 85,220 level.
📈 For a long position, breaking 89,082 is a risky trigger.
Personally, I prefer to wait for more confirmation before deciding to enter a long position on Bitcoin.
❌ Disclaimer ❌
Trading futures is highly risky and dangerous. If you're not an expert, these triggers may not be suitable for you. You should first learn risk and capital management. You can also use the educational content from this channel.
Finally, these triggers reflect my personal opinions on price action, and the market may move completely against this analysis. So, do your own research before opening any position.

#BTC Continues Deepening Correction?📊#BTC Continues Deepening Correction?
🧠From a structural perspective, we are still in a daily-level correction phase, with a short-term downtrend. Therefore, until a bullish structure is established within the same timeframe, we need to be wary of further pullbacks. We can only maintain an optimistic outlook after reversing the blue resistance zone.
➡️Therefore, short-term support is around 85358. If we continue to break below the low L, then we need to pay attention to the next support zone at 69000-74500.
Let's see 👀
🤜If you like my analysis, please like 💖 and share 💬
BITGET:BTCUSDT.P

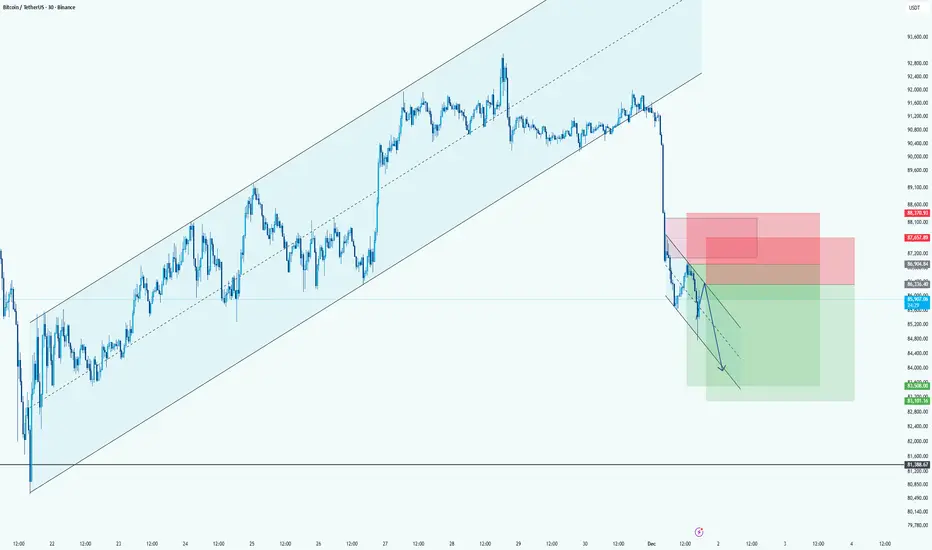
BTC: Bearish Continuation Setup After Major Channel BreakdownHi!
Price broke hard below the long-term ascending channel, confirming a clear shift from bullish to bearish momentum.
After the breakdown, BTC is moving in a small descending correction channel, creating a classic lower-high retracement toward supply.
Direction: Short
Entry Area: 87,200 – 88,300 (two stacked red zones)
Stop-Loss: Above 88,700–89,000 (top of supply)
Target: 83,000 – 84,800 (large green demand area)
BTCUSDT — Correction Ending? Potential Bullish ContinuationAccording to signals from my custom indicator, the recent correction appears to be approaching its end.
Although the indicator itself is not shown on the chart, the analysis here is based on the same reversal conditions that it typically detects.
The market is currently holding above a key local support area, forming a potential higher low — a structure that often precedes bullish continuation. Price reacted similarly in previous cycles, where a series of higher lows led to upward momentum.
Key points of my analysis:
My custom indicator suggests that the corrective phase is weakening.
Price is stabilizing near support, showing reduced selling pressure.
Previous market swings formed similar patterns before moving higher.
A breakout above the nearest resistance zone could confirm the continuation of the uptrend.
This scenario reflects one possible outcome based on indicator-derived signals and market structure.
I will update the idea if conditions change.

Bitcoin's daily chart on fire
Daily time frame with a medium-term view
1. Market trend:
Downward trend
2. Supports and resistances:
Support levels:
1- 84.646
2- 76.236
3- 67.672
Resistance levels:
1- 100.889
2- 110670
3- 123.410
3. Technical tools and indicators:
The RSI oscillator has reached near the oversold zone again after a short-term rest, and if it enters the oversold zone, it could signal further price declines.
4. Price patterns:
No specific pattern is observed.
5. Trade volume:
The trading volume is increasing in the downward trend.
Market scenarios ahead:
- Price increase scenario (bullish):
For the bullish scenario, we need the price to close above 100889; in that case, the targets of 110670 and 123410 are accessible.
- Price decrease scenario (bearish):
If the candle closes below the price of 84646, we enter the bearish scenario, in which case the targets of 76236 and 67672 are accessible.
Final note:
This view is merely a personal analysis, and the responsibility for trading transactions rests entirely with the trader. Always consider proper and safe risk management.
#Technical_Analysis #Financial_Markets #closetrader

01/12/25 Weekly OutlookLast weeks high: $93,088.10
Last weeks low: $85,279.04
Midpoint: $89,183.57
A brutal start to the week for the bulls here. A -6% move to the downside as soon as the Month of December opens rejecting off the range weekly high. Across the high time frame this confirms a new lower high and a failure to get back within the trend that has stayed consistent throughout this bull market.
All of last weeks recovery bounce has been wiped out in a matter of hours, so now the question is where does the buy side pick up, if at all? FOMC interest rate decision is predicting another rate cut (80% probability) as well as the end of quantitative tightening and the beginning of quantitative easing on paper should bring more liquidity into risk-on markets such as Bitcoin, but that is on a longer timescale.
In the more immediate time frame I think the range broadly $80,000-$100,000 with this weeks range seeing a lot of the noisy PA. Midpoint is a key S/R level to gauge sentiment and conviction, a reclaim of the level may open the door to a stop loss hunt around weekly high but for now the momentum is definitely with the bears.

BTC LongThis is a reversal trade, so be careful!. When its reversal trade, stick to SL regardless.
The reason for the trade is as simple as higher lows on 4h tf, broke a downtrend line.
Good luck everyone !!
