Bitcoin growthlook this chart
whithout tecnical
auto_awesome
Translate from: Persian
Just a simple look.4How is it possible that this chart does not grow?
BTCUSDT.3S trade ideas

BTC/USDT ; Is the shedding over?Hello friends
Due to the price correction we had, the price has bounced back into a good support area where there were many buy orders and has reacted well.
Now it remains to be seen whether it will succeed in defeating the trading pain or not.
If buyers continue to support the price, it could break the range and move towards the specified targets.
*Trade safely with us*

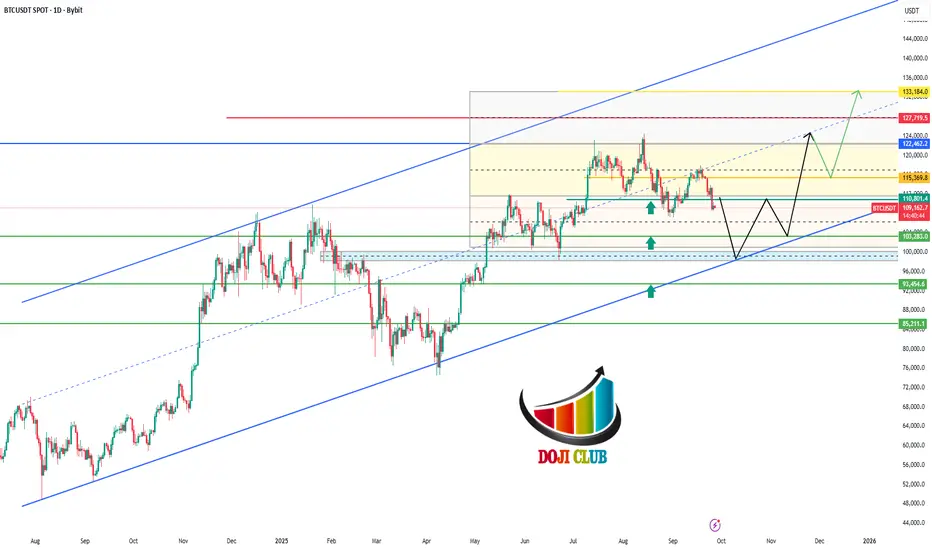
Bitcoin to retest the trendline the formation of a third leg on the trendline before a bullish takeoff is expected on the daily TF. Bitcoin on a bullish trend mean we can only anticipate a buy eventually it didn't break the trendline. the price is expected to reach the 130,000 price level.

$BTC not too late to get outWe've been seeing a downward channel and bounce down off the top wedge. Technicals confirm this as well as UltraShort signals. There's a bit more to give (bleed). If you're up now, it's a good time to get out and stay on the sides. With the looming gov shutdown and ultra high markets, the recipe for a good pullback is high. Inverse ETFs CBOE:MSTZ CBOE:UVIX could play nicely.

BTC to go Parabolic to $333K, ~100 oz Gold by EOY 2025 Gold and Bitcoin are both valuable hard assets and from my observation, the Bitcoin chart to Gold is much better predictable than it's price to USD. The reason might be because Gold holds it's purchasing power over time through the history, and in fact it is the base line for the purchasing power, but Dollar depends on how much it gets printed and cannot be reliably predicted. That's why when you look at BTC/Gold chart, most of the times you see exact double tops or exact double bottoms.
I was predicting BTC would get to $100K USD when it hits it's previous top to Gold (37 oz) and so I was predicting about 8 month before it happens that BTC will be $100K when Gold is 2650 and it happened. I was surprised myself that it held true.
Looking into Gold price history, we can reliably say that Gold will not stop here and will march to $8000 within couple of years. However I think it has hit it's top for the year, or max $4000 will be the 2025 top. Then when Gold pulls back, BTC will get the chance to go parabolic, and has it's last rise of this bull market, and I expect it should take BTC to near 100 oz Gold. So if we want to put all together, Gold = 3350 where it pulls back and BTC= 100 oz = $335,000. I know the Bitcoin whales are playful sometimes, so we might get into $333,333 per BTC.
I remember in Nov 2013 everyone was talking about bitcoin flipping gold (1 BTC getting to 1 oz Gold) and well, it didn't happen at that time and it had to come back in 2017, but it got close enough. We might have the same kind of situation here so starting to drop anywhere from $270k to $330k might be what we get.
I don't publish many analysis's on TV, but I thought I'd put this here, it might get me famous ;)

$8 Billion Bitcoin Accumulation Could Launch Price to $115,000At the time of writing, Bitcoin is trading at $111,966, just shy of the $112,500 resistance. The recent bounce from below $110,000 reflects investor demand, but breaching key resistance remains critical for further upside momentum.
If Bitcoin successfully climbs past $112,500, the crypto king could reclaim $115,000 as a support level. This would open the door for a rally toward $120,000 in the coming days, fueled by accumulating investor demand and reduced selling pressure on exchanges.
However, failure to overcome $112,500 resistance would expose Bitcoin to further downside risks. A drop back to $110,000 or even $108,000 remains possible. This would invalidate the bullish outlook and trigger renewed skepticism about Bitcoin’s near-term recovery.

Bitcoin Liquidity GrabBitcoin came back into discount pricing (between the swing low and swing high), and it looks like it is still waiting for the next catalyst for the next leg up.
We are currently still in the weekly imbalance, which a lot of times will act as a demand zone. Before we can take a long position, we need to clear the "bump in the road" — or in this case, liquidity.
I will wait for price to take out the liquidity under the equal lows around 107.2k, and then I’ll wait for a CHoCH on the 1H–4H before looking for a long trade.
Happy trading,

BTC Market Update📊 BTC Market Update
BTC is forming a contracting pattern — price is getting tighter ⚡
This usually means a big move is coming soon 🚀📉
Breakout could happen up or down — stay ready and wait for confirmation before entering.

BTC Idea.As we approach the month of October and the rate cut/s possibly coming during the coming months I think that BTC has found support and will bounce soon to reach ATH and create new ones.
Tell me on your comments what do you think.
Thank you and stay safe.

BTC Trade Plan 27/09/2025-Where to Buy BTC !!!! Dear Traders,
📊 Bitcoin (BTC) Technical Analysis
BTC is currently trading around 109,000 and remains under bearish pressure within a corrective channel. Price is approaching the major support zone (103,000–101,000), which also aligns with the long-term ascending trendline.
🔻 If the price reaches this area and holds, we could see a strong bullish rebound and continuation of the long-term uptrend.
⚠️ But if Bitcoin breaks down with a daily close below this support, further decline toward 95,000–92,000 would be likely.
🟢 Key Support: 101,000 – 103,000
🔴 Key Resistance: 112,000 – 115,000
💡 The upcoming move into the support zone will be crucial in shaping Bitcoin’s mid-term trend.
Regards,
Alireza!

Bitcoin started the dropHi traders,
I show you week after week what price will do. My outlooks are 80% accurate so I hope you benefit from it.
Last week Bitcoin started the drop, made a small correction up and dropped again.
Now we could see another correction up and a downmove after that.
Let's see what the market does and react.
Trade idea: Wait for the (small) corrective upmove to trade shorts after a change in orderflow to bearish on a lower timeframe.
If you want to learn more about trading FVG's with wave analysis, please make sure to follow me.
This shared post is only my point of view on what could be the next move in this pair based on my analysis.
Don't be emotional, just trade your plan!
Eduwave

BTC : Bitcoin's path until the end of 2025Bitcoin is in a short-term correction and is poised to set new records by the end of 2025.
BTC to 101,000$As we see bitcoin is making correction & we now in the wave C also there is head & shoulders pattern support that correction, eyes on 101,300$ to be the next supporting area which the market will go bullish from this price to continue the bullrun

BTC TREND CHANNEL - BITCOIN TRENDING UPTRENDBitcoin is in a new uptrend on the lower time frames. There is a high chance BTC will target between $112K and $113K in the short term. From there, we could see the daily trend of Bitcoin develop further.
Follow this channel for daily BTC updates
Thank you

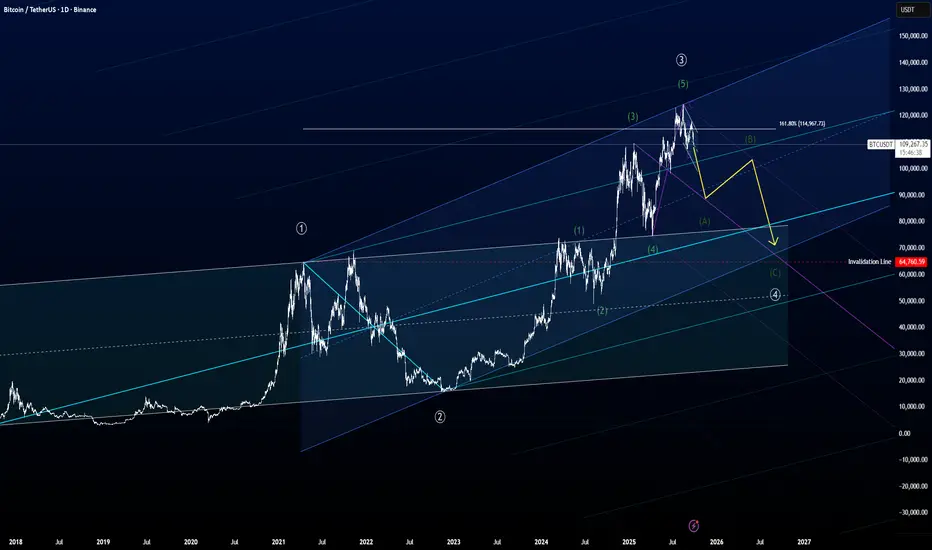
BTC has started going down the slope..I can easy count 5 green intermediate waves up.
Last top was just above the 161,8% fib level of primary white ((1)).
It's outside of the pitchfork, it's outside of the white base channel indicating the primary white 3 was underway.
By having a good 5 wave structure in the last wave up, I believe this is the intermediate green 5 wave done, and hereby primary white 4 has started.
How low can it go? By a rule from Elliott, wave 4 cannot enter the territory of wave 1, so this would mean the absolut low of wave 4 would be at the 64,760 level.
After we had, what I counted as a primary white wave 2 formed as a flat, it will be fair to presume we will have a relative quick primary white wave 4, because of the guideline of alternation. Also as a guideline we can lean to a Kennedy Channeling Technique, which states that wave 4 is usually not done before touching the bottom of the acceleration channel, which I have colored in blue.
The simplest path of wave 4 would be a zig-zag, which I have drawn in yellow. And I anticipate the first wave down, intermediate green A, not to end before around $90.000, then we will have a intermediate green B, then intermediate green C.
A choice could very well be that it will form as a triangle, because so many still believe the surge of BTC never stops. But still my anticipation of intermediate green wave A will be around the $90.000 level.
This is the most optimistic count I feel I could do on BTC. Another, but not as likely, count could be that we already have seen the wave 5, and then there is no absolute bottom other than 0.
Because this would mean we have seen the top of wave 1 of a higher degree, and wave 2 can retrace all the way back to the start of wave 1 without invalidating anything.
But this pessimistic count is not my preferred count at the moment.
BTC - Head and Shoulders PatternBTC chart appears to be playing out a pattern in spirit of a Head and Shoulders pattern, which typically signals a potential bearish reversal. Based on the recent double top observed on 14 August 2025, the percentage decline from that peak to the neckline of the pattern is approximately 17.14%. If this pattern plays out as expected, it suggests a further downside of around 17.14%, equating to roughly $19k, which would bring BTC’s price down to $90k-$91k.
This target level is supported by three key technical confluences:
- A multi-month ascending trendline connecting major pivot lows dating back to Aug 2024
- 61.8% Fibonacci retracement level, often considered a significant support zone
- A strong support zone on Daily timeframe
Given these factors, the probability of a continued decline appears high, and further downside pressure may be imminent.

Bitcoin (BTC): Back At Major Support Zone | Golden Buy Area?What a dip we have had, which led the price to a major support zone of $108K. Now we have approached a golden buy zone, which previous times has been working out well for us so we will maintain the similar game plan like we had all the previous times.
We look for some kind of smaller accumulation to happen inside this area; after that, we want to see proper market structure break and movement back to upper zones.
Swallow Academy

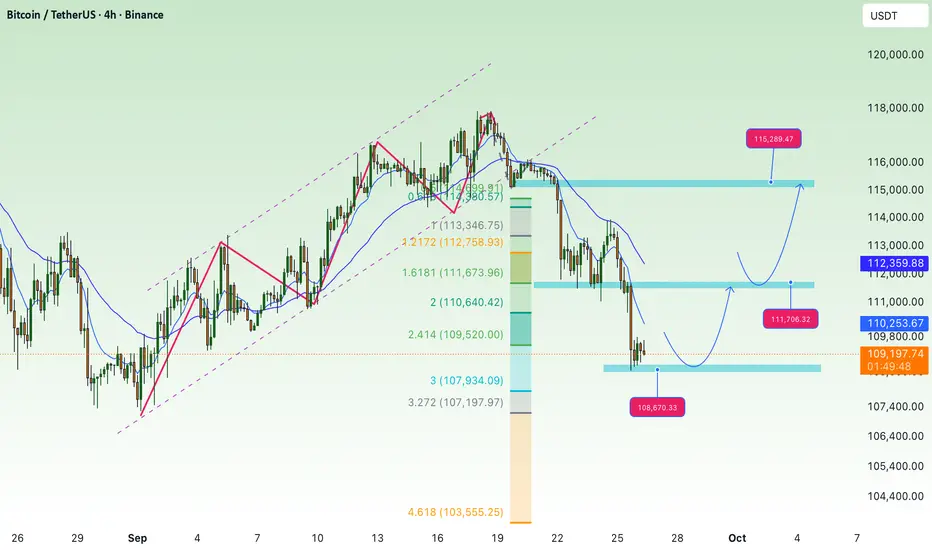
waiting for BTC to recover, accumulate above 107KBTC Technical Analysis (4H Chart):
After breaking down from the rising channel, BTC has confirmed a bearish structure, forming lower highs and lower lows.
Price recently bounced from the 108,800–109,000 support zone, which aligns with the 2.618 Fibonacci extension. This is a key short-term support area to watch.
If buyers can hold this support, BTC may retest the 111,600–111,700 resistance zone. A breakout above could open the path toward the higher resistance at 115,300–115,400.
On the downside, if the 109,000 zone fails, the next bearish targets lie at 105,900 and deeper Fibonacci projections around 104,200–103,100.
Trend Outlook:
Short-term: Possible recovery toward 111,600 or even 115,300 if demand holds above 109,000.
Medium-term: Still bearish-biased as long as price stays under the 200 EMA (~114,000).
Key Levels to Note:
Resistance: 111,600 – 111,700, 115,300 – 115,400
Support: 109,000, 105,900, 104,200 – 103,100
$BTC market update.CRYPTOCAP:BTC Market Update
CRYPTOCAP:BTC is currently ranging between $120K and $106K.
If you didn’t enter near the bottom of this range, be cautious—there’s still a strong chance of rejection since the 1W consolidation isn’t finished yet.
The recent liquidity grab was expected, and with the CME gap nearly filled, the market is now at a decision point.
What’s next?
We’re sitting in the middle of the range:
If rejected, we could revisit the bottom around $106K, which would offer a stronger entry for the next leg up.
If momentum continues, the next target is the top of the channel at $120K.
The rejection scenario looks more likely since this push wasn’t impulsive—it was news-driven and unfolded slowly over a week, suggesting market makers may be buying to trigger short liquidations.
Indicators:
RSI → Each time it overheats, a cooldown follows. A better entry may be lower since this move seems topped.
MACD → Still ranging, offering clear buy/sell zones.
Stochastic RSI → Pointing toward a cooldown, reinforcing the rejection case.
Bearish divergence → If it is forming now, it would validate this idea further. Keep and eye on it.
Always remember: DYOR (Do Your Own Research).

Bitcoin: What's Next?My Philosophy & Approach
My foundation is the pure chart. I don't consider news or outside opinions, as I see them as secondary. All primary information is already in the price. Of course, no one can give a 100% forecast. The crypto market can fall sharply just as it can rise sharply. This uncertainty must be accepted as the norm. This is why I work from risk, not from expectations.
General Market Sentiment & BINANCE:BTCUSDT.P Analysis
In my opinion, a bearish sentiment prevails in the market. After its drop, Bitcoin isn't having a deep correction but is re-testing the level where the decline stopped, which is a sign of seller pressure. Currently, the price is grinding the 111,959.5 level, but I don't see a strong reaction from buyers even on false breakouts. This indicates their weakness. Although the trading zone of Sept 3-10 creates an obstacle, I am still leaning towards a further decline.
Asset Selection Criteria in Current Conditions
After high volatility comes a dangerous time, so I am especially careful in selecting assets based on two criteria:
Strength Against the Market: Assets that are rising despite the general fall. This indicates the presence of a large buyer.
A Clear Stop: Assets that, after a sharp decline, stopped precisely at a level where large capital absorbed all sales.

Bitcoin Drops Below $108.6K — What’s Next?
Bitcoin was holding near $115K, but now it's fallen below the $108.6K level. The next support is around $105K. If that breaks, we could see further downside toward $100K.
To turn bullish again, Bitcoin needs to reclaim $112K as support. If that happens, it could retest $115K–$120K.
#PEACE

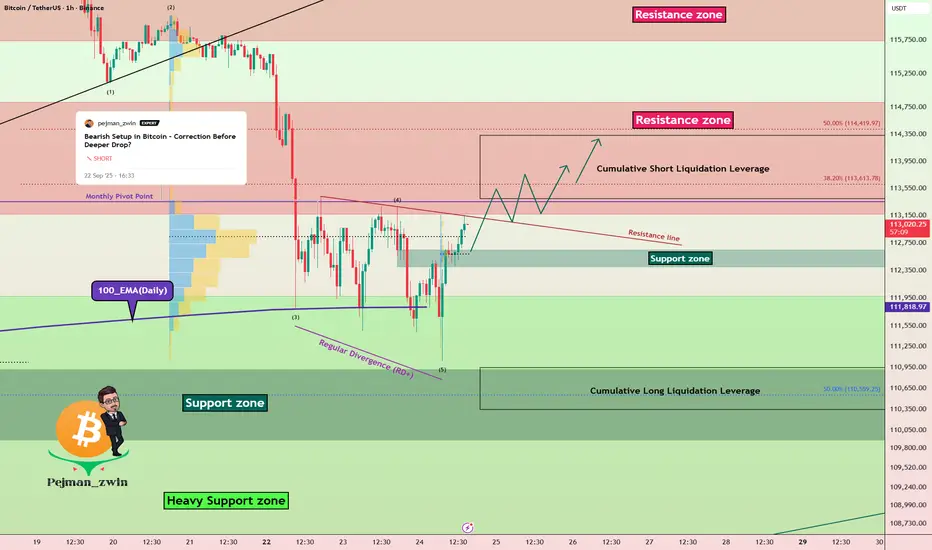
Bitcoin Outlook: From Support Bounce to Short Liquidation TargetBitcoin ( BINANCE:BTCUSDT ) moved as I expected in my previous idea ( Long and Short positions hit their targets ).
Bitcoin is currently moving near the Resistance zone($114,820-$113,170) , Resistance line, and the Monthly Pivot Point , and seems to have failed to break 100_EMA(Daily) .
In terms of Elliott Wave theory , Bitcoin completed wave 5 as I expected by attacking 100_EMA(Daily) and Heavy Support zone($112,000-$105,800) , and we can expect more bullish waves .
I expect Bitcoin to break the Resistance line in the coming hours and attack the Resistance zone ($114,820-$113,170) and the Cumulative Short Liquidation Leverage ($114,334-$113,400) .
Cumulative Long Liquidation Leverage: $110,950-$110,350
Note: If Bitcoin goes above $115,000, we should expect Bitcoin to rise again.
Please respect each other's ideas and express them politely if you agree or disagree.
Bitcoin Analysis (BTCUSDT), 1-hour time frame.
Be sure to follow the updated ideas.
Do not forget to put a Stop loss for your positions (For every position you want to open).
Please follow your strategy and updates; this is just my Idea, and I will gladly see your ideas in this post.
Please do not forget the ✅' like '✅ button 🙏😊 & Share it with your friends; thanks, and Trade safe.
#BITCOIN UPDATE!CRYPTOCAP:BTC is still moving inside the ascending channel.
Strong demand held at $108,200 (0.618 Fib), and price is now around $112,500 above key support at $111,300.
A push above $114,400–$118,300 could open the way toward $120K–$124K.
As long as BTC stays above $112K, trend bias remains bullish.
#Bitcoin
