BTCUSDT KEY SUPPORT ZONES FOR LONG ENTRIESThe chart shows significant support that could present buying opportunities, while resistance levels above indicate potential profit targets.
Trade ideas

EcoByG Bitcoin Daily Analysis #1 — Daily BTC Market UpdateWelcome to My Analysis.
Now, let’s break down today’s Bitcoin structure.
We can clearly see that Bitcoin has risen from the accumulation zone at 84K, moved up toward the 93K level, and is currently stuck there.
The 93K–96K area is the liquidity zone for sellers, which makes it a difficult region to break through.
To push past this level, Bitcoin either needs a whale-driven move, or we need to see stronger volume inflows.
From a broader perspective, the current range is between 84K and 94K. For a confirmed breakout and to say that the market structure has turned bullish.
we need Bitcoin to close several 4-hour candles above 96K.
On the other hand, if we want to consider a safe scenario for a move downward, then price must continue below 84K.
RSI shows us that when price reached 94K, momentum slowed down, indicating that BTC wants to take a breather. This is a reasonable area for consolidation before potentially continuing its movement in the upcoming sessions.
⚠️ Risk Alert ⚠️
Futures are not beginner-friendly. These triggers require solid experience.
Before using them, study risk management and practice with the learning content here.

BTCUSDT.P - December 3, 2025Bitcoin is attempting to reverse from a prior downtrend, trading above a short-term rising trendline and pushing into a key resistance band around 93,000–94,300. The chart highlights a bullish scenario targeting the 112,000 area if price can clear this resistance and hold above the stop zone near 97,800. A failure to break and sustain above resistance, coupled with a break below the trendline, would favor a corrective move back toward the 87,300 profit level marked on the chart. Momentum is improving but remains vulnerable around resistance, making this a pivotal area for trend confirmation.

BTCUSDT - Bearish ReversalBTCUSDT has formed a double top with divergence. Placing sell stop below neckline

Gann has the answers! (This is NOT market manipulation) As seen in the Gann tool, price action needs to reposition itself
It resisted at the first curve (Arc1) then moved into the support line (Fan line 1/1)
This is standard behavior, NOT market manipulation

Bitcoin 4H Update: Party's over... for now!Looks like BTC tried to break the top of its current channel (around $93.5k) but got firmly rejected by the :bear:
So, here’s the deal: Bitcoin needs to find its dancing shoes and make a big bounce from the immediate support line, which is hanging out around $92k. Let’s hope volume join the party.
If it can’t hold it, the next safety net is way down at the mid-range support around $89k

BITCOIN: A TALE OF EXHAUSTED BULLSmart money tends to accumulate heavily when sentiment is at extreme fear, signaling belief in a rebound. It is often correct, though not consistently.
Much of the pessimism appears to be fully priced in at this point. Thus, a bullish scenario remains technically possible, although broader conditions still align with a bear-market environment.
Let's see.

BITCOIN WILL HIT 80K !BTC can hit the seller at 100 - 104k and then crash to 80k again.
its not financial advice !

104k Moonshot or Brutal 96k Rejection? Bitcoin’s Final Bull TrapFriends, Bitcoin has played out exactly as outlined in my previous idea.
As I mentioned last time, that drop could have either been:
1. The start of a deeper bearish continuation after a minor correction, or
2. Wave B of a larger ABC correction — in which case BTC had to reclaim above 93k.
The chart has confirmed the second option — it was wave B.
Therefore, we are now building wave C upwards, and Bitcoin has already broken above 93k.
On the current chart I still have two active scenarios:
🟠 Orange arrow scenario:
A quick push toward ~96k followed by a reversal and drop back to the recent lows.
In this case, the entire three-wave move we’ve seen so far could become wave A of a larger corrective structure.
🟢 Green arrow scenario (my preferred one for now):
Continuation higher to the 102–104k zone, completing wave C of this correction, and only AFTER that we finally update the recent lows.
My ultimate downside target remains 60k and below, but first let’s see which path Bitcoin chooses in the coming days.
Which scenario do you think will play out — orange or green?
Drop your thoughts in the comments! 👇
Like, comment, follow if you find this helpful — really appreciate your feedback and reactions! 🚀

#BTC/USDT is currently strongly bullish#BTC
The price is moving in a descending channel on the 1-hour timeframe. It has reached the lower boundary and is heading towards breaking above it, with a retest of the upper boundary expected.
We have a downtrend on the RSI indicator, which has reached near the lower boundary, and an upward rebound is expected.
There is a key support zone in green at 92500. The price has bounced from this level multiple times and is expected to bounce again.
We have a trend towards consolidation above the 100-period moving average, as we are moving close to it, which supports the upward movement.
Entry price: 92990
First target: 93204
Second target: 93750
Third target: 94406
Don't forget a simple principle: money management.
Place your stop-loss below the support zone in green.
For any questions, please leave a comment.
Thank you.

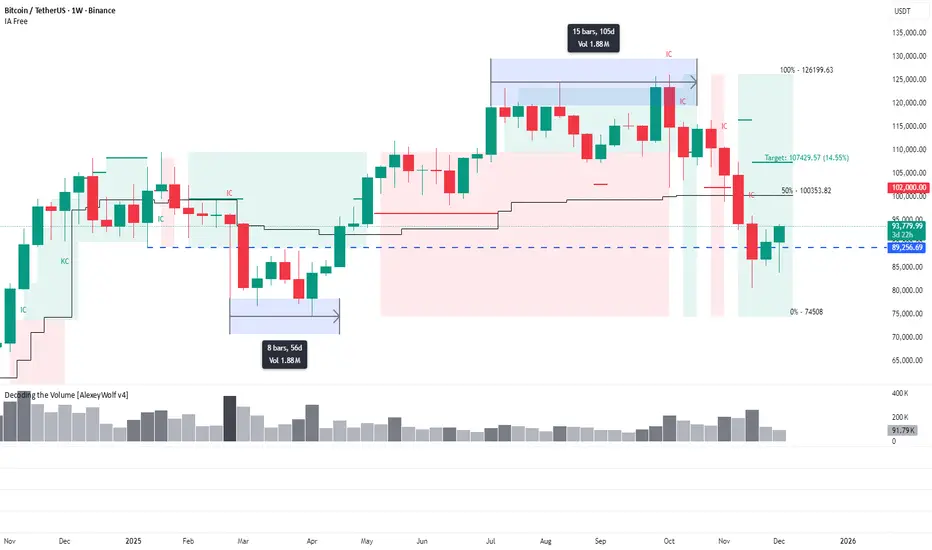
Volumes give clues: What the weekly range structure is showingThis analysis is based on the Initiative Analysis (IA) method.
Hello traders and investors!
On the weekly timeframe, Bitcoin remains in a sideways range. Notice how interestingly the price moved through its boundaries.
First, the lower boundary of the range at 89,256 was broken — and this is where a 1.88M volume was accumulated over 8 weeks .
Later, the price broke the upper boundary of the range, and the same 1.88M volume was distributed, but this time over just 15 days .
This indicates that there were far fewer buyers willing to buy at higher prices — the market needed almost twice as much time to distribute an identical volume.
Now the price has returned to the very zone where the first major volume was accumulated.
For more details about the 86,000–79,500 zone, see the related post.
Wishing you profitable trades!
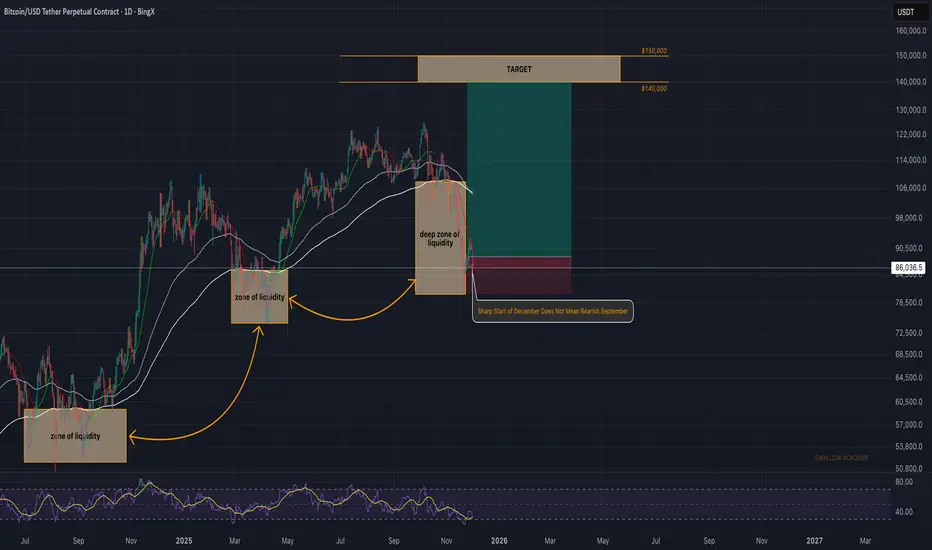
Bitcoin (BTC): Sharp Start of Dec Does Not Mean Bearish DecBitcoin had a rough start to the month but this does not change a thing for now. EMAs are still far away from the market price and we are looking for the price to recover in a matter of a week or two.
As long as buyers hold the ground around 80K, this is our game plan: long until EMAs ($105K) and then look for a breakout.
Swallow Academy
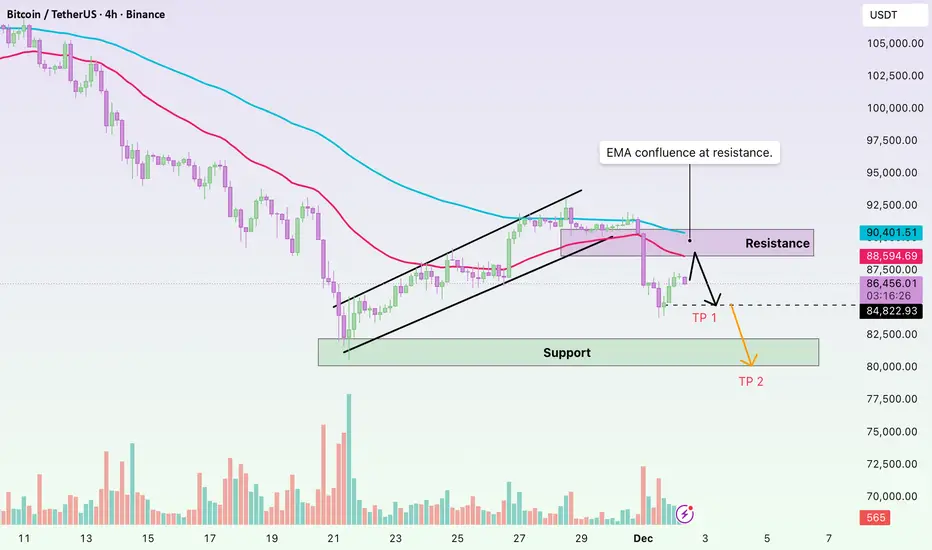
A Pullback Cannot Hide a Weakening TrendHello everyone, it’s Domic here ✌️
Looking at Bitcoin’s recent price action, you can probably feel that the latest drop wasn’t a random fall. The market completely broke through a multi-day equilibrium zone, and the moment BTC was repeatedly rejected at the EMA 89 and then lost the EMA 34, the balance of power shifted clearly toward the sellers.
Interestingly, right after that sharp breakdown, BTC bounced into a short-term pullback. This doesn’t signal a trend reversal; it’s simply the market’s natural reaction after falling too quickly: profit-taking from sellers, short-covering, and weak dip-buying flows creating a technical rebound — enough to rebalance the market, but not enough to change direction.
From a macro perspective, the signals are fairly aligned: US bond yields have risen again, the DXY has bounced from the 99 area, ETF inflows have weakened, and defensive sentiment ahead of upcoming US labour data has caused demand to dry up almost entirely. Crypto is simply being dragged along with the broader risk-off environment.
From a technical angle, BTC is trading below both the EMA 34 and EMA 89 — two downward-sloping moving averages indicating the trend remains bearish. The 4H breakdown accompanied by strong volume shows this is a real sell-off. BTC is currently pulling back to retest the resistance levels: 88,700–89,000 at the EMA 34 and 90,400–90,600 at the EMA 89. These zones will reveal whether selling pressure still dominates.
If sellers return aggressively, BTC may continue heading toward lower support regions: 85,500–86,000 is the first key area, followed by 83,000–84,000 — a demand zone that previously generated a strong bullish reaction. With the current momentum, the scenario where BTC at least touches the 85,500–86,000 support is becoming increasingly likely.
Which direction do you think the market is leaning toward? Feel free to share your perspective — and wishing everyone successful trading!
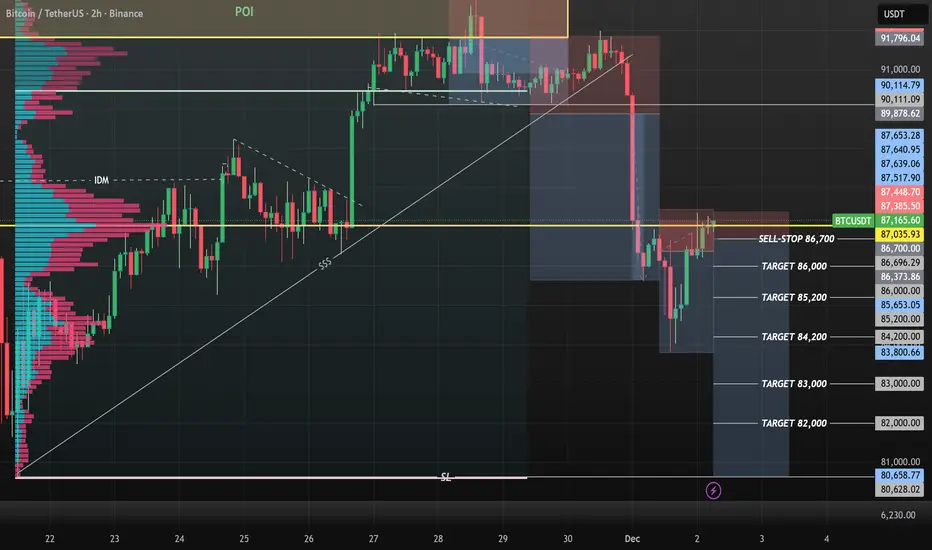
BTCUSD SELL WITH SELL-STOP ORDER!!!BTCUSD completed +2,000pips from my yesterdays analysis and predictions today we have price still ranging at my POC point level am looking forward to sell from 86,700 area using min confirmations under my POC key level to sell from there to 80k.....
DeGRAM | BTCUSD will test the $80k level📊 Technical Analysis
● BTC is retesting the multi-month support zone near 80K, aligning with the long-term ascending base and the lower boundary of the falling trend, creating conditions for a medium-term rebound.
● A break above the descending resistance line could trigger recovery toward 92K as the structure shows exhaustion of bearish momentum.
💡 Fundamental Analysis
● Recent ETF inflows and easing macro pressure from U.S. yields support accumulation near major support zones.
✨ Summary
● Bullish bias from 80K support. Targets: 88K → 92K. Key support: 80K.
-------------------
Share your opinion in the comments and support the idea with a like. Thanks for your support!

The $91k Liquidity Re-Fueling Scenario Before $95kKey Level: $90,000 - $91,000
Significance: This area acts as a major psychological and structural wall. We anticipate significant selling pressure and liquidity pools here (Supply Zone).
The Bullish Requirement: For the move to $95k, the price must reach this area and then Consolidate (settle). A successful Flip to Support is confirmed by closing candles decisively above $91,000. This 're-fueling' provides the necessary market energy.
2. The Next Milestone
Ultimate Target: $95,000
Execution Condition: If the $91,000 level is successfully flipped and held as support with conviction and volume, the next major technical and psychological target for this short-term run is $95,000.

Bitcoin Comes Back to Life! Buyers Return With Full PowerIf I had to name a “warrior rising from the storm” , it would be BTCUSDT right now. After plunging to the 84k region, Bitcoin has just staged an almost 7% rebound back toward 93k, accompanied by news that big money from Wall Street is flowing back into crypto and overall fear in the market is calming down. The USD is no longer overly strong, and Bitcoin is once again being mentioned as a key gauge of market risk appetite .
Looking at the 12H chart, BTC has broken back above the bottom of the long-term descending channel and is now pushing into the Ichimoku cloud. This rebound isn’t a “spike and die” pattern — it’s a sequence of steady bullish candles with shallow pullbacks , showing that buyers are firmly in control. The scenario is becoming clearer: price may pull back to around 90,500 to gather liquidity and retest the cloud edge, before potentially bouncing toward the higher resistance region around 107,300 — the next equilibrium zone of the trend.
With the supportive news flow (institutional money re-entering, market accepting a new price base after the drop) and a technical structure showing BTC has temporarily escaped the free-fall phase , I remain biased toward buy-the-dip setups . The plan is to wait for short pullbacks for entries rather than trying to sell against a recovering bullish wave that’s clearly being “revived”.


Bitcoin (BTC) Update, is price at resistance ?Bitcoin reversed sharply into the point of control and is now consolidating under the channel-high resistance that has held for several days. This suggests buyers are losing momentum.
As long as BTC stays below this resistance, the market remains vulnerable to filling the lower inefficiency and rotating back toward the 78,000 support.
Key Points:
- Consolidation under channel-high resistance
- Short-squeeze rise filled lower inefficiencies
- Single-print region below remains vulnerable
What to Expect:
A clean reclaim of resistance is needed for upside. Failure opens the door to deeper corrective moves toward 78,000.

Btc going 190000very soonI come back with another idea
So we have btc short in last time
Now we going to long
With some tips
1.we buy in 80000
2.if btc going lower we buy second time in 60000
And our sl is 50000
Tps is in the image
So let's do it again guys
This time with long
Ty my followers

BTC/USDT — Weekly Outlook✔️ The monthly candle closed bearish with a lower wick. RSI has dropped into deep-correction territory (5 more points — and it hits the COVID-crash level). The structure increasingly resembles 2021.
✔️ Bitcoin recovered 4% during the week — but already lost 5% this morning.
🟢 QT officially ended today after 3.5 years . During this period, the Fed’s balance sheet shrank from $9T to $6.6T.
🟢 Positive cumulative delta: +$640M
🟠 Deviation below the channel has been closed — technically opening the path downward.
🟠 ETF flows: green on the week, red on the month.
🟠 Fear index moved from extreme fear back to regular fear — likely not for long.
🔴 Nearly the entire bounce has been retraced. A reversal is possible only after a clear reversal pattern forms. One step back before two steps forward.
🔴 The shortest bear phase in history lasted 1.5 months — that’s the most optimistic benchmark.
🧠 If the scenario plays out, we may see one more drop and a strong buyback within the next month.
A sweep below 80k is possible.
I expect a reversal starting from early January — holiday periods make market manipulation even easier.

BTCUSDT: Bullish Push to 98500?BINANCE:BTCUSDT is eyeing a bullish reversal on the 4-hour chart , with price rebounding from a broken level near cumulative long liquidation, converging with a potential entry zone that could trigger upside momentum if buyers defend against further dips. This setup suggests a recovery opportunity after recent pullback, targeting higher resistance levels with excellent risk-reward.🔥
Entry between 87500–88500 for a long position (entry at current levels with proper risk management is recommended). Targets at 95000 (first), 98500 (second). Set a stop loss at a close below 85000 , yielding a risk-reward ratio up to 1:3 overall. Monitor for confirmation via a bullish candle close above entry with rising volume, leveraging Bitcoin's resilience post-correction.🌟
Fundamentally , Bitcoin is consolidating around $89,000 in late November 2025 after a sharp retreat from its all-time high of $126,000, driven by fading momentum and institutional caution amid a 15%(from top) October decline contrary to historical patterns. Despite dipping below $85,000 recently (trough at ~$80,553), fundamentals remain strong with institutional investors holding steady, reduced Fed rate cut expectations supporting USD strength, and long-term forecasts eyeing upside to $240,000 driven by macro asset behavior and cycle highs. Bitcoin correlates with the S&P 500 , and recently we've seen growth in the S&P 500. 💡
📝 Trade Setup
🎯 Entry (Long):
87,500 – 88,500
(Entry at current levels with proper risk management is also valid)
🎯 Targets:
• 95,000 (first)
• 98,500 (second)
❌ Stop Loss:
• 4H close below 85,000
⚖️ Risk-to-Reward:
• Up to 1:3 on full run
👇 Share your thoughts below! 👇

December BTC overviewBTC closed November sweeping and reclaiming the weekly 100 EMA, and although the daily chart printed a strong reversal candle, it is still too early to call a bottom.
The broader bearish structure on both the weekly and daily remains intact, and volume aligns with the downtrend. On the daily, we also have the 100 and 200 EMA bearish crossover, which confirms a strong HTF bearish trend.
In bearish markets, it is uncommon to leave an FVG unfilled unless the trend is very strong. Even though November closed above the 100 EMA, it was still a heavy bearish close that broke the monthly bullish trendline.
If we hit 100K, it would imply a 20K rally after a 40K drop with no real consolidation or accumulation. That would be wild. It is possible but very unlikely. This currently looks like the unwind of a multi-day distribution that likely started in July. The market needs a proper multi-day accumulation.
We also need to consider that we are fading the high return season, which adds more weight to the distribution thesis.
My expectation for December is range-bound price action and a close near the yearly open.
On low timeframes, there is a clean short opportunity at the bearish order block around 95K to 97K, sitting above yearly-open liquidity.
If price returns to the lows, we also have a potential monthly double-bottom setup targeting the yearly open.
There is a daily bullish MSB waiting at 97K. If price reaches it, we may start holding above the yearly open and squeeze toward the daily 200 EMA. From there, the monthly and weekly trendline could act as resistance and push price back to the lows, which is a common retest pattern after a strong trendline break.
