#bTC#BTCUSDT support (green) and resistance (red) areas and dynamic resistances (red) are indicated for investing or trading in cryptocurrencies.
#CRYPTO
#BTC
Trade ideas

BitcoinHello friends,
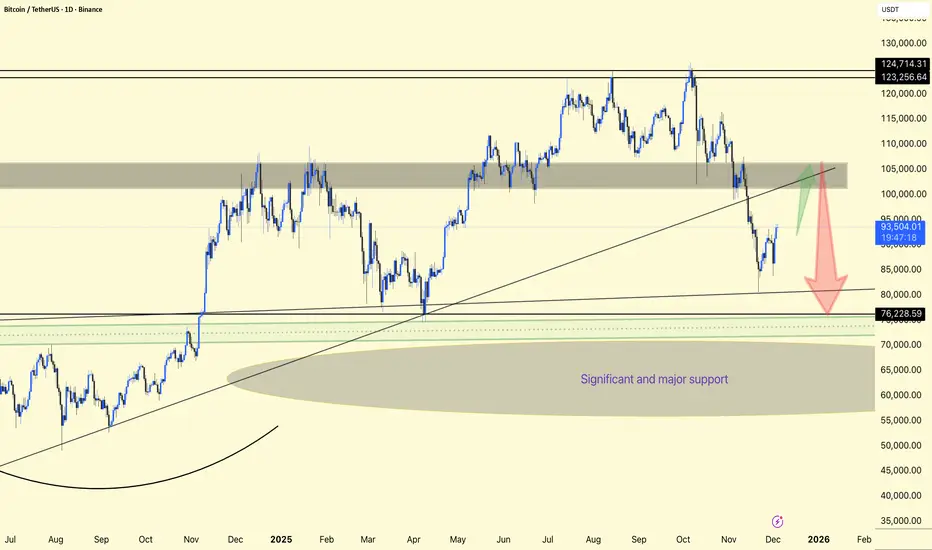
this is only a daily-timeframe analysis that has been decided based on reviewing the 4-hour timeframe. Please pay attention. Bitcoin has formed two major blocks in its downtrend, and there is a possibility of returning to those blocks. However, the major correction has been definitively confirmed, and I am only looking for a suitable short-position opportunity so that I can enter another unique long position in the future. In my daily analysis, there are two suitable blocks for selling; clear signs of a decline must be observed, after which you should enter the position. The analysis is very clear and does not require further explanation.
Thank you for your support, dear friends!
Wishing you all the success!
Fereydoon Bahrami
A retail trader in the Wall Street trading Center (Forex)
Risk Disclosure:
Trading in the crypto market is risky due to high price changes. This analysis is just one person's opinion and shouldn't be taken as financial advice. Before investing, it's best to talk to a financial advisor and do your own research. You are responsible for any profits or losses from this analysis

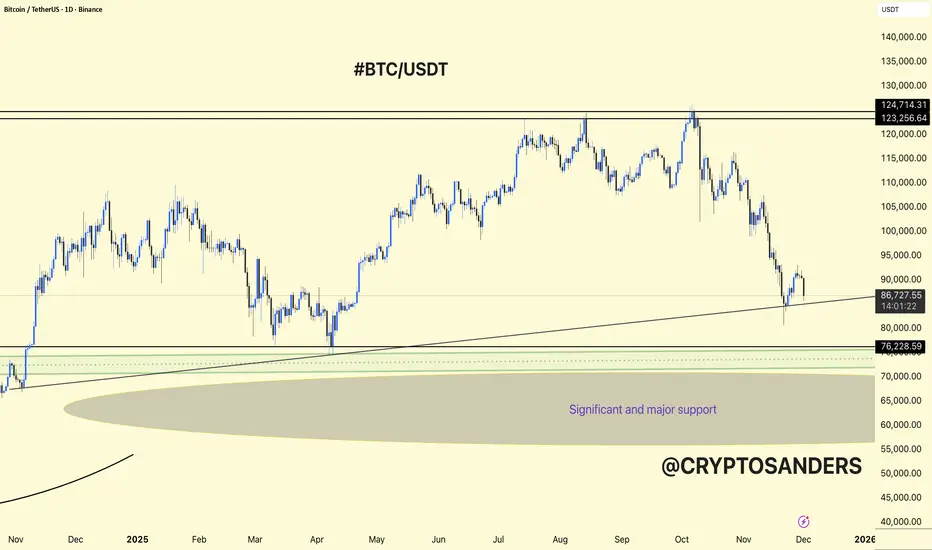
BTCUSDT WEEKLY CHART UPDATE !!(BTCUSDT) The weekly structure remains bullish overall, but is currently in a corrective leg back into a key higher-timeframe demand zone.
Confluence of the long‑term ascending trendline and horizontal zone around 80,000–82,000, just under the current price; a deeper buffer of 76,000 marks the top of the “significant and major support” area highlighted on your chart.
The previous distribution band at 123,000–125,000 remains the main upside target and weekly resistance; any new impulse leg will likely aim back into this zone first.
The rounded basing structures since 2022, plus the current pullback, suggest a large continuation pattern rather than a full trend reversal, as long as weekly candles keep closing above the 76k support shelf.
80k–76k holds and forms a clear higher low; the weekly chart favors a renewed push toward six-figure territory and a potential retest of the 123k–125k highs. A decisive weekly close below 76k would invalidate this and open risk toward the mid-60k demand block inside the grey zone.
DYOR | NFA

Correction CompleteBTC should now hit our targets of 65.9k next
Other noteable supports are 59k and 57.1k
and finally, 48.2k (but I don't think this will happen for a few months)

BTC$150K remains in play for $BTC. The inverse head and shoulders is still holding its structure, momentum is stabilizing, and the pattern remains valid. As long as the neckline holds, this setup has a high probability of playing out.

Bitcoin Next Target: $96,800 (1H Analysis)My model signals an upside move toward $96.8K on the 1H chart.
For free Bitcoin alerts and accurate price updates, hit Follow.

Bitcoin consolidation bearish momentumBitcoin continued its consolidation within bearish trend lower price multiple times and decline and price controlled down move i expect deliver bearish trend from the current situation see the bitcoin structure.
Technically Prices fell more than 6% during overnight trading and were quoted just above the 85,000 level early Monday morning on the U.S. East Coast.
Bitcoin has maintained a bearish structure since May, when price action briefly tested resistance near 89,000 before turning lower again. Downside pressure remains as long as price stays below that resistance zone, with key support levels expected around 83,000 to 80,000.
You may find more details in the chart,
Trade wisely best of luck buddies.
Ps; Support with like and comments for better analysis thanks for supporting.

Bitcoin's future scenario in the 4-hour timeframeBitcoin's future scenario in the 4-hour timeframe.
Despite the economic and war developments between the United States and Venezuela, and renewed threats between Israel and Iran, the situation in financial markets will remain uncertain, at least until after the Christmas holidays.

BTC Sell SetupBTC has swept the HTF 4H liquidity, i.e it has taken out the highs. ON 15 mint it has given a minor CHOCH indicating the reversal. ON 1H there is a clear RSI divergence as well, indicating this is just a extension move to grab liquidity. We are targeting 3:1 on the down side.

BTC/USDT 1DAY CHART ANALYSIS. Bitcoin (BTCUSDT) is in a corrective phase within a larger bullish structure, currently bouncing off support and heading back towards a large supply zone around 102,000–106,000 USDT.
The price was previously rejected from the top resistance band of 123,000–125,000 and sold off sharply, breaking mid-range support and retesting the long-term rising trendline and horizontal support around 80,000–82,000 as a key demand area.
The chart highlights a large “critical and key support” zone from around the mid-60,000s to the low-80,000s, where multiple higher-timeframe supports and rounded bases converge, making this a key zone.
After marking support, BTC has begun a relief rally towards the broken trendline and gray resistance band near 100,000–105,000; this area could serve as a decision point where either a downward continuation or a resumption of the trend is likely.
Bull Case: A strong daily close above the gray zone and reclaimed trendline would signal continuation towards 115,000 and potentially a retest of the 123,000–125,000 highs.
Bear Case: A break below 90,000 following rejection from this resistance will likely trigger another leg down towards 80,000–82,000 and, if that fails, another deep sweep into the “Significant and Major Support” region around 60,000 before a larger accumulation base can form.
DYOR | NFA
BTC/USDT 1DAY CHART UPDATE. BTCUSDT is in a corrective phase on the 1D chart, but it is still sitting above a major higher-timeframe support zone.
The chart shows a long-term ascending trendline from late 2024 to early 2025 that currently intersects just below the price, acting as dynamic support together with the horizontal 80k–82k area.
Below that, the wider “significant and major support” region lies roughly between 70k and 65k, which is the last strong demand block if 80k breaks.
Bullish case: Holding above the trendline and 80k–82k could form a higher low; from there BTCUSDT can attempt a recovery toward 95k–100k and eventually back to the 120k+ resistance, but it needs clear higher highs and higher lows on the daily to confirm.
Bearish case: A clean daily close below the trendline and 80k support opens room for a deeper flush into the 70k–65k major support zone, where a larger accumulation base may form before any new up‑leg.
DYOR | NFA
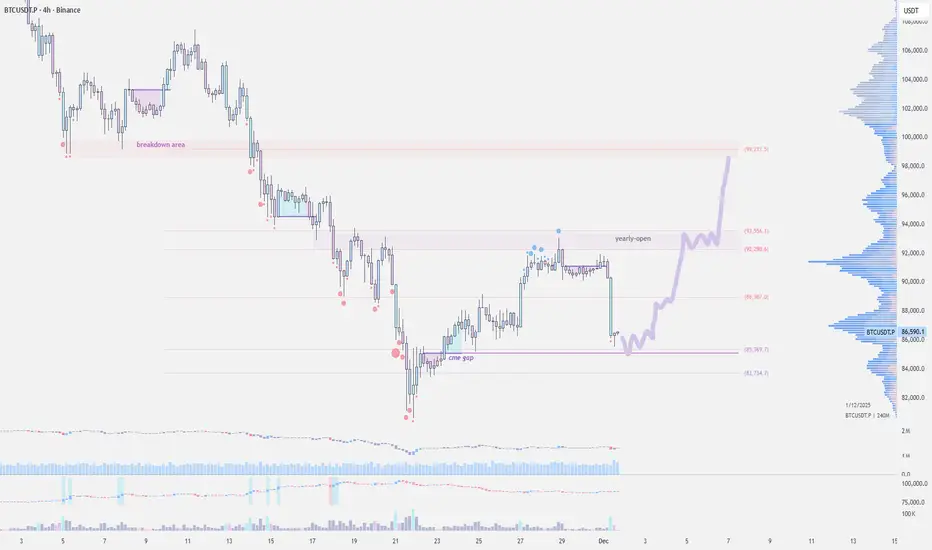
Bitcoin Kicks Off December in the RedCRYPTOCAP:BTC opened the month in red, a strong sell-off slammed BTC from $91.5k to $85k in just three hours.
Bitcoin's recent strength was largely driven by hopes of a December Fed cut, but this move looks more like the market finally cooling off after running overheated for weeks.
Now price is trying to stabilize around the $86k support near the CME gap. There are early signs of a bounce, and if buyers defend the 84–86k zone, a move back toward the 94–95k breakdown area is possible. If that support gives way, expect another dip or continued consolidation.
Bitcoin predictionmy thoughts on Bitcoin, im on the fence about where price is heading to but I wouldnt be surprised if its heads lower.

BITCOIN MAPPING FOR BEAR MARKETIn this video I will try to map the potential for Bitcoin if we consider the current condition is bear market

BTC: Continue to Wait for an UptrendWe have been continuously signaling to go long on BTC, and all long orders placed below the 90K level have now started to generate profits. Next, we will continue to wait for a breakthrough above the 96K level to capture more profits.
I send out accurate signals every day to help you gain more profits. Don’t miss out!

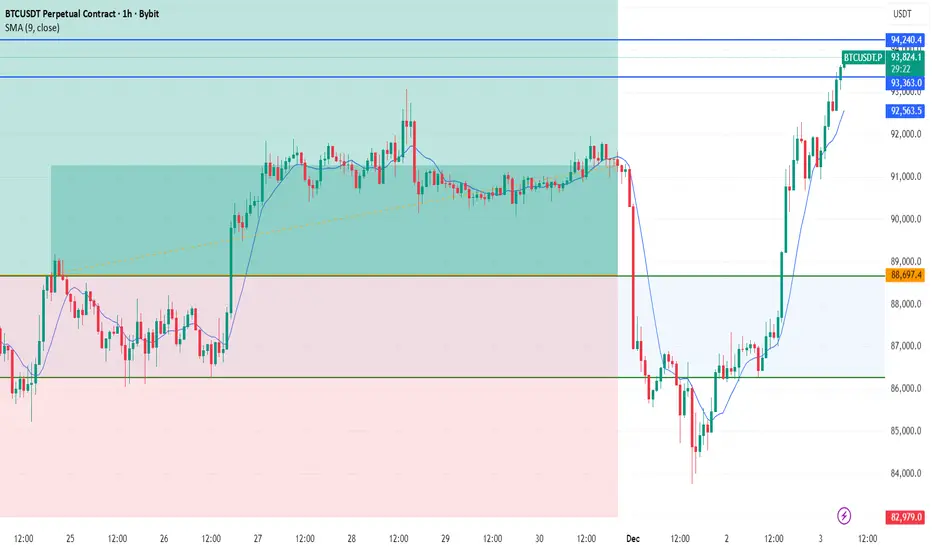
Bitcoin Analysis | Key Decision-Making Moments!
Hello to all my dear traders! Hope you're doing great.
Let’s jump into our beloved Bitcoin!
Before anything else, I really hope you pay attention to the points I repeat in almost all of my analyses:
Risk management and daily monitoring are the keys to winning.
Don’t ignore Bitcoin Dominance.
Write down your trades and review them.
Trade in the direction of the trend. And if the market—like now—doesn’t have a clear trend, taking too many trades doesn’t make much sense. If you do trade, keep the risk low.
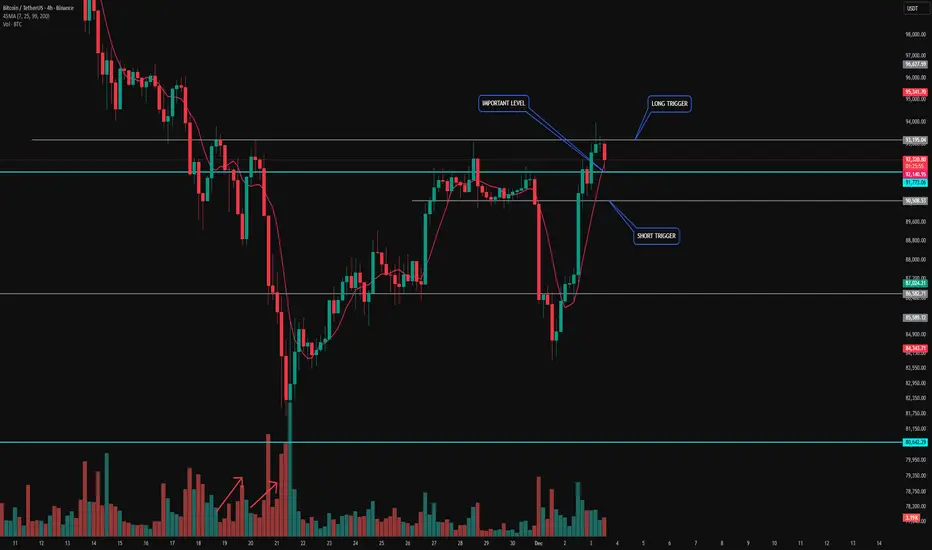
Bullish Scenario »
As expected, we got a reaction from the top zone on the 1H timeframe. I mentioned you could open a position based on BTC dominance—for example, if you had taken BCHUSDT, you could have already hit a 2R setup.
But what’s the situation now?
The market has built a nice structure, and we’re just waiting for a long trigger.
📌 My long trigger:
A breakout above 93,195.
If you see rising volume, you can even take the trigger earlier.
📌 What does rising volume mean?
I look for step-by-step / ladder-type volume increases. I’ve shown an example of this structure on the chart—if you see something similar, a long position becomes logical.
After the break of 93,195, I personally will be looking for longs—but I will definitely secure partial profits along the way.
Range Scenario »
If the price falls back below 91,733, the market likely wants to form a multi-week range between roughly 95,000 (top) and 80,000 (bottom).
If that happens, I’ll tell you the timeframe where you can open positions with a tight stop-loss and fast take-profits.
For now, we should NOT see a 4H candle closing below 91,733, because in my opinion that would kill the current momentum.
Bearish Scenario »
Very simple:
📌 90,500 is the short trigger.
Just pay attention to Bitcoin Dominance, and place your stop-loss above the 15-minute structure high.
Make sure you secure profits quickly.
If we get one more strong drop, it confirms that we’re likely entering a weekly range, which will help avoid high-risk situations.
Final Words »
As I told you in previous analyses, this is the first bullish move after a sharp drop, so watch the buyers carefully.
Wherever they show weakness, we can take positions against them, but only with confirmation—and our confirmations are automatically provided once our triggers activate.
Stay safe, stay healthy, and trade smart.
Wish you all the success! 🚀💚
#BTC Retests Resistance Zone📊#BTC Retests Resistance Zone⚠️
🧠As expected, the market found support near the short-term support level of 85358 and rebounded well. Currently, the price has retested the blue resistance zone. We should be wary of a potential pullback, so chasing the price higher here is not recommended. Instead, look for opportunities to short.
⚠️Note that if we successfully break through the blue resistance zone, we need to be cautious of a further surge.
🤜If you like my analysis, please like 💖 and share 💬
BITGET:BTCUSDT.P


Bitcoin Eyes Technical Pullback Before Next Upward MoveHello everyone,
Bitcoin is pausing after a rebound from the 86,000 USD area, but upward momentum faces resistance around 92,000 USD—where a red FVG, old supply zones, and heavy volume converge. Every approach to this area triggers downward pressure, producing red candles near supply zones, showing that selling pressure remains significant.
Nonetheless, the macro backdrop supports buyers: a weaker USD, declining US bond yields, and expectations of Fed rate cuts in 2025–2026 help Bitcoin hold higher levels. ETF inflows are returning, institutions are buying on dips, while the broader market remains neutral without FOMO.
Technically, lower FVGs at 89,500–90,000, 88,000–88,500, and 86,500–87,000 USD provide reasonable retracement areas before the next breakout. The structure has yet to form a new high, upward momentum is weak, and selling pressure has slightly recovered; this technical correction is an opportunity for the market to gather liquidity.
Forecast: BTC may retrace to 89,500 USD, and if selling remains strong, it could test 88,000–88,500 USD. Subsequently, buying pressure should return, pushing BTC back toward the 92,000–93,000 USD resistance, continuing the long-term uptrend.

BTCUSDTWe have a big downtrend.
By breakout from support and resistance we will have continued trend to next target.
Breakout 82k ready to 70k.
Breakout 93k ready to 100k and 115k.
CRYPTOCAP:BTC BITSTAMP:BTCUSD BINANCE:BTCUSDT

#BTC/USDT is currently strongly bullish#BTC
The price is moving in a descending channel on the 1-hour timeframe. It has reached the lower boundary and is heading towards breaking above it, with a retest of the upper boundary expected.
We have a downtrend on the RSI indicator, which has reached near the lower boundary, and an upward rebound is expected.
There is a key support zone in green at 85249. The price has bounced from this zone multiple times and is expected to bounce again.
We have a trend towards stability above the 100-period moving average, as we are moving close to it, which supports the upward movement.
Entry price: 86624
First target: 87386
Second target: 88635
Third target: 90106
Don't forget a simple principle: money management.
Place your stop-loss below the support zone in green.
For any questions, please leave a comment.
Thank you.

BitcoinBitcoin has surpassed the $87,500 mark and has also broken through the key level of $90,000. As noted, the Inverse Head and Shoulders (IH&S) pattern has acted as a reversal signal. The market currently appears strong, as the price increase is supported by healthy trading volume. The next significant resistance level to watch for is $95,000, and it will be interesting to see how the price behaves at that point.
BTCUSD TO 100K!!!!!!BTCUSD made a breakouts off my internal structure highs yesterday without any valid pull back to the breaker block after my inducement am taking a long buy entry at 92k holding till price sweep liquidity at 100k which will be my next sell zone order
