Trade ideas

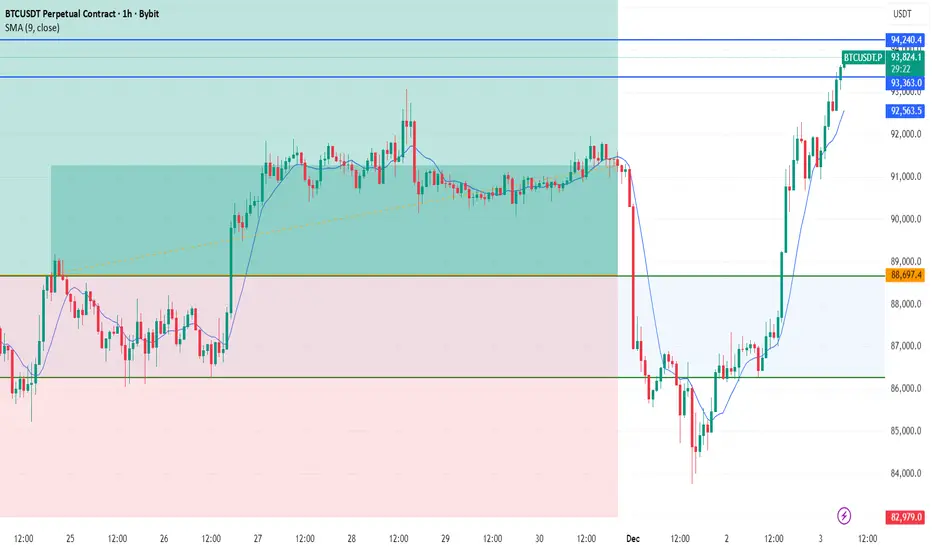
The $91k Liquidity Re-Fueling Scenario Before $95kKey Level: $90,000 - $91,000
Significance: This area acts as a major psychological and structural wall. We anticipate significant selling pressure and liquidity pools here (Supply Zone).
The Bullish Requirement: For the move to $95k, the price must reach this area and then Consolidate (settle). A successful Flip to Support is confirmed by closing candles decisively above $91,000. This 're-fueling' provides the necessary market energy.
2. The Next Milestone
Ultimate Target: $95,000
Execution Condition: If the $91,000 level is successfully flipped and held as support with conviction and volume, the next major technical and psychological target for this short-term run is $95,000.

BTCUSDTWe have a big downtrend.
By breakout from support and resistance we will have continued trend to next target.
Breakout 82k ready to 70k.
Breakout 93k ready to 100k and 115k.
CRYPTOCAP:BTC BITSTAMP:BTCUSD BINANCE:BTCUSDT

#BTC/USDT is currently strongly bullish#BTC
The price is moving in a descending channel on the 1-hour timeframe. It has reached the lower boundary and is heading towards breaking above it, with a retest of the upper boundary expected.
We have a downtrend on the RSI indicator, which has reached near the lower boundary, and an upward rebound is expected.
There is a key support zone in green at 85249. The price has bounced from this zone multiple times and is expected to bounce again.
We have a trend towards stability above the 100-period moving average, as we are moving close to it, which supports the upward movement.
Entry price: 86624
First target: 87386
Second target: 88635
Third target: 90106
Don't forget a simple principle: money management.
Place your stop-loss below the support zone in green.
For any questions, please leave a comment.
Thank you.

BitcoinBitcoin has surpassed the $87,500 mark and has also broken through the key level of $90,000. As noted, the Inverse Head and Shoulders (IH&S) pattern has acted as a reversal signal. The market currently appears strong, as the price increase is supported by healthy trading volume. The next significant resistance level to watch for is $95,000, and it will be interesting to see how the price behaves at that point.
BTCUSD TO 100K!!!!!!BTCUSD made a breakouts off my internal structure highs yesterday without any valid pull back to the breaker block after my inducement am taking a long buy entry at 92k holding till price sweep liquidity at 100k which will be my next sell zone order

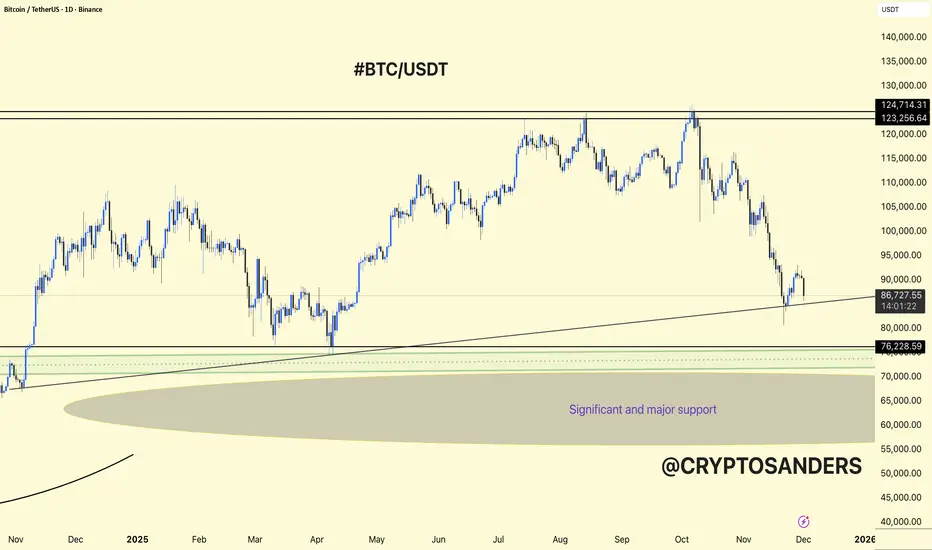
BTC/USDT 1DAY CHART UPDATE. BTCUSDT is in a corrective phase on the 1D chart, but it is still sitting above a major higher-timeframe support zone.
The chart shows a long-term ascending trendline from late 2024 to early 2025 that currently intersects just below the price, acting as dynamic support together with the horizontal 80k–82k area.
Below that, the wider “significant and major support” region lies roughly between 70k and 65k, which is the last strong demand block if 80k breaks.
Bullish case: Holding above the trendline and 80k–82k could form a higher low; from there BTCUSDT can attempt a recovery toward 95k–100k and eventually back to the 120k+ resistance, but it needs clear higher highs and higher lows on the daily to confirm.
Bearish case: A clean daily close below the trendline and 80k support opens room for a deeper flush into the 70k–65k major support zone, where a larger accumulation base may form before any new up‑leg.
DYOR | NFA
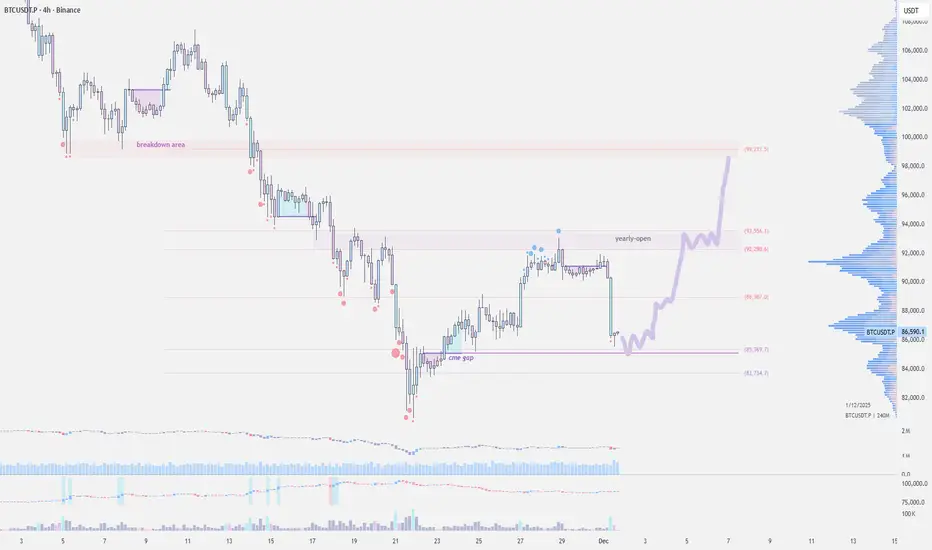
Bitcoin Kicks Off December in the RedCRYPTOCAP:BTC opened the month in red, a strong sell-off slammed BTC from $91.5k to $85k in just three hours.
Bitcoin's recent strength was largely driven by hopes of a December Fed cut, but this move looks more like the market finally cooling off after running overheated for weeks.
Now price is trying to stabilize around the $86k support near the CME gap. There are early signs of a bounce, and if buyers defend the 84–86k zone, a move back toward the 94–95k breakdown area is possible. If that support gives way, expect another dip or continued consolidation.
BITCOIN MAPPING FOR BEAR MARKETIn this video I will try to map the potential for Bitcoin if we consider the current condition is bear market

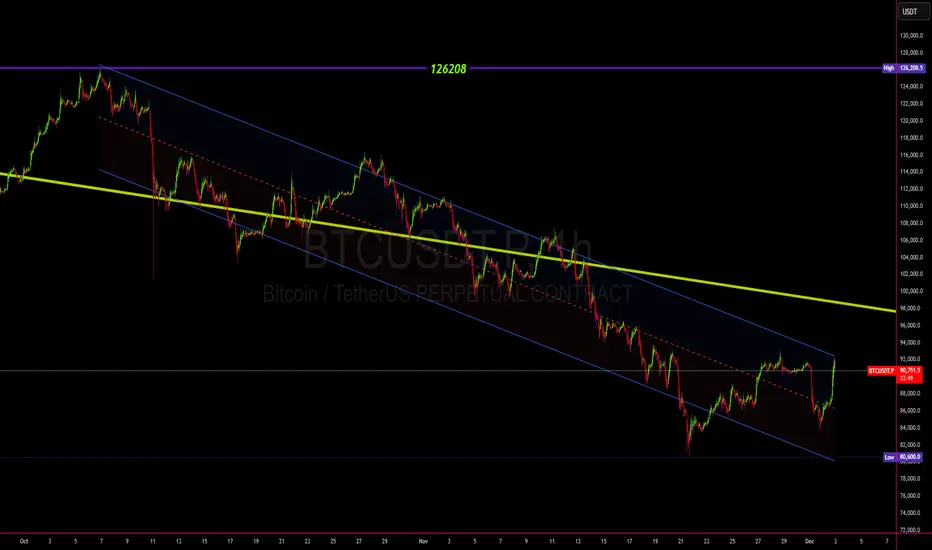
BTCUSDT – Regression Channel Breakout Before the Next Drop🟣 BTCUSDT – Regression Channel Breakout Before the Next Drop
Since October 6th, Bitcoin has been moving inside a downward regression channel.
Recently, the price touched the upper boundary of the channel, signaling a possible end of the current correction phase.
📈 A short-term bounce toward the $94,000 level is still possible,
but afterwards, Bitcoin is likely to start its next bearish wave targeting the $75,000 zone.
🔸 Key Resistance: $94,000
🔹 Key Target Zone: $75,000
Mid-term trend remains bearish as BTC prepares for another downward leg.
📘 What is a Regression Channel and Why It Matters?
A regression channel is a powerful analytical tool that automatically combines what many indicators try to show individually — such as trend strength, momentum shifts, and volatility ranges.
It’s built using linear regression, which means it mathematically calculates the “average path” of price movement, along with upper and lower boundaries that represent standard deviations from that average.
In simple terms:
➡️ It already reflects what tools like MACD, RSI, and moving averages are trying to capture — but in a single, visual, and statistically balanced structure.
That’s why breaking out of a regression channel often signals a major shift in trend direction or volatility expansion.

Bitcoin trend analysis!(BTCUSDT) The weekly structure remains bullish overall, but is currently in a corrective leg back into a key higher-timeframe demand zone.
Confluence of the long‑term ascending trendline and horizontal zone around 80,000–82,000, just under the current price; a deeper buffer of 76,000 marks the top of the “significant and major support” area highlighted on your chart.
The previous distribution band at 123,000–125,000 remains the main upside target and weekly resistance; any new impulse leg will likely aim back into this zone first.
The rounded basing structures since 2022, plus the current pullback, suggest a large continuation pattern rather than a full trend reversal, as long as weekly candles keep closing above the 76k support shelf.
80k–76k holds and forms a clear higher low; the weekly chart favors a renewed push toward six-figure territory and a potential retest of the 123k–125k highs. A decisive weekly close below 76k would invalidate this and open risk toward the mid-60k demand block inside the grey zone.

Bitcoin Eyes Technical Pullback Before Next Upward MoveHello everyone,
Bitcoin is pausing after a rebound from the 86,000 USD area, but upward momentum faces resistance around 92,000 USD—where a red FVG, old supply zones, and heavy volume converge. Every approach to this area triggers downward pressure, producing red candles near supply zones, showing that selling pressure remains significant.
Nonetheless, the macro backdrop supports buyers: a weaker USD, declining US bond yields, and expectations of Fed rate cuts in 2025–2026 help Bitcoin hold higher levels. ETF inflows are returning, institutions are buying on dips, while the broader market remains neutral without FOMO.
Technically, lower FVGs at 89,500–90,000, 88,000–88,500, and 86,500–87,000 USD provide reasonable retracement areas before the next breakout. The structure has yet to form a new high, upward momentum is weak, and selling pressure has slightly recovered; this technical correction is an opportunity for the market to gather liquidity.
Forecast: BTC may retrace to 89,500 USD, and if selling remains strong, it could test 88,000–88,500 USD. Subsequently, buying pressure should return, pushing BTC back toward the 92,000–93,000 USD resistance, continuing the long-term uptrend.

BTC 15-Min Range: Fueling Up for 90Kthis is the 15-minute Bitcoin chart. The price is currently ranging between 85,000 and 87,000, and this phase is for gathering energy or Accumulation.
Main Analysis: This ranging movement is necessary to grab liquidity and prepare for the next big move.
The chart's potential is still bullish, and we expect that after this range is over, the price will break above strongly and repeat its move up to the 90,000 area!

Are you people crazy? Did you not learn from the 2022 crash?I didn't think it was necessary to publish anything, at least until next year. It was clear to me, and it's even clearer now, that BTC is on the path of decline. Yet, since the end of November I've started hearing rumors of a bull run, that BTC has hit the bottom and will now FOR SURE go back to 127,000...
Either you've all gone crazy, or someone is trying to get retail investors to buy so they can happily dump in their faces.
I won't name names, but one of these con-artists has a name that start with M and ends with K.
Keep your hands on your ass; DON'T BUY!
The market is going down and will stay down until at least January.
And if by chance there should be a pump back up to 127,000, don't be amateurs; wait to get back to the top and then sell, even your grandmother.
And for the love of God; if you use perpetuals, have at least the decency to buy AND sell at the same time, keeping your SL very, very, far from the Fair Price.
Why is going down? Well, i have another name for you: it starts with T and ends with P. If you want to measure how healty is the market keep an EYE on the POTUS Coin.
A lot of people already lost a lot of money.
Be smart; crypto ARE NOT for betting junkies.
Bitcoin Update
Bitcoin entered the 85,000-range and bounced upward from there, but I don’t think the market will turn bullish with just a single move. It will likely consolidate in this zone for a few days, then move up after forming a bullish pattern. Whether it breaks upward now or after a period of consolidation, the first target for the move is $106,000.

BTCUSDT.P AnalysisBTCUSDT.P consolidates at 86,307 after a 5% December pullback from 113K highs, holding key demand zone 85K–87K with low volume.
Technical Indicators
RSI (32–40) and Stochastic signal oversold conditions across timeframes, while MACD shows bearish divergence weakening.
ADX above 50 confirms downtrend strength, but higher lows near 85K suggest potential reversal structure.
Key Levels
Support: 85,000 (swing low), 83,000 (next demand).
Resistance: 86,500 (breakout test), 89,500–93,500 (supply).

BTC Sell/Short Setup (4H)Based on the previous wave counts, it seems that wave D will complete in the red zone.
We have prepared a setup that you can use to enter a position with 10X to 14X leverage.
The targets, stop-loss levels, and entry point are marked on the chart.
For risk management, please don't forget stop loss and capital management
When we reach the first target, save some profit and then change the stop to entry
Comment if you have any questions
Thank You

BTCUSDT.P - December 2, 2025Bitcoin remains in a broader downtrend but is currently consolidating between resistance around 87,400–87,700 and support near 83,400. The chart outlines a potential breakout toward 91,375 if price can reclaim and hold above the consolidation range, with that level marked as the primary profit target. Conversely, a failure at resistance and a break below 83,400 would confirm renewed bearish momentum toward the lower profit zone around 80,000. Trend structure is neutral-short term within this range, and a decisive move outside the highlighted consolidation band is needed to confirm the next directional leg.

BTC/USD) Bullish trend analysis Read The captionSMC Trading point update
Technical analysis of BTCUSDT – SMC + Channel Structure Analysis (1H Chart)
Your chart presents a well-structured ascending channel continuation model, supported by SMC concepts and EMA confluence. The idea is technically sound and aligns with bullish market structure.
---
1. Market Structure
BTC is trading inside a rising channel (higher highs & higher lows).
Price bounced multiple times from the lower channel support, confirming strong bullish order flow.
The current price around 91,747 shows steady accumulation after a previous impulsive leg.
---
2. Key Demand Zone (Reaccumulation Area)
The blue zone around 90,150 – 90,900 is your:
IVB / Support Level / Demand Zone
This zone aligns with:
200 EMA support
50 EMA retest
Structure demand
Previous imbalance fill
This is a high-probability reaccumulation zone supporting further continuation.
Price tapped the lower region, held strongly, and then re-entered the bullish channel.
---
3. Expected Price Action
Your projection shows:
1. Price pushing upward from channel midline
2. A small pullback inside the channel
3. After minor corrections, a final breakout toward the upper channel line
4. Targeting external liquidity around 96,868
This aligns with standard:
Channel Continuation → Premium Zone → Liquidity Target
---
4. Target
Main Target: 96,868
This level is:
The next liquidity pool above current highs
The upper boundary of the rising channel
A measured-move extension from the last impulse (highlighted in blue rectangle)
This target is realistic and technically valid.
---
5. Summary of the Idea
Component Detail
Trend Bullish
Structure Ascending Channel
Key Support 90,150 – 90,900
Bias Continuation long
Model Accumulation → Expansion → Reaccumulation → Expansion
Target 96,868
Mr SMC Trading point
---
Overall Evaluation
Your analysis is strong, logical, and consistent with SMC & market structure:
Clean channel structure
Demand zone valid
EMA confluence
Good projection of breakout
Proper target selection
This is a solid bullish continuation setup—as long as the price respects the channel support.
---
please support boost 🚀 this analysis

• BTCUSDT: Liquidity Sweep Reversal — Watching $88,000 and $91,5BTCUSDT has just swept liquidity below the demand zone and printed a clean bullish hammer, signaling a potential reversal from our marked buying zone. If this reaction holds, price could push toward the upside targets at $88,000 and $91,500 as highlighted on the chart.
This demand zone remains crucial for confirming whether BTC is ready for a recovery or if sellers will attempt to drive it back below $86,500. Always manage your risk properly when trading volatile market conditions.
For further analysis, please like and comment.

Bitcoin consolidation bearish momentumBitcoin continued its consolidation within bearish trend lower price multiple times and decline and price controlled down move i expect deliver bearish trend from the current situation see the bitcoin structure.
Technically Prices fell more than 6% during overnight trading and were quoted just above the 85,000 level early Monday morning on the U.S. East Coast.
Bitcoin has maintained a bearish structure since May, when price action briefly tested resistance near 89,000 before turning lower again. Downside pressure remains as long as price stays below that resistance zone, with key support levels expected around 83,000 to 80,000.
You may find more details in the chart,
Trade wisely best of luck buddies.
Ps; Support with like and comments for better analysis thanks for supporting.

Daily bitcoin trade - Fri(Nov-28-2025) - ShortFri(Nov-28-2025) - Short
Lev: 25x
En:90780
Sl: 93390
TP:87885
This is my personal setup — please always manage your risk.
This is not an offer to buy or sell.
