EcoByG Bitcoin Daily Analysis #10 — Daily BTC Market UpdateWelcome to My Analysis.
Now, let’s break down today’s Bitcoin structure.
Right now, Bitcoin is doing nothing special and that’s the most important thing to understand.
Price is trapped, momentum is weak, and the market is waiting.
Here’s the simple breakdown."
After that heavy drop, price came down and touched the 80K area and reacted from there.
This shows that buyers were active at those levels, but the move is not strong enough yet to call it the start of a bullish trend.
At the moment, Bitcoin is trading around 90K.
Above price, there is a major resistance around 94K.
As long as price cannot break this level with strength and hold above it, the market is still controlled by sellers.
On the downside, as long as the 83K–80K zone holds, a deep sell-off is not confirmed either.
So price is basically trapped between these two levels — a boring, exhausting range.
The moving averages are still above price and sloping downward,
which means we don’t have a bullish trend yet.
RSI has bounced from the lows, but it’s still below 50 — selling pressure has eased, but buyers are not dominant.
Simple conclusion:
This is not a place for emotional longs.
It’s also not a place for aggressive shorts.
The market is breathing and building liquidity before making its next decision.
Either:
94K breaks → we can talk about a bullish recovery
or:
83K breaks → the bearish scenario activates
Until then, every move is just noise.
Remember:
In these phases, making money is for professionals, but losing money is for impatient traders.
so maybe it’s better to relax and get ready for Christmas. 🎄
⚠️ Risk Alert ⚠️
Futures are not beginner-friendly. These triggers require solid experience.
Before using them, study risk management and practice with the learning content here.
Trade ideas

BTC/USDT Long Position: Bounce Play from Key Demand Zone📝 My BTC/USDT Long Trade Log (Not Financial Advice)
This is my personal analysis and trade plan for BTC/USDT. This is for my own educational purposes, and I encourage you to Do Your Own Research (DYOR) before considering any trade.
🧠 My Thought Process and Trade Rationale
My overall thesis here is a long trade targeting a strong bounce from a key historical demand area.
Identifying the Setup: I noticed that the price of BTC/USDT has recently pulled back sharply after a volatile spike. Crucially, it is now retesting a critical demand zone that is clearly marked on my chart (the green box). This zone has reliably held up as strong support on multiple occasions in the days leading up to December 13th.
Choosing the Entry: I don't want to chase the entry, so I've placed my ENTRY LEVEL right at the upper edge of this major support zone, between $90,000.0 and $89,702.2. This positioning gives me the best possible risk-to-reward ratio for a low-risk entry, expecting that this area will absorb selling pressure.
Defining the Risk (Stop Loss): I am defining my risk clearly by setting my STOP LOSS (SL) at $89,606.3. If the market breaks below this point, it means the entire historical demand zone has failed. That invalidates my bullish thesis, and I will exit the trade immediately to protect my capital.
Setting Profit Targets (The Bounce Goal): I am anticipating a sharp bounce back up toward the recent swing highs and liquidity areas. I've set my TAKE PROFIT ZONE with three tiers:
TP1 ($91,808.7): This is my initial target, aiming to capture the first major structural resistance point.
TP2 ($92,124.3): This aims for the center of the recent consolidation area, where strong selling occurred previously.
TP3 ($92,960.3): This is my stretch goal, aiming for a full recovery toward the highest volatility levels we saw earlier this week.
Parameter, My Price Level
Direction, Long
Entry Zone,"$90,000.0 – $89,702.2"
Stop Loss (SL),"$89,606.3"
Take Profit 1 (TP1),"$91,808.7"
Take Profit 2 (TP2),"$92,124.3"
Take Profit 3 (TP3),"$92,960.3"

BTcUSDTGood support has been reached... With the trend line stabilizing and no consolidation below it, an upward movement can be expected.

BtcusdtHi snipers. Bitcoin fell from its historic high of $126,199 in the weekly timeframe and reached a low of $80,600 in 7 weeks, although it only touched this price with a shadow. During this period, the decline was on increasing volume, after which it stopped and there was a weekly bullish candle with medium volume and two doji candles. If we look at these 3 candles on the daily timeframe, we see a fixed high of 94,500 and increasing lows, which is an ascending triangle pattern.
Of course! Here's the English translation of the full explanation I gave earlier:
---
This pattern is most likely an **Ascending Triangle**, which typically signals a continuation of an uptrend and a potential **bullish breakout**.
#### 📐 What Is an Ascending Triangle?
An ascending triangle forms when:
- The **resistance level (ceiling)** remains flat (in this case, at 94,000).
- The **support levels (floors)** are gradually rising, indicating increasing buying pressure.
This pattern often appears in uptrends and suggests that **buyers are gaining strength** and may soon push the price above the resistance.
#### 📈 Key Insights from This Pattern
- **Breakout Confirmation**: A valid breakout occurs when the price closes above 94,000 with strong volume.
- **Price Target**: The height of the triangle (difference between the first low and the resistance) is often projected upward from the breakout point. For example, if the first low was 85,000, the target could be around 103,000.
- **Beware of False Breakouts**: If the breakout happens with low volume or lacks follow-through, the price might fall back into the triangle.
#### ⚠️ Cautions and Considerations
- **No pattern is 100% reliable**. It's best to use additional tools like RSI, MACD, or moving averages for confirmation.
- **Risk management is crucial**. Setting a stop-loss just below the last higher low can help limit potential losses.
Would you like a chart of this pattern or a more detailed analysis of Bitcoin’s current setup?

BTCUSDT (4H) chart update !!BTC is holding above the rising trendline and trying to stabilize.
The 88,000–89,000 zone is acting as strong support, where previous bounces occurred.
As long as this support holds, upside targets remain 94,000 → 98,000 → 102,000.
A 4H close below 89K could open room for a pullback toward 85K–84K.
The overall structure remains bullish consolidation. 🚀
DYOR | NFA

Brainiak | Bitcoin support zone (Wave Analysis)after yesterday’s analysis (Dec 12), we pointed out that if price was still unable to break out of the range, a pullback could happen at any time. Price did pull back and once again reacted at the same support zone around 89,000.
After that, price bounced and started to move sideways. If price is going to continue upward from here, the key support levels to watch are:
89,000
88,000
86,000
84,000
These levels are listed from the easiest to the hardest for price to move higher (top = easiest, bottom = hardest). At the moment, the market is still not willing to break out easily. I think price may need to stay in a sideways range for a while.
From my perspective, the most recent drop could simply be a fake move. Bitcoin often behaves this way .. it pumps aggressively, then gets slammed down hard without breaking support, before rallying strongly again.
Right now, the key thing to wait for is how price reacts at each support level, especially whether we see a strong impulsive reaction immediately after touching the zone.

Surviving this market for 10 years taught me thisI’ve been trading this market for over 10 years.
In the beginning, all I cared about was how much I could make.
That’s what most people focus on.
What I learned the hard way is this:
If the account doesn’t survive, nothing else matters.
No funds means no next trade.
No next trade means no edge, no learning, no comeback.
There were long periods where I wasn’t making money.
But I was protecting my ability to stay in the game.
That mattered more than being right.
This chart isn’t about profits.
It’s about still being here.

BTCUSDTBTCUSDT is trading within a tight range near a key technical zone, indicating indecision between buyers and sellers.
Such market conditions often lead to false breakouts and emotional overtrading.
A disciplined approach is to wait for clear price acceptance or rejection before entering trades.
Position size should remain controlled to manage risk effectively.
Reacting to confirmed price action, rather than anticipating direction, improves consistency.
At this stage, capital preservation and patience are more important than aggressive trade execution.

How Investment Funds Really Make Money From Bitcoin📰 After years of closely following financial markets, one conclusion has become impossible for me to ignore:
most people fundamentally misunderstand how professional funds make money from Bitcoin.
Retail traders often assume funds operate the same way they do — buying low, selling high, and betting on direction.
If price goes up, they win.
If price goes down, they lose.
That assumption is overly simplistic — and largely incorrect.
🔍 For institutional funds, Bitcoin is not a directional gamble.
From what I’ve observed, large funds are not emotionally attached to whether Bitcoin rises tomorrow or drops next week.
Price direction is not their primary concern.
What truly matters is structure.
Funds are not rewarded for guessing the market correctly.
They are rewarded for controlling risk and systematically converting volatility into measurable returns.
🎯 Their real objective is volatility, not conviction.
When a fund allocates capital to Bitcoin, it is rarely driven by belief in a narrative or excitement around headlines.
They don’t follow influencers.
They don’t react to social media hype.
What they care about is quantifiable price movement.
Volatility is the raw input.
Mathematical models are the engine.
Decisions are driven by numbers, not emotions.
🧠 Buying Bitcoin does not automatically mean being bullish.
One of the most common misconceptions I encounter is the idea that institutional buying signals an expectation of higher prices.
In reality, a fund can purchase Bitcoin while remaining entirely neutral.
They can be delta-neutral, fully hedged, detached from market direction, and protected against both upside and downside moves.
This is why buying BTC is not a bet for them.
It is simply the first layer in a multi-stage trading structure.
📊 So how do funds actually profit from price movement?
By combining spot exposure with derivatives, funds build positions that benefit from movement itself rather than predicting direction.
When price rises, positions are adjusted and partial exposure is sold at higher levels to rebalance risk and lock in gains.
When price falls, exposure is rebuilt at lower prices to restore balance.
🔁 Price moves higher → exposure is reduced at better levels
🔁 Price moves lower → exposure is increased at cheaper levels
🔁 The process repeats with discipline and precision, free from emotion
This systematic process is known as gamma scalping — the quiet, continuous profit mechanism behind institutional trading.
💰 Where do their real profits come from?
Not from news headlines.
Not from influencers.
Not from ETF narratives.
Profits are generated through continuous hedge adjustments, realized volatility exceeding expectations, direction-neutral structures, and strict mathematical discipline.
⛔ The only environment that truly challenges these strategies is when the market stops moving altogether.
🧭 Let me be direct with you, speaking as a market professional.
You are not BlackRock.
You do not have their infrastructure.
You do not have their capital, execution speed, or risk frameworks.
Attempting to interpret or replicate their actions without understanding the underlying structure will not improve your trading — it will only increase confusion.
✍️ My conclusion is straightforward:
Funds do not profit from predicting the future.
They profit from engineering outcomes.
They do not trade stories.
They do not trade emotions.
They do not trade social media noise.
🎯 They trade structure.
And you?
Stop obsessing over what institutions are doing.
Start focusing on what you should be doing.
That is the line between surviving in the market
and being quietly pushed out of it.

The Crypto Money Flow CycleThe capital rotation cycle in the crypto market is not a theoretical concept, but a phenomenon that has repeated itself across multiple growth cycles. It reflects the natural behavior of capital flows: starting from the safest assets, then gradually spreading to higher-volatility instruments as confidence and risk appetite increase. Typically, capital first flows into Bitcoin — the foundational asset and “anchor” of the entire market — before rotating into Ethereum, a core ecosystem that consistently attracts strong inflows once market conditions stabilize.
When these two pillars begin to slow down, capital expands into large-cap altcoins, then accelerates into meme coins, and ultimately ends in the riskiest assets such as shitcoins. This is the point at which the market reaches peak heat: potential returns are enormous, but risk is also at its highest level.
If Bitcoin is the main river, Ethereum represents the major tributaries, altcoins are the canal system, and meme coins and shitcoins are the stagnant waters at the very end of the flow — the murkiest area, but also the place where many investors are most likely to “drown.” The imagery may sound harsh, but it accurately captures the market’s nature: the higher the potential return, the greater the downside, and near the end of the cycle, even a small variable can push the entire structure into chaos.
Understanding this cycle not only helps investors identify where the market currently stands, but also supports more rational capital allocation decisions. When capital is still concentrated in BTC and ETH, rushing into shitcoins offers little advantage and only increases the risk of capital loss. Conversely, when the market enters its euphoric phase, FOMO often overrides logic: newcomers rush in just as smart money is preparing to exit. Recognizing the cycle helps avoid these traps. It also explains the common frustration of “the coin I hold goes nowhere while others keep pumping,” because you understand where capital is flowing instead of investing based on emotion.
To accurately identify the market’s position within the cycle, it is essential to observe behavior at each stage. When BTC rallies strongly and BTC Dominance rises, capital is in the early phase. This is the time to focus on Bitcoin and avoid smaller altcoins, as they usually underperform when dominance expands. When Bitcoin starts to slow down, moving sideways or correcting slightly while the ETH/BTC pair trends steadily higher, capital is rotating into Ethereum. This phase often favors increasing exposure to ETH.
When both BTC and ETH stall, the market enters Altcoin Season. Altcoins with solid fundamentals, mid-to-large market capitalizations, and clear narratives become the primary destinations for capital. This is when Layer-1, Layer-2, DeFi, AI, and RWA sectors tend to perform strongly. However, this is still not the right time to dive into meme coins and shitcoins, as the market remains in the “mid-cycle” phase, where performance belongs to fundamentally backed assets rather than purely speculative tokens.
The final — and most dangerous — stage is when meme coins and shitcoins explode. The clearest signs are social media being flooded with x20, x50, or x100 stories and near-vertical price charts detached from any real product or utility. This is when smart money gradually exits, leaving the stage to new participants driven by euphoria. If participation is unavoidable, only a very small portion of capital should be allocated, with a mindset of “fast in, fast out,” because risk in this environment can materialize within hours.
To navigate the full cycle effectively, several indicators should be monitored consistently. BTC Dominance reveals whether the market is prioritizing safety or expanding toward risk. Market capitalization and liquidity determine both upside potential and downside resilience. Finally, the risk-on/risk-off environment clearly reflects investors’ willingness to take risk. When the market shifts to risk-on, altcoins and meme coins tend to surge; when it turns risk-off, capital typically flows back into BTC or stablecoins for defense.

BTC GO SHORT > DIVERGENCE > BULLRUNI'm expecting BTC will go short in these few days.
We need to monitor until bullish divergence happen to confirm reversal and buyers in control.
Currently seller in control.

BTC shortI think BTC could experience this decline in the coming days.
Entry market: 89984$
SL: 90968$
TP: 87026$

Bitcoin Shown OpportunityEntry taken after nearest 1H swing low got swept and sharp turn formed. A good question is will price hit our TP? Let's wait and see.👀

BTC-USDTBitcoin made a sharp candle move 📊🪙
There's an important support around $90,000.
If this level holds, it could potentially bounce back upwards 🔼
But if the price breaks below 87, there’s a chance the correction could continue down to 89 and then to 87,400 🚨🔽

$BTC Current Bias UpdateCRYPTOCAP:BTC trend is still bearish, and it’s currently trading on 8H and 6H bullish OB means demand area.
Analysis i shared earlier for CRYPTOCAP:BTC is still same.

BTC may shakeout the volatility and determine the directionBitcoin is locked in a consolidation with a neutral sentiment, around 92-93K price zone, which is the theshold, which may either regain optimism back or turn to market to the lower boundary of optimistic zone, according to NUPL indicator (from onchain analysis perspective).
Technically, BTC loses momentum and can't determine the direction yet, so the current triangle might be broken to both sides, and the development of a further direction would depend on which side would be broken first.
Scenario 1: Downside break, support, then resuming the uptrend.
That seems as a realistic scenario, but not very likely, as recently BTCUSD had displayed a visible bullish pressure.
The more realistic scenario is:
Scenario 2: Upside breakout (failed) and then the path to $80k is open.
That's not the recommendation, do your own research and never forget to manage your risk!

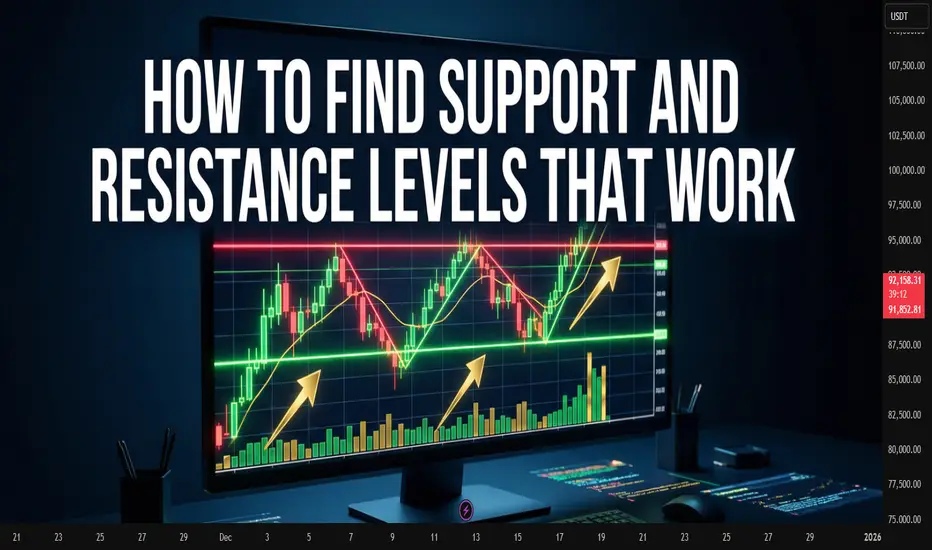
How to Find Support and Resistance Levels That Actually WorkHow to Find Support and Resistance Levels That Actually Work
Price never moves in a straight line. It bounces off invisible barriers, pauses, reverses. These barriers are called support and resistance levels.
Sounds simple. But traders often draw lines where they don't exist. Or miss truly strong zones. Let's figure out how to find levels where price reacts again and again.
What Support and Resistance Are
Imagine a ball thrown in a room. It hits the floor and ceiling. The floor is support, the ceiling is resistance.
Support works from below. When price falls to this zone, buyers activate. They consider the asset cheap and start buying. The decline slows or stops.
Resistance works from above. Price rises, reaches a certain height, and sellers wake up. Some lock in profits, others think the asset is overvalued. Growth slows down.
Why Levels Work at All
Thousands of traders look at the same chart. Many see the same reversal points in the past.
When price approaches this zone again, traders remember. Some place pending buy orders at support. Others prepare to sell at resistance. It becomes a self-fulfilling prophecy.
The more people noticed the level, the stronger it is.
Where to Look for Support and Resistance
Start with weekly or daily charts. Zoom out to see history for several months or years.
Look for places where price reversed multiple times. Not one bounce, but two-three-four. The more often price reacted to a level, the more reliable it is.
Look at round numbers. Trader psychology works so that levels like 100, 1000, 50 attract attention. Orders cluster around these marks.
Look for old highs and lows. A 2020 peak can become resistance in 2025. A crisis bottom turns into support a year later.
Drawing Levels Correctly
A level is not a thin line. It's a zone several points or percent wide.
Price rarely bounces from an exact mark. It can break through a level by a couple of points, collect stop-losses and return. Or stop a bit earlier.
Draw a horizontal line through candle bodies, not through wicks. Wicks show short-term emotional spikes. The candle body is where price closed. Where traders agreed on a compromise.
Don't clutter your chart with a hundred lines. Keep 3-5 most obvious levels. If you drew 20 lines, half of them don't work.
How to Check Level Strength
Count touches. Three bounces are more reliable than one. Five bounces - that's a powerful zone.
Look at volume. If there's lots of trading at a level, it confirms its significance. Large volume shows major players are active here.
Pay attention to time. A level that worked five years ago may lose strength. Fresh levels are usually stronger than old ones.
When a Level Breaks
A breakout happens when price closes beyond the level. Not just touched with a wick, but closed.
After a breakout, support becomes resistance. And vice versa. This is called polarity shift. Traders who bought at old support now sit in losses and wait for return to entry point to exit without losses.
A breakout must be confirmed. One candle beyond the level is not a breakout yet. Wait for the day to close, check volume, verify price didn't return.
False breakouts happen all the time. Major players deliberately knock out stops to collect liquidity.
Common Mistakes
Traders draw levels on small timeframes. A five-minute chart is full of noise. Levels from hourly or daily charts work better.
Traders ignore context. Support in an uptrend is stronger than in a downtrend. Resistance in a falling market breaks easier.
Traders enter exactly at the level. Better to wait for a bounce and confirmation. Price can break through a level by several points, knock out your stop, then reverse.
Diagonal Levels
Support and resistance aren't only horizontal. Trendlines work as dynamic levels.
In an uptrend, draw a line through lows. Price will bounce from this line upward.
In a downtrend, connect highs. The line becomes dynamic resistance.
Trendlines break just like horizontal levels. A trendline break often signals a trend reversal.
Combining with Other Tools
Levels don't work in isolation. Their strength grows when they coincide with other signals.
A level at a round number + cluster of past bounces + overbought zone on an oscillator - this is a powerful combination for finding reversals.
Traders often add technical indicators to their charts to help confirm price reaction at levels. This makes analysis more reliable and reduces false signals.
BTCUSD Short Setup ExplainedSummary
Bitcoin rejected multiple key resistance levels and failed to reclaim the Yearly Open, showing clear signs of weakening bullish momentum. This created a high-probability short setup.
Market Structure
Price formed a rising wedge structure during a corrective move inside a broader downtrend. Each bounce showed diminishing strength, and sellers consistently stepped in at resistance. After several failed attempts to break the upper levels, the structure broke down.
Entry Reasoning
Multiple rejections at major resistance
Loss of bullish momentum on lower timeframes
Cluster of bearish divergences on Market Liberator (momentum waves rolling over, money flow weakening)
Rising wedge breakdown, confirming bearish continuation
Trend remained bearish on higher timeframes
Targets
Profit targets were based on:
Prior liquidity zones
Fibonacci retracements
Previous support levels
Imbalance fills on the move down
First TP was hit quickly, and the remaining targets were aligned with the broader downtrend continuation.
Bias
Overall bias remains bearish unless price reclaims the Yearly Open with strength. As long as BTC continues to reject resistances and momentum stays weak, lower levels remain likely.

BTC - Up After Some Manipulation?Alright traders, let’s talk about today’s NY session drama.
We already saw some liquidity taken early in NY,
so this setup might work…
or might completely ignore us.
Classic BTC. 😅
The idea is simple:
I’m watching for an entry on the second reaction,
which could nicely form a double bottom.
If that structure holds,
BTC could push up and test the previous day high.
From there?
Yeah… we can easily rotate back down into the range,
because why make things simple on a Friday. 😄
This is one of those:
“it could happen”
and also
“it could absolutely not happen”
type of trades.
And very important:
👉 If we take the previous day high BEFORE my entry is triggered,
this trade is cancelled. No chase, no FOMO.
Friday rules apply.
Manipulation rules apply.
BTC rules apply (unfortunately).
⸻
👉 Quick NY session trade
👉 Double bottom idea
👉 Friday volatility mode ON
Good luck traders — and may BTC choose logic over chaos today 😄📉📈

Risk in the International Market1. Currency Exchange Rate Risk
One of the biggest risks in global markets is foreign exchange risk. When two countries conduct trade or an investor buys foreign assets, the value of the investment depends on exchange rates.
For example:
If an Indian company exports goods to Europe and the Euro weakens against the Rupee, the exporter may receive less money.
If an investor buys US stocks and the USD depreciates, the value of their investment falls in their home currency.
Exchange rate movements are driven by global demand and supply, interest rates, central bank policies, inflation, and geopolitical news. Even small fluctuations can cause huge changes in profitability.
2. Global Economic Risk
Economic health differs across countries. Some are growing rapidly, while others may be in recession. International markets are deeply connected, so a slowdown in one major economy can affect the entire world.
Examples:
A recession in the US often impacts global demand, stock markets, and commodity prices.
Slowdown in China reduces global industrial metal demand, affecting exporters like Australia, Brazil, and Africa.
Global economic risk includes:
Inflation spikes
Interest rate hikes
Unemployment rises
Lower GDP growth
Shifts in global trade patterns
International investors must monitor economic indicators across multiple countries to assess risk properly.
3. Geopolitical and War Risk
Geopolitical tensions, wars, territorial disputes, sanctions, and diplomatic conflicts cause high volatility in international markets. These events can disrupt trade routes, supply chains, and commodity prices.
Recent examples include:
Russia–Ukraine war impacting oil, gas, wheat, and nickel prices.
US–China trade war affecting global technology and semiconductor supply.
Middle East tensions pushing crude oil prices higher.
Even a single geopolitical headline can trigger sharp market movements. Investors closely track global political developments to manage this risk.
4. Regulatory and Compliance Risk
Each country has its own laws, financial regulations, tax structures, environmental rules, and trade policies. Companies operating internationally must comply with multiple legal frameworks, and sudden regulatory changes can bring financial losses.
Examples:
A country increasing import duty on electronics can hurt global manufacturers.
Sudden changes in foreign investment rules can impact multinational projects.
New data protection laws can affect IT and cloud-based businesses.
Regulatory risk requires businesses to stay updated with international laws and maintain strong compliance teams.
5. Interest Rate and Monetary Policy Risk
Central banks around the world, such as the US Federal Reserve, European Central Bank, RBI, or Bank of Japan, control interest rates and monetary policy. Their decisions directly impact global markets.
When interest rates rise:
Borrowing becomes expensive
Foreign investors move money to safer, higher-yield economies
Stocks and commodities may fall
When interest rates fall:
Markets often rally
Borrowing increases
Economic growth improves
International traders must monitor global central bank announcements because they influence currencies, bonds, equities, and commodities across the world.
6. Political Risk
Apart from wars or conflicts, routine political activities also influence global markets. These include:
Elections
Government instability
Policy changes
Nationalization of industries
Corruption or administrative inefficiency
Political uncertainty discourages foreign investment. A country with stable governance attracts more international capital, while a politically unstable regime increases risk.
7. Commodity Price Volatility Risk
Many countries rely heavily on global commodities such as crude oil, natural gas, gold, wheat, corn, copper, and more. Price fluctuations in these commodities affect economies, companies, and international trade.
For instance:
Rising oil prices hurt oil-importing countries like India.
Falling metal prices hurt metal exporters like Chile or Brazil.
Weather events (like El Niño) affect global food supply and prices.
Commodity risk is heavily influenced by global supply-demand trends, weather patterns, geopolitical events, and currency fluctuations.
8. Supply Chain and Logistics Risk
International trade depends on complex supply chains involving ports, ships, trucks, customs, warehouses, and multiple stakeholders. Any disruption can create massive financial losses.
Key supply chain risks include:
Pandemic-related lockdowns
Port congestion
Freight rate spikes
Strikes or labour shortages
Natural disasters
Cyberattacks on logistics systems
The COVID-19 pandemic highlighted the vulnerability of global supply chains, causing worldwide shortages of chips, medicines, and essential goods.
9. Technological and Cybersecurity Risk
The digital nature of global markets increases cybersecurity threats. Hackers, cyber-criminals, and state-sponsored attacks can disrupt banking systems, trading platforms, and corporate networks.
Risks include:
Data theft
Ransomware attacks
Online fraud
Trading system failures
Intellectual property theft
Companies trading globally must invest heavily in cybersecurity to protect sensitive data and maintain investor trust.
10. Cultural and Operational Risk
Operating in different countries means dealing with different cultures, languages, work ethics, and consumer behaviour. Misunderstanding local customs or market expectations can cause financial setbacks.
Examples:
Marketing strategies that work in the US may not work in Japan.
A product popular in Europe may not suit Indian tastes.
Local negotiation styles may differ widely from global norms.
Companies must adapt to local cultures through proper research, staffing, and training.
11. Credit and Payment Risk
When trading internationally, companies face credit risk because foreign buyers may delay payments, default, or go bankrupt. Cross-border legal recovery is often difficult and time-consuming.
This risk is managed through:
Letters of credit
Bank guarantees
Trade insurance
Advance payment agreements
But even with these measures, international transactions remain riskier than domestic ones.
12. Environmental and Climate Risk
Climate change and environmental laws increasingly affect international trade. Natural disasters disrupt transportation, production, and supply chains.
Examples:
Floods damaging manufacturing hubs
Heatwaves reducing agricultural output
Cyclones halting port operations
Environmental regulations also force companies to upgrade technology or pay penalties, adding to operational costs.
Conclusion
The international market offers enormous opportunities but also exposes participants to a wide range of risks—including currency fluctuations, geopolitical tensions, economic shocks, regulatory changes, and supply chain disruptions. Successful global investors or businesses must constantly monitor global trends, diversify exposures, use hedging tools, and maintain strong compliance and risk-management systems. Mastering these risks is essential to sustaining growth and profitability in a highly interconnected world.

BTC: The Optimal Trading OpportunityAs I have stated in my articles every day, BTC hitting the 90K level is the ideal buying opportunity, and my signals have been consistently indicating a buy. The market has once again validated my view, and we are now in profit. Keep holding your positions and close them when the price rallies.
All signals have been 100% accurate for two consecutive weeks. I’ll keep delivering precise signals — act fast to get yours now.

BTC/USDT🚀 Suggested Title: Check the Chart! Are the Buyers Still In, or Is It Time for a Deeper Correction?
Hey everyone!
This chart tells an interesting story. After the price successfully broke out of that small triangle pattern in the middle, it put in a great rally (strong upward movement).
Key Points Right Now:
Defense Zones: The price has dipped down twice and immediately picked up momentum again right on the key support levels (blue boxes and green arrows). This means buyers are still actively in the market and aren't letting the price drop easily.
Small Warning: That diagonal blue trendline that the price was moving within has been broken. This could be a sign that the current rally is getting tired, and we might be entering a phase of deeper correction.
What's Next?
Re-Acceleration: If the price can climb back above that broken trendline and hold the current support area, the flight upwards will continue.
Risk of Drop: If the current support is decisively broken and we establish a close below it, we should probably prepare for a deeper correction down to the lower blue box.
In Summary: The market is currently at a critical point. Pay close attention to how the price reacts to the current support levels. Take risk seriously! 😉

EcoByG Bitcoin Daily Analysis #9 / Daily BTC Market UpdateWelcome to My Analysis.
Now, let’s break down today’s Bitcoin structure.
Bitcoin is ranging with a weak bullish tilt
a higher low has formed, but the highs still haven’t broken.
The market is breathing before its next decision.
Let’s break it down.
Market Structure:
Range-Bound with a Weak Bullish Bias
Why?
A new Higher Low has formed compared to the 89.7K bottom.
But the highs are still unbroken, meaning a strong trend hasn’t emerged yet.
The market is mostly in a breathing phase before making its next decision.
Current Price Position
Price is trading exactly inside a key zone:
92,100 – 92,300
This zone has recently flipped into support (S/R Flip).
Multiple bounces from this region confirm its importance.
Price is currently above SMA 28 and SMA 58, → indicating a short-term positive momentum.
But it remains below SMA 99, → meaning the medium-term trend is still neutral to weak.
Volume Conditions
Strong buy volume at the bottom of the range shows solid demand.
But during upward moves, volume decreases → the bullish momentum is still weak.
To break through 92.9K, a volume spike is required.
Overall View
The market is moving inside a short-term range,
with a weak but existing bullish bias, though not confirmed yet.
Key Levels
Break above 93K → bullish continuation
Break below 91K → deeper correction
Main supports remain:
89.7K
The strong lower zone 88.8K – 88.3K
⚠️ Risk Alert ⚠️
Futures are not beginner-friendly. These triggers require solid experience.
Before using them, study risk management and practice with the learning content here.
