BTC may shakeout the volatility and determine the directionBitcoin is locked in a consolidation with a neutral sentiment, around 92-93K price zone, which is the theshold, which may either regain optimism back or turn to market to the lower boundary of optimistic zone, according to NUPL indicator (from onchain analysis perspective).
Technically, BTC loses momentum and can't determine the direction yet, so the current triangle might be broken to both sides, and the development of a further direction would depend on which side would be broken first.
Scenario 1: Downside break, support, then resuming the uptrend.
That seems as a realistic scenario, but not very likely, as recently BTCUSD had displayed a visible bullish pressure.
The more realistic scenario is:
Scenario 2: Upside breakout (failed) and then the path to $80k is open.
That's not the recommendation, do your own research and never forget to manage your risk!
Trade ideas

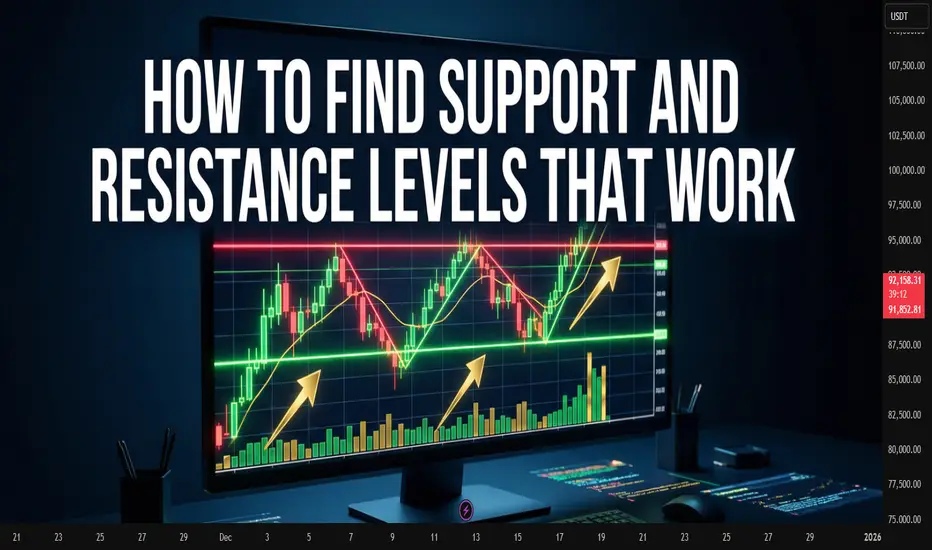
How to Find Support and Resistance Levels That Actually WorkHow to Find Support and Resistance Levels That Actually Work
Price never moves in a straight line. It bounces off invisible barriers, pauses, reverses. These barriers are called support and resistance levels.
Sounds simple. But traders often draw lines where they don't exist. Or miss truly strong zones. Let's figure out how to find levels where price reacts again and again.
What Support and Resistance Are
Imagine a ball thrown in a room. It hits the floor and ceiling. The floor is support, the ceiling is resistance.
Support works from below. When price falls to this zone, buyers activate. They consider the asset cheap and start buying. The decline slows or stops.
Resistance works from above. Price rises, reaches a certain height, and sellers wake up. Some lock in profits, others think the asset is overvalued. Growth slows down.
Why Levels Work at All
Thousands of traders look at the same chart. Many see the same reversal points in the past.
When price approaches this zone again, traders remember. Some place pending buy orders at support. Others prepare to sell at resistance. It becomes a self-fulfilling prophecy.
The more people noticed the level, the stronger it is.
Where to Look for Support and Resistance
Start with weekly or daily charts. Zoom out to see history for several months or years.
Look for places where price reversed multiple times. Not one bounce, but two-three-four. The more often price reacted to a level, the more reliable it is.
Look at round numbers. Trader psychology works so that levels like 100, 1000, 50 attract attention. Orders cluster around these marks.
Look for old highs and lows. A 2020 peak can become resistance in 2025. A crisis bottom turns into support a year later.
Drawing Levels Correctly
A level is not a thin line. It's a zone several points or percent wide.
Price rarely bounces from an exact mark. It can break through a level by a couple of points, collect stop-losses and return. Or stop a bit earlier.
Draw a horizontal line through candle bodies, not through wicks. Wicks show short-term emotional spikes. The candle body is where price closed. Where traders agreed on a compromise.
Don't clutter your chart with a hundred lines. Keep 3-5 most obvious levels. If you drew 20 lines, half of them don't work.
How to Check Level Strength
Count touches. Three bounces are more reliable than one. Five bounces - that's a powerful zone.
Look at volume. If there's lots of trading at a level, it confirms its significance. Large volume shows major players are active here.
Pay attention to time. A level that worked five years ago may lose strength. Fresh levels are usually stronger than old ones.
When a Level Breaks
A breakout happens when price closes beyond the level. Not just touched with a wick, but closed.
After a breakout, support becomes resistance. And vice versa. This is called polarity shift. Traders who bought at old support now sit in losses and wait for return to entry point to exit without losses.
A breakout must be confirmed. One candle beyond the level is not a breakout yet. Wait for the day to close, check volume, verify price didn't return.
False breakouts happen all the time. Major players deliberately knock out stops to collect liquidity.
Common Mistakes
Traders draw levels on small timeframes. A five-minute chart is full of noise. Levels from hourly or daily charts work better.
Traders ignore context. Support in an uptrend is stronger than in a downtrend. Resistance in a falling market breaks easier.
Traders enter exactly at the level. Better to wait for a bounce and confirmation. Price can break through a level by several points, knock out your stop, then reverse.
Diagonal Levels
Support and resistance aren't only horizontal. Trendlines work as dynamic levels.
In an uptrend, draw a line through lows. Price will bounce from this line upward.
In a downtrend, connect highs. The line becomes dynamic resistance.
Trendlines break just like horizontal levels. A trendline break often signals a trend reversal.
Combining with Other Tools
Levels don't work in isolation. Their strength grows when they coincide with other signals.
A level at a round number + cluster of past bounces + overbought zone on an oscillator - this is a powerful combination for finding reversals.
Traders often add technical indicators to their charts to help confirm price reaction at levels. This makes analysis more reliable and reduces false signals.
BTC - Up After Some Manipulation?Alright traders, let’s talk about today’s NY session drama.
We already saw some liquidity taken early in NY,
so this setup might work…
or might completely ignore us.
Classic BTC. 😅
The idea is simple:
I’m watching for an entry on the second reaction,
which could nicely form a double bottom.
If that structure holds,
BTC could push up and test the previous day high.
From there?
Yeah… we can easily rotate back down into the range,
because why make things simple on a Friday. 😄
This is one of those:
“it could happen”
and also
“it could absolutely not happen”
type of trades.
And very important:
👉 If we take the previous day high BEFORE my entry is triggered,
this trade is cancelled. No chase, no FOMO.
Friday rules apply.
Manipulation rules apply.
BTC rules apply (unfortunately).
⸻
👉 Quick NY session trade
👉 Double bottom idea
👉 Friday volatility mode ON
Good luck traders — and may BTC choose logic over chaos today 😄📉📈

Risk in the International Market1. Currency Exchange Rate Risk
One of the biggest risks in global markets is foreign exchange risk. When two countries conduct trade or an investor buys foreign assets, the value of the investment depends on exchange rates.
For example:
If an Indian company exports goods to Europe and the Euro weakens against the Rupee, the exporter may receive less money.
If an investor buys US stocks and the USD depreciates, the value of their investment falls in their home currency.
Exchange rate movements are driven by global demand and supply, interest rates, central bank policies, inflation, and geopolitical news. Even small fluctuations can cause huge changes in profitability.
2. Global Economic Risk
Economic health differs across countries. Some are growing rapidly, while others may be in recession. International markets are deeply connected, so a slowdown in one major economy can affect the entire world.
Examples:
A recession in the US often impacts global demand, stock markets, and commodity prices.
Slowdown in China reduces global industrial metal demand, affecting exporters like Australia, Brazil, and Africa.
Global economic risk includes:
Inflation spikes
Interest rate hikes
Unemployment rises
Lower GDP growth
Shifts in global trade patterns
International investors must monitor economic indicators across multiple countries to assess risk properly.
3. Geopolitical and War Risk
Geopolitical tensions, wars, territorial disputes, sanctions, and diplomatic conflicts cause high volatility in international markets. These events can disrupt trade routes, supply chains, and commodity prices.
Recent examples include:
Russia–Ukraine war impacting oil, gas, wheat, and nickel prices.
US–China trade war affecting global technology and semiconductor supply.
Middle East tensions pushing crude oil prices higher.
Even a single geopolitical headline can trigger sharp market movements. Investors closely track global political developments to manage this risk.
4. Regulatory and Compliance Risk
Each country has its own laws, financial regulations, tax structures, environmental rules, and trade policies. Companies operating internationally must comply with multiple legal frameworks, and sudden regulatory changes can bring financial losses.
Examples:
A country increasing import duty on electronics can hurt global manufacturers.
Sudden changes in foreign investment rules can impact multinational projects.
New data protection laws can affect IT and cloud-based businesses.
Regulatory risk requires businesses to stay updated with international laws and maintain strong compliance teams.
5. Interest Rate and Monetary Policy Risk
Central banks around the world, such as the US Federal Reserve, European Central Bank, RBI, or Bank of Japan, control interest rates and monetary policy. Their decisions directly impact global markets.
When interest rates rise:
Borrowing becomes expensive
Foreign investors move money to safer, higher-yield economies
Stocks and commodities may fall
When interest rates fall:
Markets often rally
Borrowing increases
Economic growth improves
International traders must monitor global central bank announcements because they influence currencies, bonds, equities, and commodities across the world.
6. Political Risk
Apart from wars or conflicts, routine political activities also influence global markets. These include:
Elections
Government instability
Policy changes
Nationalization of industries
Corruption or administrative inefficiency
Political uncertainty discourages foreign investment. A country with stable governance attracts more international capital, while a politically unstable regime increases risk.
7. Commodity Price Volatility Risk
Many countries rely heavily on global commodities such as crude oil, natural gas, gold, wheat, corn, copper, and more. Price fluctuations in these commodities affect economies, companies, and international trade.
For instance:
Rising oil prices hurt oil-importing countries like India.
Falling metal prices hurt metal exporters like Chile or Brazil.
Weather events (like El Niño) affect global food supply and prices.
Commodity risk is heavily influenced by global supply-demand trends, weather patterns, geopolitical events, and currency fluctuations.
8. Supply Chain and Logistics Risk
International trade depends on complex supply chains involving ports, ships, trucks, customs, warehouses, and multiple stakeholders. Any disruption can create massive financial losses.
Key supply chain risks include:
Pandemic-related lockdowns
Port congestion
Freight rate spikes
Strikes or labour shortages
Natural disasters
Cyberattacks on logistics systems
The COVID-19 pandemic highlighted the vulnerability of global supply chains, causing worldwide shortages of chips, medicines, and essential goods.
9. Technological and Cybersecurity Risk
The digital nature of global markets increases cybersecurity threats. Hackers, cyber-criminals, and state-sponsored attacks can disrupt banking systems, trading platforms, and corporate networks.
Risks include:
Data theft
Ransomware attacks
Online fraud
Trading system failures
Intellectual property theft
Companies trading globally must invest heavily in cybersecurity to protect sensitive data and maintain investor trust.
10. Cultural and Operational Risk
Operating in different countries means dealing with different cultures, languages, work ethics, and consumer behaviour. Misunderstanding local customs or market expectations can cause financial setbacks.
Examples:
Marketing strategies that work in the US may not work in Japan.
A product popular in Europe may not suit Indian tastes.
Local negotiation styles may differ widely from global norms.
Companies must adapt to local cultures through proper research, staffing, and training.
11. Credit and Payment Risk
When trading internationally, companies face credit risk because foreign buyers may delay payments, default, or go bankrupt. Cross-border legal recovery is often difficult and time-consuming.
This risk is managed through:
Letters of credit
Bank guarantees
Trade insurance
Advance payment agreements
But even with these measures, international transactions remain riskier than domestic ones.
12. Environmental and Climate Risk
Climate change and environmental laws increasingly affect international trade. Natural disasters disrupt transportation, production, and supply chains.
Examples:
Floods damaging manufacturing hubs
Heatwaves reducing agricultural output
Cyclones halting port operations
Environmental regulations also force companies to upgrade technology or pay penalties, adding to operational costs.
Conclusion
The international market offers enormous opportunities but also exposes participants to a wide range of risks—including currency fluctuations, geopolitical tensions, economic shocks, regulatory changes, and supply chain disruptions. Successful global investors or businesses must constantly monitor global trends, diversify exposures, use hedging tools, and maintain strong compliance and risk-management systems. Mastering these risks is essential to sustaining growth and profitability in a highly interconnected world.

BTC: The Optimal Trading OpportunityAs I have stated in my articles every day, BTC hitting the 90K level is the ideal buying opportunity, and my signals have been consistently indicating a buy. The market has once again validated my view, and we are now in profit. Keep holding your positions and close them when the price rallies.
All signals have been 100% accurate for two consecutive weeks. I’ll keep delivering precise signals — act fast to get yours now.

BTC/USDT🚀 Suggested Title: Check the Chart! Are the Buyers Still In, or Is It Time for a Deeper Correction?
Hey everyone!
This chart tells an interesting story. After the price successfully broke out of that small triangle pattern in the middle, it put in a great rally (strong upward movement).
Key Points Right Now:
Defense Zones: The price has dipped down twice and immediately picked up momentum again right on the key support levels (blue boxes and green arrows). This means buyers are still actively in the market and aren't letting the price drop easily.
Small Warning: That diagonal blue trendline that the price was moving within has been broken. This could be a sign that the current rally is getting tired, and we might be entering a phase of deeper correction.
What's Next?
Re-Acceleration: If the price can climb back above that broken trendline and hold the current support area, the flight upwards will continue.
Risk of Drop: If the current support is decisively broken and we establish a close below it, we should probably prepare for a deeper correction down to the lower blue box.
In Summary: The market is currently at a critical point. Pay close attention to how the price reacts to the current support levels. Take risk seriously! 😉

EcoByG Bitcoin Daily Analysis #9 / Daily BTC Market UpdateWelcome to My Analysis.
Now, let’s break down today’s Bitcoin structure.
Bitcoin is ranging with a weak bullish tilt
a higher low has formed, but the highs still haven’t broken.
The market is breathing before its next decision.
Let’s break it down.
Market Structure:
Range-Bound with a Weak Bullish Bias
Why?
A new Higher Low has formed compared to the 89.7K bottom.
But the highs are still unbroken, meaning a strong trend hasn’t emerged yet.
The market is mostly in a breathing phase before making its next decision.
Current Price Position
Price is trading exactly inside a key zone:
92,100 – 92,300
This zone has recently flipped into support (S/R Flip).
Multiple bounces from this region confirm its importance.
Price is currently above SMA 28 and SMA 58, → indicating a short-term positive momentum.
But it remains below SMA 99, → meaning the medium-term trend is still neutral to weak.
Volume Conditions
Strong buy volume at the bottom of the range shows solid demand.
But during upward moves, volume decreases → the bullish momentum is still weak.
To break through 92.9K, a volume spike is required.
Overall View
The market is moving inside a short-term range,
with a weak but existing bullish bias, though not confirmed yet.
Key Levels
Break above 93K → bullish continuation
Break below 91K → deeper correction
Main supports remain:
89.7K
The strong lower zone 88.8K – 88.3K
⚠️ Risk Alert ⚠️
Futures are not beginner-friendly. These triggers require solid experience.
Before using them, study risk management and practice with the learning content here.

DeGRAM | BTCUSD is forming an ascending wedge📊 Technical Analysis
● BTC/USD remains inside a broad descending structure, with price repeatedly rejecting the main resistance trendline. Multiple falling triangles and continuation patterns confirm sustained bearish control and lower highs across the 16H timeframe.
● The latest consolidation formed below trend resistance near 95,000–96,000, followed by rejection, signaling continuation risk toward the major demand zone around 84,000–82,000, where the long-term support line aligns.
💡 Fundamental Analysis
● Bitcoin faces pressure from tighter global liquidity conditions and cautious risk sentiment as markets reassess rate-cut expectations and ETF inflows lose momentum, keeping upside demand limited in the medium term.
✨ Summary
● Bearish bias below 96,000. Targets: 88,000 → 84,000. Key resistance: 100,000.
-------------------
Share your opinion in the comments and support the idea with a like. Thanks for your support!

Bitcoin Analysis |Last Attempt From the Buyers?
Hello to all my amazing traders!
Hope you’re doing great and starting your day strong! 🚀
Today, the Fear & Greed Index is at 29, still in the fear zone.
Yesterday we made a small push upward toward the end of the day, and now price is sitting around 92,960 — which is our risky long trigger.
Our main long trigger remains 93,600, but if price wants to break that zone, it will most likely break it with a big Marubozu candle.
Why?
Because there’s a huge amount of sell orders stacked in that region,
so if price wants to pass through, it probably will explode through it to liquidate shorts above the zone — meaning we won’t really get a nice 1H candle close to enter comfortably.
So this leaves us with two choices:
Option 1: Enter at 92,600
Higher chance of getting stopped out,
but almost zero chance of missing the move.
Option 2: Enter at 93,500
Lower chance of stop-loss compared to option 1,
but a much higher chance of missing the breakout.
As always, when I say I’ll enter above a certain level,
I wait for a 1-hour candle to close above that level before entering —
unless the move is clearly a breakout explosion.
🔥 Why I Think This Might Be the Buyers’ Last Push
I personally think this attempt might be the last strong effort from buyers.
Why?
Because if they try again and still fail to break the previous high,
then in this secondary uptrend, buyers failed to make higher highs and higher lows —
which tells us momentum is weakening.
That would strongly suggest our next real breakout is downward,
and since that aligns with the primary trend,
we can risk a bit more on short setups.
Two key levels I’ll trade myself:
📉 Short setups
Break of 89,178
If buyers attempt to break 93,600 but fail —
in that case, I’ll open shorts on altcoins that have a bearish BTC pair structure.
📈 Long setups
If we actually break 93,600,
I’ll still take the long —
but I’ll probably split my risk:
half on Bitcoin, half on a strong altcoin trend,
because BTC dominance isn’t showing a clear direction yet.
🎯 Final Note
As always — risk management first.
This market is still indecisive, and protecting capital is the #1 priority.
Thanks for reading my analysis —
I’m excited to see your comments! 🚀🔥

BTC After the Flush: Building a Base Into 2026Bitcoin printed a clear correction from the 126,333 spot top into 80,625, a 36% retrace that finally reset an overheated trend. After that impulse down, price stopped bleeding and started building a base. That is the context for my long, not a breakout chase.
My first entry triggered at 85,000. If price sweeps lower, I will add, with my final planned entry sitting in the 72,000 to 70,000 region. The whole idea is simple: scale into higher time frame demand after a deep reset, then let the market do the work if it wants to rotate back into risk.
Technicals: on the daily, the selloff created an obvious “damage candle” sequence, followed by compression and range behavior. I am treating the 80K to 85K band as the core demand zone. The level that matters for confirmation is the recovery of the mid range resistance around 94,652, because a clean reclaim would shift the structure from “bounce” to “reversal attempt” and opens the door for a move back into the 100K area and, eventually, a retest of the prior ATH zone near 126K if momentum returns.
Fundamentals : the macro backdrop is supportive for risk if financial conditions keep easing. The Fed has already moved policy lower and continues to guide the market with forward projections, which is the type of environment that can reprice duration and high beta assets.  At the same time, institutional crypto flows have been rebuilding. CoinShares reported a rebound in digital asset ETP inflows with Bitcoin leading, and daily US spot Bitcoin ETF flow data has also shown positive net flows on recent sessions.  On derivatives, CME positioning and open interest remain a key dashboard for whether this base is being built with size behind it. 
Execution note: I am not trying to “be right” on the exact bottom. I am trying to be positioned where the risk is definable and the upside is asymmetric. If the narrative changes, I will adjust. If the market gives the move, I will pay myself and protect capital.
Note: Please remember to adjust this trade idea according to your individual trading conditions, including position size, broker-specific price variations, and any relevant external factors. Every trader’s situation is unique, so it’s crucial to tailor your approach to your own risk tolerance and market environment.

BTC: Wait Patiently for the UptrendBTC has slipped into another consolidation phase and entered the buy zone. Simply hold your buy orders and wait patiently for the market to rally upward.
All signals have been 100% accurate for two consecutive weeks. I’ll keep delivering precise signals — act fast to get yours now.

Brainiak | Bitcoin begin the Impulsive move?Following the analysis made on December 10, Bitcoin was expected to have a continuation to the upside, with a key support zone around 89,000. The analysis was as follows:
“The price level that offers the highest probability for a bullish continuation is a pullback that does not go below 89,000. The key observation is that the decline must not occur with strong momentum in a V-shaped manner. Instead, the price should retrace slowly and gradually, which would indicate a high probability that this zone can hold as support.
The next level is around 86,000, which is still acceptable, but the market would likely start forming a sideways structure, increasing the chance that price may dip first before moving higher.
The final and least likely scenario is around 84,000. If price tests this area and fails to hold, followed by a breakdown, the market would likely need to move lower before any meaningful recovery.”
Price has since retraced and tested the 89,000 level as expected, followed by a strong and impulsive reaction to the upside. This price behavior significantly increases the probability that the previous corrective structure has indeed completed.
The next key level to monitor is 94,000. If price can successfully break and hold above this level, Bitcoin would have room to continue higher, with the next upside target around 97,000. However, as long as price fails to break 94,000, a pullback remains possible at any time in the short term.

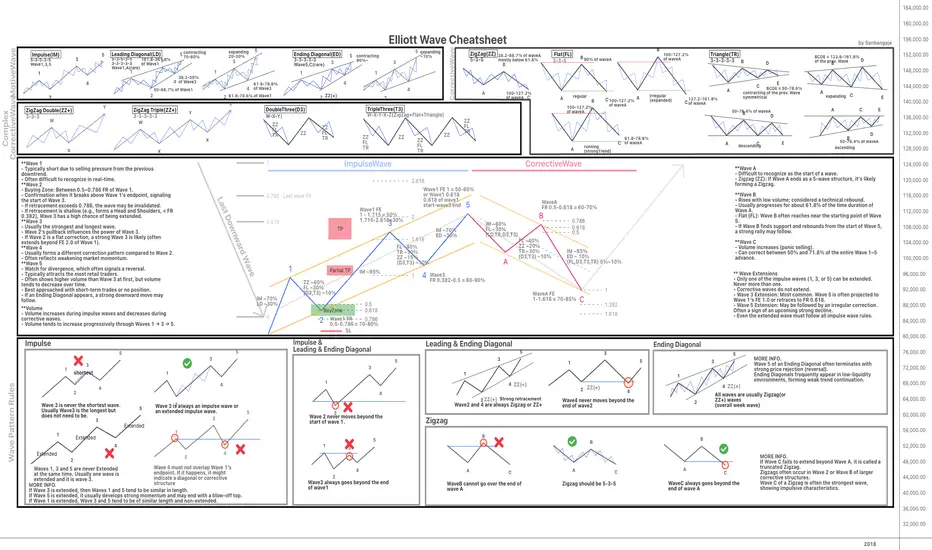
Elliott Wave Rules: Quick Cheatsheet for TradersHello everyone! I'm happy to share this Elliott Wave Cheat Sheet that I personally created during my journey. I hope this guide is helpful to the community.
This chart is designed to provide a quick, at-a-glance overview of the core Elliott Wave principles and patterns. Please note, it is just a summary of the main theories.
To dig into further and truly master the concepts, I highly recommend consulting the foundational texts:
* Elliott Wave Principle: Key to Market Behavior by A.J. Frost and Robert Prechter
* Mastering Elliott Wave by Glenn Neely
** Best viewed with QHD resolution (2560x1440)
** If the chart appears slightly squeezed vertically, you can adjust the aspect ratio by dragging the Price Panel (Y-axis) on the right side of the chart.**
**You can download the PNG version of this chart here:
drive.google.com
Happy Trading!
BTC accumulate shorts (WXY done)For the past weeks all BTC did was go down from 126k, from here we can hypothesize that we are on a wave to the downside and all move the upside are all corrective moves for another low to come.
We can see the W wave as an easy 5 subwave with X as 3 subwaves.
From here on there are 2 scenarios.
1. We are on the verge of the making of the huge wave 3 for a reversal of the trend
OR
2. Our Y wave ends with a truncated and we are ready for the next major wave to the downside.
Right now evidence show we are going for option 2. Why?
a.) Going into the orderflow, we have 25million longs TRAPPED on the high
b.) We have made a liquidity hunt on the last week's high.
c.) We tapped on the VAH of the last week of November
d.) All move to the high were made in a matter of minutes (a clear rejection)
The option 2 scenario will give more conviction if we lose
i.) 91,950 - pwVAH
ii.) 91,350 - pmPOC (MAJOR CONVICTION) if we lose this
All these idea will be defeated if we suddenly show strength here at the top
The only thing that I am to expect for my validation is a series of 4H closes above 93,600, it shows acceptance above value of the range
This idea is not made for a trade but as a guide to what to expect for the following days.

$BTC Update (Simple & To The Point)Prev updates still valid. All major timeframes are still bearish.
Right now, price is trading inside 12h and 4h bullish OB, but there is no strong momentum from this zone.
If 89.5k breaks down, next demand area is already marked on chart. Once price enters that zone, we have two bullish confluences:
1- SSL Sweep: Traders who bought because of bullish news have their stoplosses placed in this area around 75% of those SLs are in current zone, and remaining 25% are sitting in lower $$$ sweep zone.
2- Untested Bullish OB: There is also an untested bullish OB in the same zone, marked in green on the chart.
Bullish shift will only happen if CRYPTOCAP:BTC reclaims 94k zone, which is shown as red box on the chart.
Reminder: This analysis is shared against the trend.
Entire crypto market is risky at the moment so trade carefully and don’t FOMO into top buys just because of a small push.

Bitcoin is currently trading around the 38% Fibonacci level Bitcoin is currently trading around the 38% Fibonacci level at 90,196 after breaking down from the previous structure. The market failed to hold above the 23% level, showing weakness and confirming a bearish bias.
As long as price stays below 91,700, I expect a continuation to the downside.
Bearish targets:
First target: 88,975 — the 50% Fibonacci level
Second target: 87,754 — the 61.8% Fibonacci level and a strong liquidity zone
These levels align with market structure, breaker blocks, and the overall momentum shift.
The bullish scenario becomes valid only if Bitcoin closes above 91,700, which could open the way toward 92,400 and 94,148.
For now, momentum favors the downside."

BTCUSDT (2H) = QMR Reversal Setup Activated For BuyLiquidity swept. Structure shifted. Repricing underway.
Price ran the major sell-side liquidity around 87.0k, tapping a higher-timeframe demand zone.
That sweep triggered a QMR reversal model, confirmed by the clean break of structure around 92–93k.
We’re now repricing back into the OB + imbalance that sponsored the shift.
This area between 87.0k → 85.5k remains the key buy zone for continuation.
Invalidation: Below 85,5k - 84.0k
Targets:
• 96.2k
• 101.1k
• 105–106k liquidity cluster
Market already swept the downside; upside liquidity is now the draw.
— BolaXChange
Precision • Liquidity • Execution

A daily trading plan: stop trading your moodA daily trading plan: stop trading your mood and start trading your system
Most traders think they need a new strategy. In many cases they need a clear plan for the day.
Trading without a plan looks very similar across accounts. The platform opens, eyes lock onto a bright candle, the button gets pressed. Then another one. The mind explains everything with words like “intuition” or “feel for the market”, while the journal in the evening shows a pile of unrelated trades.
A daily plan does not turn trades into perfection. It removes chaos. The plan covers charts, risk, loss limits, number of trades and even the trader’s state. With that in place, the history starts to look like a series of experiments instead of casino slips.
Skeleton of a daily plan
A practical way is to split the day into five blocks:
market overview from higher timeframes
watchlist for the session
risk and limits
scenarios and entry checklist
post-session review
The exact form is flexible. The important part is to write it down instead of keeping it in memory.
Market overview: higher timeframe sets the background
The day starts on the higher chart, not on the one-minute screen. H4, D1 or even W1. That is where major swings, large reaction zones and clear impulses live.
A small template helps:
main asset of the day, for example BTC or an index
current phase: directional move or range
nearest areas where a larger player has strong reasons to act
Descriptions work best when they are concrete. Not “bullish market”, but “three higher lows in a row, shallow pullbacks, buyers defend local demand zones”. A month later these notes show how thinking about trend and risk evolved.
Watchlist: stop chasing every ticker
Next layer is a focused list of instruments. With less experience, a shorter list often works better. Two or three names are enough for the day.
Selection can rely on simple filters:
recent activity instead of a dead flat chart
structure that is readable rather than random noise
enough liquidity for clean entries and exits
Once the list is fixed, outside movement loses some emotional grip. Another coin can fly without you, yet the plan keeps attention on the few markets chosen for that day.
Risk and limits: protection from yourself
This block usually appears only after a painful streak. Until then the brain likes the story about “just this one time”.
Minimal set:
fixed percentage risk per trade
daily loss limit in R or percent
cap on number of trades
For example, 1% per trade, daily stop at minus 3R, maximum of 5 trades. When one of these lines is crossed, trading stops even if the chart shows a beautiful setup. That stop is not punishment. It is a guardrail.
Breaking such rules still happens. With written limits, each violation becomes visible in the journal instead of dissolving in memory.
Scenarios and entry checklist
After the bigger picture and limits are set, the plan moves to concrete scenarios. Clarity beats variety here.
For every instrument on the list, write one or two scenarios:
area where a decision on price is expected
direction of the planned trade
SEED_ALEXDRAYM_SHORTINTEREST2:TYPE of move: breakout, retest, bounce
[*stop and targets in R terms
Example: “ETHUSDT. H4 in an uptrend, H1 builds a range under resistance. Plan: long on breakout of the range, stop behind the opposite side, target 2–3R with partial exit on fresh high.”
An entry checklist keeps emotions in check.
$ trade goes with the higher-timeframe narrative
$ stop stands where the scenario breaks, not “somewhere safer”
$ position size matches the risk rules
$ trade is not revenge for a previous loss
If at least one line fails, entry is postponed. That small pause often saves the account from “just testing an idea”.
Post-session review: where real learning sits
The plan lives until the terminal closes. Then comes the review. Not a long essay, more like a short debrief.
Screenshots help a lot: entry, stop, exit marked on the chart, with a short note nearby.
was there a scenario beforehand
did the market behave close to the plan
which decisions looked strong
where emotions took over
Over several weeks, this archive turns into a mirror. Profitable setups repeat and form a core. Weak habits step into the light: size jumps after a loss, early exits on good trades, stop removal in the name of “room to breathe”.
Where indicators fit into this routine
None of this strictly requires complex tools. A clean chart and discipline already move the needle. Many traders still prefer to add indicators that highlight trend, zones, volatility and risk-to-reward, and ping them when price enters interesting regions. That kind of automation cuts down on routine work and makes it easier to follow the same checklist every day. The decision to trade still stays with the human, while indicators quietly handle part of the heavy lifting in the background.

EcoByG Bitcoin Daily Analysis #8 — Daily BTC Market UpdateWelcome to My Analysis.
Bitcoin just printed another lower high and slipped under key moving averages — the short-term structure is still bearish.
Let’s break down what the charts are actually saying.
Market Structure Overview
Overall Market Structure
The short-term market structure remains bearish.
Why?
Lower Highs formed at 92,800 → 92,300, along with moving-average breakdowns.
Lower Lows formed around 90,000, with a lower shadow reaching ~89,400.
After a strong sell-off, price has entered a small consolidation range, meaning the market is pausing after the drop.
Current Price Position
Price is sitting between two key support zones:
Support Zone 1: 89,750 – 90,000
Major Support Zone 2: 88,700 – 88,200
Price bounced from the top of the first support zone,
but there is no sign of a sustained reversal yet.
A key point:
After the strong decline, price fell below the 50 and 100 MAs and has failed to reclaim them.
This confirms sellers still have more control.
➤ Sellers
The drop from 92,200 came with large bearish candles and strong volume → clear selling pressure.
The recent crash candle had a long lower wick (some buying),
but the bounce candle had significantly lower volume than the sell candles.
➤ Buyers
Buyers defended the 89,700 level (long lower wicks).
But the bounce was weak and lacked conviction.
Buyers are only holding the floor, not reversing the trend.
📌 Conclusion:
Sellers currently have the upper hand; buyers are only defending, not attacking.
RSI (1H)
RSI has entered or approached the oversold area.
However, its upward reaction is weak.
This means:
Selling pressure has slowed (RSI rising slightly),
But there is no strength in the reversal (RSI still below mid-range, weak angle).
📌 Interpretation:
Expect range-bound movement or compression, not a fast bullish reversal.
✅ Final Summary
🔻 Current Trend: Short-Term Bearish
As long as price remains below 91,300, and especially below 92,000,
sellers stay in control.
🔸 Support Levels
First support: 89,700
Major support: 88,700 – 88,200
A breakdown → increases the probability of a sell-off toward 87,700.
🔸 Neutrality Trigger
A close back above 91,300 – 91,500 returns the market to a neutral state.
🔸 Bullish Trend Trigger
For a real shift to bullish structure → Bitcoin must reclaim 92,300.
⚠️ Risk Alert ⚠️
Futures are not beginner-friendly. These triggers require solid experience.
Before using them, study risk management and practice with the learning content here.

$BTC is hanging out on 4h & 12h bullish OB! CRYPTOCAP:BTC is hanging out on 4h & 12h bullish OB (demand zone)
Full detailed chart update coming later… but for now, sleep mode activated 😴
Stay connected.

$BTC: Price Action Saved Us! The only reason i told you not to top-buy was this. Yes, news was bullish 25 bps rate cut, but even then crypto market showed clear manipulation.
Real question is: how did we stay safe? And how did i know that top buying was risky?
Answer is very simple price action warned us trend was bearish and entire crypto market was sitting in a supply zone. Until trend shifts bullish, staying out is always the safer option. “Charts don’t lie” 💯
Alhamdulillah based on this, I gave you all an early alert so you wouldn’t top buy and end up selling low.

BTCUSDT SHORT📌 BTCUSD — Institutional Daily Analysis (MPI + ICT Framework)
(Professional Smart Money Market Breakdown)
1️⃣ Higher Timeframe Context
Bitcoin is currently trading inside a bearish dealing range:
Range High: 107,448 (Buy-side liquidity)
Range Low: 80,600 (Sell-side liquidity)
Within this range, price is in a retracement phase, not a reversal.
2️⃣ Market Structure (HH → LH → LL → MSS)
The structure confirms a bearish environment:
HH → LH → LL = bearish sequence
Liquidity sweep below
Internal swing high taken → MSS (Market Structure Shift)
This MSS indicates the start of retracement — not a trend reversal.
3️⃣ Internal Liquidity (94k–96k)
Price cleaned internal liquidity inside the 94k–96k range and confirmed
the internal dealing model (IDM).
This created the engine for a move into premium.
4️⃣ Premium Retracement Targets (FVG + OTE)
Institutional order flow suggests price will seek higher inefficiencies:
0.618 retracement: 97,190
0.705 OTE (Institutional Entry): 99,533
Daily FVG #1: 98k–100k
Daily FVG #2: 101k–103k
Possible sweep zone: ~100k
These are liquidity magnets before any major reversal.
5️⃣ Rejection Zone — Institutional Selling Area
A high-probability sell setup sits in the premium zone:
Daily FVG
0.705 OTE
Old support → new resistance
Breaker + inefficiency cluster
This area is the most likely region for a bearish rejection.
6️⃣ Higher Timeframe Draw-on-Liquidity
Once rejection occurs, institutional flow favors lower targets:
TP1: 80,600 (Range Low)
TP2: 76,000 (HTF imbalance)
TP3: 72,300 (Weekly EQ Low – March 2024)
Sell-side liquidity zone: 72k–76k
This zone is the long-term liquidity objective.
7️⃣ Summary
📉 Trend remains bearish
📈 Current move = retracement into premium, not reversal
🎯 Premium zone (98k–103k) = institutional sell area
🔥 Long-term targets: 72k–76k sell-side liquidity
This structure follows the classic ICT + MPI roadmap:
Sweep → MSS → Retracement → Premium → Rejection → Expansion Lower

#BTC Global analysis of BTC. Correction and decline to 65kBYBIT:BTCUSDT
BYBIT:BTCUSDT.P
COINBASE:BTCUSD
Bitcoin is currently in an uncertain phase for everyone, so I have analyzed the most likely outcome of the price movement in my opinion.
On D1, we see a downtrend and a reaction from support levels. As a result, Bitcoin corrected to the 0.5 Fibonacci level, after which it did not reverse the trend but continued to test the 0.5 level.
The trend short line on H8-D1 was broken after several serious touches, and now I am waiting for a retest from the 0.618 Fibonacci level and a further correction to 98500-100000, where the 0.618 and 0.702 Fibonacci levels are also located.
This is a serious resistance level for the price and the place where the structure (BOS) was broken. The price usually returns to this place for further movement along the trend.
I expect this scenario, as I have not noticed that the main cryptocurrency has gathered enough liquidity to update its highs and a global long scenario.
At levels 98500 - 100000, I expect a short scenario to levels 65000 - 75000.
From there, Bitcoin will likely delight us with a long-term outlook and attract a large number of investors.
In addition to this, it is known that a large number of investors hold stablecoins and are ready to buy Bitcoin. Until this happens, we can assume that investors and funds are waiting for a suitable favorable price for the main asset.
