BITCOIN → False breakout of resistance on a downtrend BINANCE:BTCUSDT is consolidating in the range of 86K - 92K, bears are holding resistance amid a global downtrend, traders lack drivers...
Fundamentally, sentiment in the crypto market is weak, and there is increasing talk of a crypto winter, especially among companies that previously actively bought cryptocurrencies for their balance sheets. There is no bullish driver at the moment.
Bitcoin is in a neutral state, with the market holding the price below 93K. The fundamental background is unstable, and technically, the market is in a downtrend. A reversal pattern is forming relative to 92K, and a retest and false breakout of the zone of interest could trigger a decline to the support range.
Locally, we are seeing an upward channel, but this is a correction against the backdrop of the global trend. If the bears keep the price below 92K, the decline may continue. However, a breakout of 94K and a close above that level could trigger an upward momentum...
Resistance levels: 91850, 92700, 93700
Support levels: 88000, 86300
A false breakout and price consolidation in the short zone could cause further sell-offs towards the areas of interest located at the bottom of the trading range.
Best regards, R. Linda!
Trade ideas

BTC Pullback: Buying 50-78.6% Discount LevelsAfter the aggressive internal liquidity grab on December 1st, which subsequently manifested as a Daily Bullish Order Block , Bitcoin continued its local bullish structure from the global 78.6% level, which I analyzed in my global overview: Bitcoin: The ATH Was a Trap. Here's the Real Roadmap.
Currently, the asset is correcting on the 4H structure and has reached the top of the Order Block. However, to obtain a better Risk/Reward (RR) in the trade and for general entry feasibility, I always wait for a more favorable price in the Discount Zone , which is located below the 50% Fib level.
No one can know exactly how deep Smart Money needs to return the asset into the manipulation zone to close losing positions used to execute this aggressive liquidity grab. Therefore, I will consider a reversal reaction from each level: 50%, 61.8%, and 78.6% .
✅ Entry Conditions:
The condition for entry will be reaching one of these levels, price finding acceptance above it, and the initiation of bullish order flow on a lower timeframe (1m-5m).
❌ Invalidation:
The invalidation of the long scenario will be a break of the local 78.6% level . In that case, the Bitcoin reversal from the global 78.6% level in continuation of the global uptrend will be in question, though still possible, as this is a level from the highest timeframe, and the second monthly candle could also close with its body above this level.
🎯 Target:
The minimum target in case of a long setup formation from the Discount Zone will be the SUPPLY zone . To confirm that the bull cycle is not over and the asset can potentially form a new ATH, it will first have to overcome this resistance zone.
~~~~~~~~~~~~~~~~~~~~~~~~~~~~~~~~~~~~~~~~~~~~~~~~~~~~~~~~~~~~~~~~~
The principles and conditions for forming the manipulation zones I show in this trade idea are detailed in my educational publication, which was chosen by TradingView for the "Editor's Picks" category and received a huge amount of positive feedback from this insightful trading community. To better understand the logic I've used here and the general principles of price movement in most markets from the perspective of institutional capital, I highly recommend checking out this guide if you haven't already. 👇
P.S. This is not a prediction of the exact price direction. It is a description of high-probability setups that become valid only if specific conditions are met when the price reaches the marked POI. If the conditions are not met, the setups are invalid. No setup has a 100% success rate, so if you decide to use this trade idea, always apply a stop-loss and proper risk management. Trade smart.
~~~~~~~~~~~~~~~~~~~~~~~~~~~~~~~~~~~~~~~~~~~~~~~~~~~~~~~~~~~~~~~~~
If you found this analysis helpful, support it with a Boost! 🚀
Have a question or your own view on this idea? Share it in the comments. 💬
► Follow me on TradingView for timely updates on THIS idea (entry, targets & live trade management) and not to miss my next detailed breakdown.
~~~~~~~~~~~~~~~~~~~~~~~~~~~~~~~~~~~~~~~~~~~~~~~~~~~~~~~~~~~~~~~~~

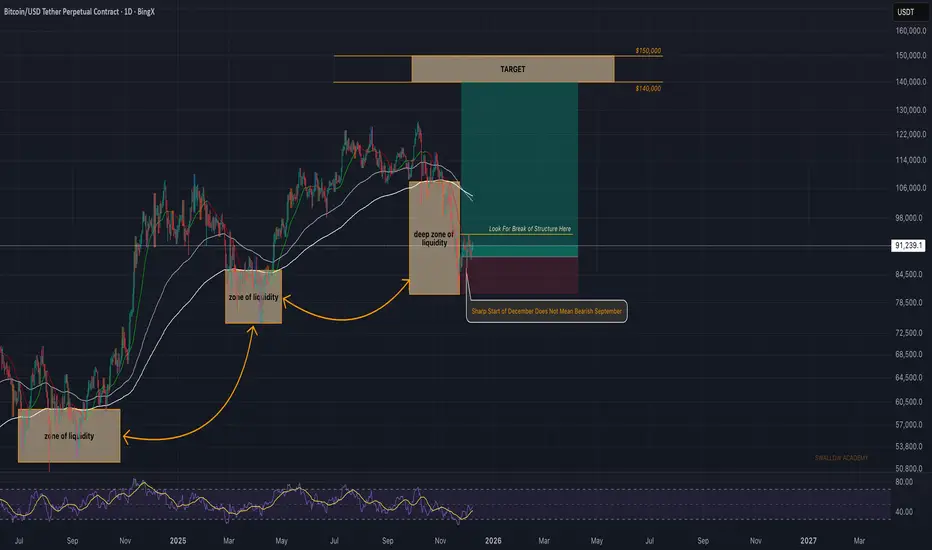
Bitcoin (BTC): All We Need Now Is Break of StructureBitcoin is accumulating currently where price is heading most likely for a break of structure (Which would confirm our bullish gameplan). As soon as we see the breakout we will be looking for a long position right there!
Swallow Academy
BITCOIN → Downward trend pressure. 86K - 84K?BINANCE:BTCUSDT.P sold off all the gains associated with Tuesday and Wednesday's news. Technically, a false breakout of resistance is forming against the backdrop of a downtrend. There is no fundamental support.
Bitcoin failed to consolidate above 91800 - 94200, a false breakout was formed, and the price returned to the range. There is an imbalance zone on the chart, which the price may test before falling (weak technical and fundamental background).
The trend is downward in the medium term. A countertrend correction is forming, within which the market is facing pressure in the 94K - 95K zone. Zone of interest is 91850. I expect a retest, liquidity capture, and another phase of selling down to 88K - 86K.
Resistance levels: 91850, 92500
Support levels: 89550, 87980, 86260
The price is in the trading range of 84K - 94K. Resistance has been tested, and a double top reversal pattern has formed. Currently, a distribution phase is forming relative to the specified pattern and consolidation at 91850 - 94200. A retest of the nearest resistance could trigger a rebound and cause the price to fall further to the next zone of interest.
Best regards, R. Linda!

BTC 1H LIQUIDITY CYCLE MODEL SELL SETUP LOADINGBitcoin has completed a clean downside impulse and is now trading inside a corrective structure that fits perfectly into my Liquidity Cycle Model (LCM).
Here’s the breakdown:
🔹 1. Impulse Down — Confirmed
Strong bearish displacement created the foundation for LCM Phase 1. Sellers are clearly active on the HTF.
🔹 2. Correction Into Supply — Confirmed
Price has retraced into a multi-layered supply zone, aligning with:
• 90,666
• 91,069
• 92,202
• 92,305
These levels represent inefficiencies + old liquidity, making this the ideal correction zone.
🔹 3. Liquidity Sweep — Developing
Price has started reacting inside the zone, but the clean sweep of remaining liquidity (91.0–92.3 region) may still happen.
If we get that final sweep → I expect a strong bearish reaction.
🔹 4. Reversal Trigger — Waiting
I need a decisive BOS (Break of Structure) down on LTF to confirm the reversal.
Until BOS prints, this remains a potential LCM sell, not an active one.
🔹 5. Sell Continuation — After BOS
If reversal confirms:
• First continuation zone: 90,218
• Break zone: 89,467
• Major inefficiency target: 82,292
The downside potential is huge if sellers fully take over.
✅ My Bias:
Bearish, but only after a clean BOS.
The model is forming beautifully — sweep the highs, break structure, and the continuation sell becomes high probability.
🧠 LCM Logic
Impulse → Correction → Liquidity Sweep → Reversal → Continuation
BTC is currently between Correction and Sweep, preparing for the Reversal → Sell leg.
⚠️ Key Note:
No confirmation = no entry.
Let price show its hand. LCM rewards patience, not prediction.

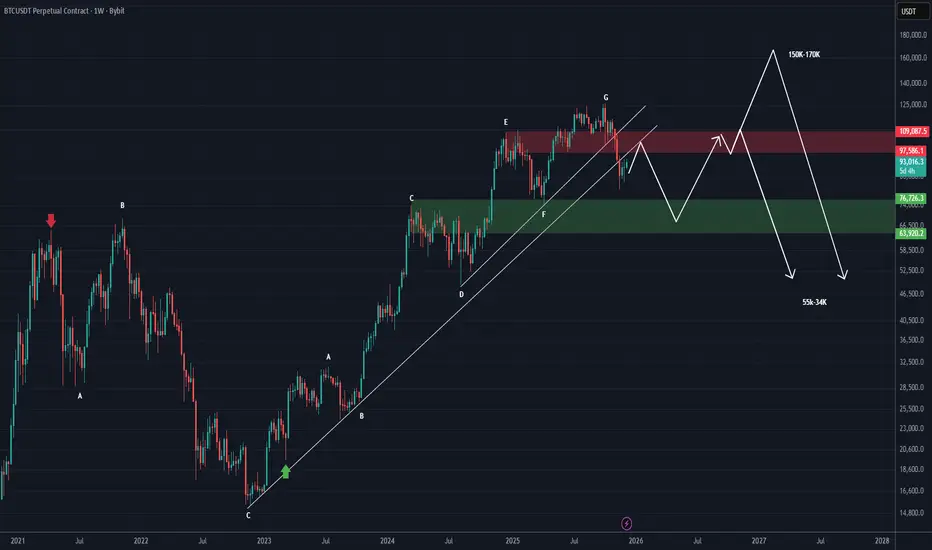
Bitcoin RoadMap (1W) | Important UpdateIt’s better to first have a complete roadmap for Bitcoin for the coming months.
We have cleaned up the chart as much as possible, making the pattern lines and range zones invisible so the chart remains uncluttered.
As you can see, Bitcoin is trading below the upward trendlines and also below the FLIP zone.
It is expected that the price will be rejected from the red zone down toward the 76K to 64K range, and then from that area it may attempt a move toward higher levels.
If the red zone is broken, the price could reach the 150K to 170K area. However, if it fails to hold above the red zone, it may drop to the 55K range and even 27K, potentially starting a bearish cycle.
This is the condition for Bitcoin | it should not be compared with altcoins, and many altcoins may even become bullish while Bitcoin is in a bearish cycle!
For risk management, please don't forget stop loss and capital management
When we reach the first target, save some profit and then change the stop to entry
Comment if you have any questions
Thank You
Bitcoin Trading range between two Points Resistance or Support Bitcoin Price is currently fluctuating within a defined range between 92k and 89K. The highlighted zone shows a period of consolidation with both bullish and bearish reactions inside the range.
Technically Bitcoin is maintaining its position inside this channel, but the overall structure is leaning bearish as price repeatedly tests the lower boundaries focus on the key levels, price may decline deeper toward the next major support areas at 87K and possibly 85K
If price holds above 90K a bullish rebound is possible, with potential upside targets at and 93K further at the upper channel level near 95k bullish scenario, where price bounces upward and breaks the upper region of the range, rising toward the marked targets.
If the price reacts to the bearish side where price fails to hold above support and follows a downward continuation downside then support level would be 87K to 85K,
You may find more details in the chart,
Trade wisely best of luck buddies.
Ps; Support with like and comments for better analysis thanks for supporting.

Bitcoin - Can the ascending triangle be broken?Introduction
Bitcoin is currently consolidating within a well-defined structure after weeks of volatile movement. Despite several failed attempts to break higher, the market continues to compress just beneath a major resistance zone. This type of tightening price action often signals a larger move approaching, as liquidity begins to build on both sides of the range. The chart highlights two key elements that will likely determine BTC’s next direction: the ascending triangle formation and the liquidity level resting below current price. Understanding how price reacts to these areas will be essential for anticipating the next significant impulse.
Ascending Triangle
BTC is forming an ascending triangle pattern, characterized by rising lows meeting a relatively horizontal zone of resistance. This resistance band, highlighted on the chart, has repeatedly capped upward attempts. Each time BTC pushes into the zone, it is met with selling pressure, but the higher lows reveal that buyers are steadily gaining ground. This pattern typically suggests accumulation and a potential bullish breakout once enough pressure builds.
If BTC can break above the upper boundary of this triangle with strength and volume, the move would likely target higher liquidity pools above recent highs. Such a breakout often leads to an impulsive leg upward, as trapped short positions are forced to cover and momentum buyers join in. For now, the ascending trendline remains a key structural support that defines the bullish side of this pattern.
Liquidity Level
Below the current range lies a clear liquidity zone, created by a cluster of equal lows and untested downside levels. This area is marked on the chart and represents where stop-loss orders and resting liquidity are likely positioned. Markets often revisit such zones before making a decisive breakout, particularly in triangle structures where liquidity builds on both sides.
A sweep of this liquidity, combined with a tap into the ascending trendline, would be a textbook setup for buyers to step back in. If BTC dips into this zone and rebounds strongly, it would further strengthen the market structure and increase the likelihood that the eventual breakout takes place to the upside. However, if this liquidity level fails and price breaks below the trendline, the bullish structure would be invalidated, opening the door for a deeper move down.
Final Thoughts
BTC is approaching a decision point, with price tightening inside an ascending triangle while liquidity pools gather below. As long as the ascending trendline continues to act as support, the market maintains a bullish bias, and a breakout above the resistance zone becomes increasingly likely. Still, a liquidity sweep to the downside before any major rally remains a strong possibility. Traders should pay close attention to how BTC reacts if it dips into the liquidity zone, as this response will reveal whether buyers are prepared to defend the structure. A clean breakout above the resistance band would confirm the next bullish leg, while a breakdown below the ascending trendline would signal weakness and shift the outlook.

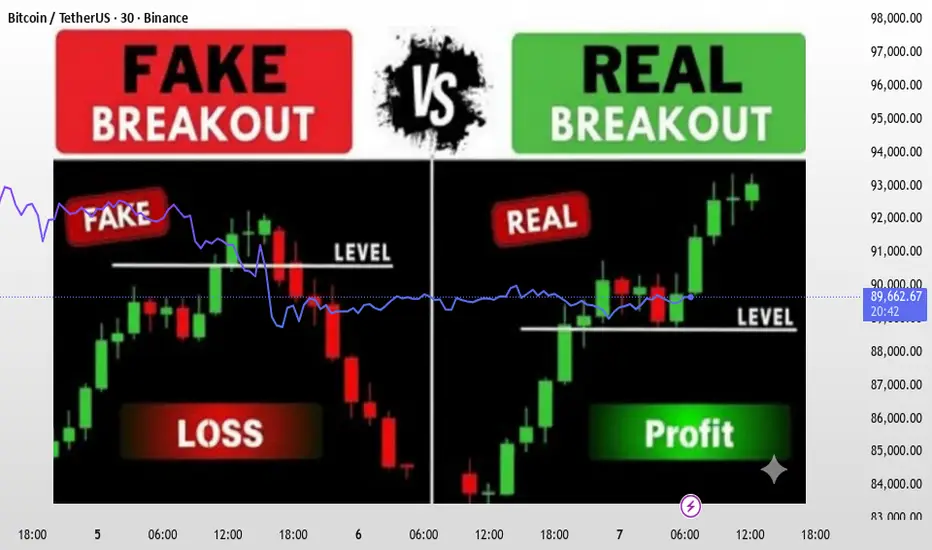
Breakout vs Fakeout – How to Identify the DifferenceBreakout vs Fakeout — The Complete Professional Guide
How Smart Money Creates Traps & How Traders Can Avoid Them
Breakouts and fakeouts are among the most misunderstood events in trading. Many traders enter too early, get trapped, and watch price reverse exactly after their entry. This educational idea explains, in depth, how institutions create fakeouts, how real breakouts are structured, and how you can confirm the difference using pure price action.
---
🔹 Understanding Market Behavior Behind Breakouts
Markets move from accumulation → manipulation → expansion.
The breakout or fakeout usually happens during the manipulation phase.
Smart Money (SMC) concepts play a major role here:
- Market builds liquidity above equal highs & below equal lows.
- Traders place buy stops or sell stops near key zones.
- Institutions trigger these stops to fill large orders.
- Only after trapping liquidity does the real move begin.
So before analysing a breakout, always ask:
👉 Who needs liquidity here — retail or institutions?
---
🔹 What Makes a Breakout Real?
A real breakout is not just a wick or a temporary push. It is a structural shift backed by momentum and confirmation.
✅ 1. Strong Candles With Clear Body Closes
A real breakout has wide-body candles closing decisively above resistance or below support.
Weak candles = weak intention.
✅ 2. Break + Retest + Continuation
The strongest breakouts follow this pattern:
1. Price breaks the level
2. Comes back for a clean retest
3. Holds structure
4. Forms a continuation pattern
This retest phase filters 70–80% of fakeouts.
✅ 3. Market Structure Shift (MSS / BOS)
For a bullish breakout:
- Price creates Higher Highs (HH) and Higher Lows (HL)
For bearish breakout:
- Price creates Lower Lows (LL) and Lower Highs (LH)
A breakout without structure change is not reliable.
✅ 4. Volume & Volatility Expansion
Breakouts must show an increase in:
- Volatility
- Candle size
- Trading activity
If volume remains flat, the breakout may fail.
---
🔹 How to Spot a Fakeout Before It Traps You
Fakeouts are intentional liquidity grabs. Here are the strongest warning signs:
❌ 1. Break Happens With Weak Candles
Small bodies, long wicks, hesitation candles — all indicate uncertainty.
❌ 2. Price Fails to Close Outside the Zone
This is the #1 rule:
If price does not close outside resistance/support, it is most likely a fakeout.
❌ 3. Instant Rejection Back Into the Range
If price breaks the level and immediately returns inside, institutions are hunting stops.
❌ 4. No Retest — Just a Sharp Reverse
Real breakouts retest.
Fakeouts don’t.
They reverse fast because their only purpose was liquidity collection.
❌ 5. Presence of Equal Highs / Equal Lows
When the market forms equal highs/lows, it signals liquidity pools.
Fakeouts usually occur right above/below these areas.
---
🔹 Advanced Confirmation Technique (Institutional Logic)
Here’s a professional-level method used by SMC traders:
1. Identify the liquidity zone (EQ highs/lows)
These serve as targets for traps.
2. Wait for the first breakout
Do not enter here.
3. Look for the rejection candle
A “fakeout candle” usually has:
- Long wick
- Small body
- Closes back inside the structure
4. Wait for BOS (Break of Structure)
Once price reverses and breaks an internal structure, the fakeout is confirmed.
5. Enter on the retest of the trap zone
This is the safest and most profitable entry.
---
🔹 Practical Example (General)
Let’s say Gold is ranging between $2400 - $2420.
- Price spikes above $2420, hits stops, and forms a long-wick candle
- The breakout candle fails to close above resistance
- Price immediately drops back inside the range
- Internal structure breaks → fakeout confirmed
- Retest of $2420 becomes the ideal sell entry
This exact behavior happens in XAUUSD almost daily.
---
🧠 Final Professional Tip
Breakouts are easy to trade once you stop trying to predict them.
Let the market show you:
- Strong close
- Clear retest
- Momentum
- Structural break
And avoid all entries based only on a wick touching resistance or support.
Patience is the difference between a trapped trader and a profitable trader.
Your boosts, comments, and likes motivate me to share more accurate analyses like this.
👉 If you found this helpful, please Boost the idea and leave a comment — it really helps!
— JT_CHARTsMaster
Bitcoin (BTC): Bounce From 100EMA | Respecting The ZoneBTC looks very bullish, especially with the recent bounce we had on 100EMA. The zone has been once again respected and now we are looking for further movement to upper zones.
We are keeping this gameplan until the March, that's about the max lenght we expect the markets to push, after that we should see the start of bear market.
Swallow Academy

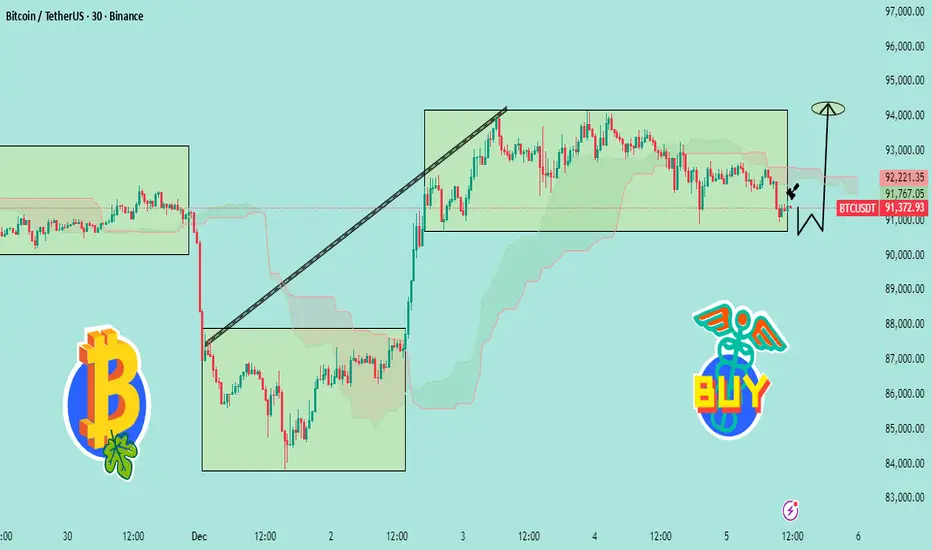
“BTC Bounce From Demand Zone – Targeting 94K Next📊 BTCUSDT Analysis (Based on Your Chart)
1️⃣ Price is Still Respecting the Range
Bitcoin is trading inside a wide consolidation box (around 91,000 – 93,000).
The recent drop tapped the bottom of the range, showing a clean liquidity sweep.
That wick below the box = fake breakdown → bullish signal.
---
2️⃣ Strong Reaction at Demand Zone
The chart shows BTC touching the demand/support zone, followed by a small bullish reaction (the black arrow).
This suggests:
Sellers failed to break lower
Buyers are stepping in exactly where expected
Market preparing for a reversal bounce
---
3️⃣ Expected Move (Your W Pattern Idea)
The drawn “W-shape” indicates a double bottom setup.
If the bottom holds around 91,000, BTC can push back toward:
🎯 Target: 93,500 – 94,000
This matches the upper boundary of the consolidation.
---
4️⃣ Bullish Scenario
If BTC holds above 91,000–91,300:
Reclaim mid-range
Break through resistance
Continue toward 94,000+
This aligns with the “BUY” tag you added.
---
5️⃣ Bearish Invalidations
Bullish idea is invalid if: ❌ Price closes below 90,800 on 30-minute
= fresh breakdown → deeper correction
---
🧠 Summary
BTC swept liquidity at the support → formed a bounce → still inside range → bullish reversal expected toward 94K
Indecision on the Chart: What These Candles Really MeanIndecision in the market? You're not alone. Every trader has faced those moments when the charts seem to scream confusion. But here's the thing: indecision candlestick patterns aren't just noise. They hold secrets that, when decoded, can give you the upper hand. Let's dive in and learn how to spot these patterns and use them to your advantage.
Mastering Indecision Candlestick Patterns
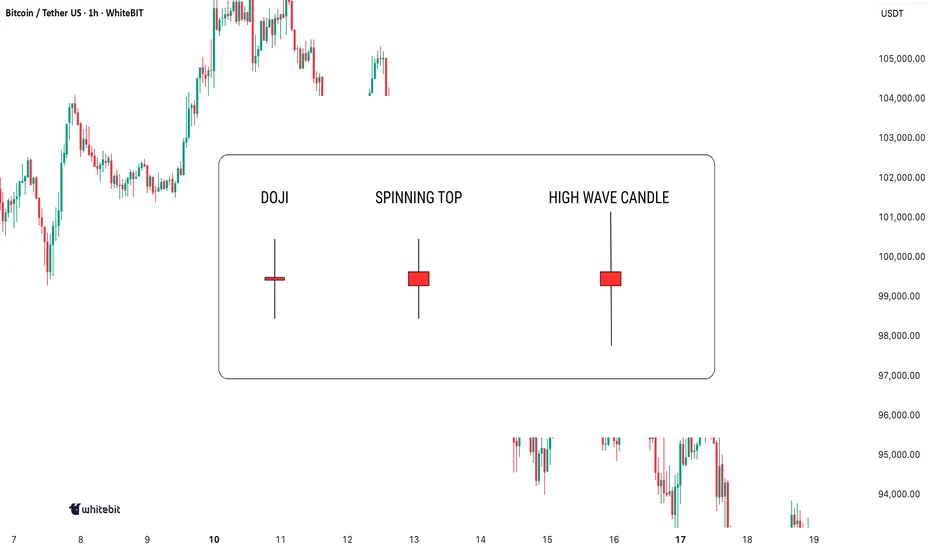
The most well-known indecision candles are the Doji, Spinning Top, and High Wave Candle. These candlesticks might seem tricky at first, but once you learn to recognize them and understand their context, they can serve as valuable tools in your trading strategy.
Doji
A Doji has a small body with nearly identical open and close prices, and long upper and lower wicks, indicating market indecision—neither buyers nor sellers gain control during that period.
When to look for confirmation: A Doji alone isn’t enough to trade. Wait for confirmation from the next candle: a bearish one after an uptrend may signal a reversal, while a bullish one after a downtrend might indicate the start of a rally.
Spinning Top
A Spinning Top is an indecision candle with a small body and longer upper and lower shadows. It indicates uncertainty, with more volatility than a Doji.
When to look for confirmation: A Spinning Top is more meaningful after a strong trend. Following an uptrend, it could signal weakening momentum. Wait for the next few candles to confirm the market’s direction.
High Wave Candle
The High Wave Candle is like the Spinning Top but with even longer wicks. It shows high volatility with no clear direction, as the price fluctuates widely but the open and close remain close, indicating indecision.
When to look for confirmation: Use the High Wave Candle with trend analysis. If it appears during consolidation or after a major move, it may signal a breakout. As with other indecision candles, wait for confirmation before acting.
Combining Indecision Candles with Indicators
While indecision candle patterns can provide useful insights, they are most effective when combined with other technical indicators. Here are some ways to use them in combination:
Moving Averages: Use moving averages (like the 50-period or 200-period) as a trend filter. If a Doji or Spinning Top forms above a moving average and the next candle confirms a reversal, it may signal trend continuation.
Relative Strength Index (RSI) : If an indecision candle forms when RSI is at extreme levels (above 70 or below 30), it may signal an upcoming pullback or reversal.
Volume: A high-volume candle following an indecision candlestick often confirms strong follow-through. Without volume, these patterns may be less reliable.
Where to Avoid Using Indecision Candles
While indecision candles are useful, there are some scenarios where relying on them without confirmation can be misleading:
Choppy Markets: Indecision candles appear frequently and may not signal real reversals.
During News Events: Sharp price spikes can create false indecision signals.
Lack of Context: A Doji in sideways price action has less significance than one after a strong trend.
Indecision candles signal uncertainty, but don’t act on them blindly. Always combine them with other analysis and make decisions based on your own judgment!
btcusdtBased on the strong support visible on the weekly timeframe, Bitcoin has the potential for a bullish rebound from the current levels. If upward momentum develops, the corrective move may extend toward the 108K–110K region, which represents the first major resistance ahead.
Should buyers gain enough strength to break through this area — which aligns with the midline of the ascending channel — the next upside targets would be around 116K, and potentially a retest of the previous high. However, continuation toward these levels would require a solid bullish catalyst or positive news, which currently isn’t evident.
For now, the primary short-term scenario remains a move toward 108K–110K, followed by reassessment.

BTCUSDT Long: Demand Strength Holds - Market Eyes 93,8K BreakoutHello, traders! The current BTCUSDT price action shows a constructive bullish structure as the market continues to respect the key Demand Zone and the rising Trend Line. After a series of reactions around demand, buyers have repeatedly defended this area, preventing further downside and maintaining the integrity of the broader upward trajectory. Earlier, the market traded inside a corrective Range, showing temporary consolidation before buyers stepped back in and pushed price away from the lower boundary. Even though BTCUSDT faced strong rejection from the Supply Zone near 93,800, the recent pullback retraced directly into a high-value demand region, where the Trend Line and horizontal support intersect. This confluence has already triggered bullish reactions in the past, signaling that buyers remain active and prepared to protect the current market structure. The presence of multiple breakout attempts and higher lows highlights sustained interest from long-side participants.
Currently, BTCUSDT is testing the Demand Zone again, holding firmly above the Trend Line while forming a potential launch point for another upward impulse. As long as buyers maintain control over this level, the market structure favors a continuation toward the upper Supply Zone at 93,800, which remains the primary upside target. A clean bullish move from demand would confirm continuation of the prevailing trend.
My scenario as long as price stays above the Demand Zone and respects the rising Trend Line, the expectation is for BTCUSDT to move higher toward the 93,800 Supply Zone. A strong reaction from demand could initiate a new bullish leg, and a confirmed breakout above 93,800 would open the path for further upside expansion. However, a decisive break below demand would invalidate this long scenario and signal deeper correction. Manage your risk!

Bitcoin Momentum Building — Bullish Plan Activated!BTC/USDT — “BITCOIN VS TETHER”
Crypto Market Opportunity Blueprint (DAY / SWING Trade) 💹✨
🔥 Plan: Bullish plan confirmed
The structure is supported by a Hull Moving Average (HMA) pullback, behaving like a clean re-accumulation phase — showing buyers quietly loading before the next expansion wave.
This pattern typically appears before trend continuation legs, especially when volatility compresses after a strong impulse.
🎯 Entry
📌 YOU CAN ENTRY AT ANY PRICE LEVEL
(Structure shows strength across multiple levels with buyers defending dips.)
🛡️ Stop Loss
⚠️ This is thief SL @ 86000
Dear Ladies & Gentleman (Thief OG's), adjust your SL based on your own strategy & personal risk tolerance.
🔍 Important:
I am not recommending to use only my SL.
It's your own choice — you can make money then take money based on your own risk.
🎯 Target
Price is moving into a zone where the moving averages act as a strong resistance, combined with overbought conditions and potential trap formation, so escaping with profits is wise.
📌 Our target @ 98000
Again — Dear Ladies & Gentleman (Thief OG's):
I am not recommending to set only my TP.
You can make money then take money at your own risk.
📡 Related Pairs to Watch (Correlations & Key Behaviors)
Below are correlated assets that help confirm BTC/USDT’s flow, momentum, and broader crypto market direction. These are presented in $ format for TradingView tagging.
1️⃣ BINANCE:ETHUSDT (Ethereum)
Strongest beta-pair to Bitcoin.
When BTC shows re-accumulation, ETH often leads the breakout earlier.
If ETH breaks major resistance first → increases confidence in BTC continuation.
2️⃣ BINANCE:SOLUSDT (Solana)
High-momentum asset; reacts faster than BTC.
If SOL pumps aggressively while BTC consolidates → indicates risk-on sentiment across crypto.
Good for measuring market confidence.
3️⃣ BINANCE:BNBUSDT (BNB)
Acts as a market stability indicator.
If BNB stays firm above key moving averages, liquidity remains strong across the crypto market.
Helps confirm medium-term bullish structure.
4️⃣ BINANCE:ETHBTC (Ethereum / Bitcoin Ratio)
A critical relative-strength indicator.
If ETHBTC drops → capital rotates into BTC dominance, supporting your Bitcoin bullish plan.
If ETHBTC rises → broad alts strength, but BTC may not accelerate instantly.
5️⃣ CRYPTOCAP:TOTAL2 (Altcoin Market Cap)
When TOTAL2 rises with BTC → marketwide confidence.
When TOTAL2 stagnates but BTC rises → BTC-only rally (typical before big breakouts).
Useful to detect inflow distribution.
6️⃣ TVC:DXY (US Dollar Index)
Inverse correlation with Bitcoin.
If DXY weakens → supports BTC bullish continuation.
Important for swing traders taking multi-day positions.
7️⃣ CRYPTOCAP:USDT.D (Tether Dominance)
When USDT.D drops → money flowing from stablecoins into crypto.
When USDT.D rises → risk aversion.
Perfect tool for confirming if BTC demand is real.
📈 Summary Insight
Together, BTC’s HMA pullback + re-accumulation structure, rising momentum across correlated pairs, and declining defensive indicators build a high-probability bullish continuation environment for the next expansion wave.

Reading market regime: trend, range or chaos on a single chartReading market regime: trend, range or chaos on a single chart
Many traders treat every chart the same. Same setup, same stop, same expectations. Then one week the pattern works, the next week it bleeds the account.
In practice, the pattern rarely is the real problem. The problem is that the same pattern behaves differently in different market regimes.
First read the regime. Then trust the pattern.
This article focuses on a simple way to classify any chart into three regimes and adjust entries, stops and targets to match the environment.
What “market regime” really means
Forget academic definitions. For a discretionary trader, market regime is simply how price usually behaves on this chart in the recent swings.
A practical split into three buckets:
Trend: price prints higher highs and higher lows, or lower highs and lower lows. Pullbacks respect moving averages or previous structure. Breakouts tend to continue.
Range: price bounces between clear support and resistance. False breaks are frequent. Mean reversion works better than breakouts.
Chaos: candles with long wicks, overlapping bodies, fake breaks in both directions, no clear structure. Liquidity is patchy, stop hunts are common.
The goal is not perfect classification. The goal is to avoid trading a “trend playbook” in a chaotic zone and a “range playbook” in a strong trend.
Three quick checks for any chart
Before opening a trade, run three very simple checks on the last 50–100 candles.
1. Direction of swings
Mark the last 3–5 swing highs and lows with your eyes.
If highs and lows step clearly in one direction, you have a trend.
If highs and lows repeat in the same zones, you have a range.
If swings are messy and overlap, you are closer to chaos.
2. How price reacts to levels
Pick obvious zones that price touched several times.
Clean tests with clear rejection and follow through support the range idea.
Small pauses and then continuation support the trend idea.
Spikes through levels with no follow through point to chaos.
3. Noise inside candles
Look at wicks and bodies.
Moderate wicks and healthy bodies often belong to a stable trend.
Many doji-like candles and long wicks on both sides are classic noisy conditions.
After these three checks, label the chart in your journal: trend, range or chaos. Do not overthink it. One clear label is enough for each trade.
How to adapt the trade to the regime
Same signal, different execution.
Trend regime
Direction: trade only with the main direction of recent swings.
Entry: focus on pullbacks into previous structure or into dynamic zones like moving averages, not on chasing the breakout spike.
Stop: behind the last swing or behind the structure that invalidates the trend.
Target: allow more distance, at least 2R and more while the trend structure holds.
Range regime
Direction: buy near support, sell near resistance. Ignore mid-range.
Entry: wait for rejection from the edge of the range. Wick rejection or failed breakout is often better than a blind limit order.
Stop: behind the range boundary, where the range idea clearly dies.
Target: either the opposite side of the range or a “safe middle” if volatility is low.
Chaos regime
Size: cut risk per trade or stay flat.
Timeframe: either move to higher timeframe to filter noise or skip the instrument.
Goal: defense, not growth. The main job here is to avoid feeding the spread and slippage.
Use a journal to find your best regime
Add one extra column to your trading journal: “regime”. For each trade, assign one of three labels before entry.
After 30–50 trades, group the results by regime. Many traders discover that:
Trends give the main profit.
Ranges give small but stable gains.
Chaos slowly eats everything.
Once this pattern becomes visible in numbers, discipline around regimes stops being an abstract rule. It turns into a very practical filter.
Conclusion
A setup without a regime filter is half a system.
Start every analysis with a simple question to the chart: trend, range or chaos. Then apply the playbook that fits this environment, instead of forcing the same behaviour from the market every day.

Bitcoin Price Update Clean Clear ExplanationBitcoin trading inside a wide consolidation zone, with price currently hovering around the mid-range near 90K Multiple supply and demand zones are highlighted, giving a clear picture of where strong buying or selling reactions may occur.
If Bitcoin holds above the current minor support and builds momentum, price may Push upward through the mid-range resistance retest higher supply zones between 93K / 94K then continue climbing toward the upper rejection zone shown in the chart this scenario represents a continuation of the bullish trend if buyers stay in control.
If the price fails to hold above the local support levels breakdown is expected toward the major support at 87K if this zone also fails, the chart projects a deeper drop into the heavy demand zone around 84K this represents a potential shift from consolidation to bearish retracement, where sellers regain strength.
If you found this analysis helpful free, free to leave a comments and share thanks.

Swing short for BTCAfter finishing a complex and tricky wave 4 yesterday, finally last night we entered the wave 1 and this setup will be my trading plan for a swing short.
Always DYOR !

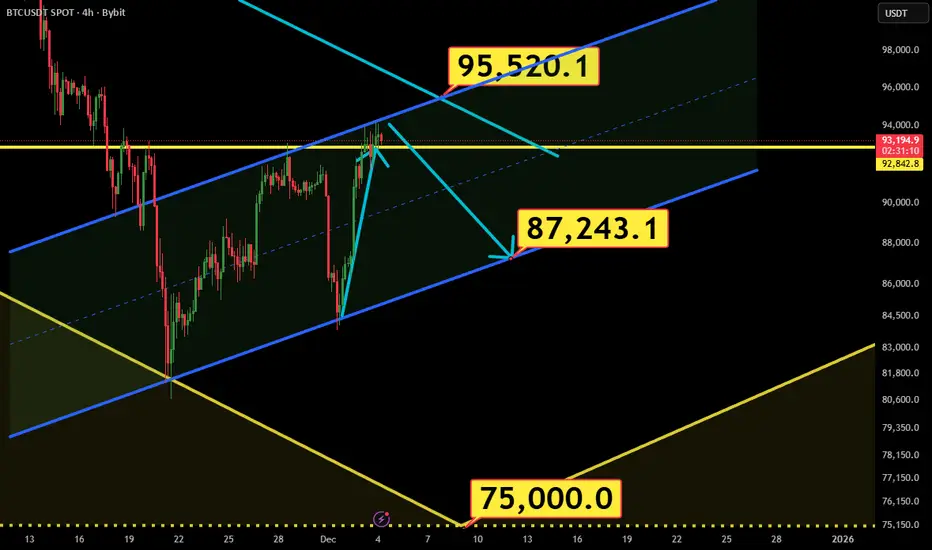
Not ready yet!If Bitcoin fails to secure a 12-hour close above 95,000, a corrective move toward 87,000 and even 75,000 remains on the table. However, one way or another, the market structure is ultimately poised to break upward toward 108,000.
Short term bullish. Bitcoin is starting December on weaker footing as risk assets wobble and the year-end rally narrative gives way to a market working through heavy volatility. BTC has fallen into the mid-$80,000s after trading above $125,000 in early October, leaving the token roughly 30% off the highs and giving back a large portion of its 2025 outperformance.

BTC at Risk: Structure Break + RSI Warning$BTC/USDT is showing some concern on the monthly chart as price has broken below the rising wedge and is now retesting a major demand zone. Losing this zone could trigger a deeper correction.
At the same time, RSI is showing a clear multi-year bearish divergence, highlighting weakening momentum.
Until BTC reclaims the wedge support or closes back above the resistance band, downside risk remains elevated.
DYOR, NFA
Please hit the like button if you like it, and share your views in the comments section.

Bitcoin: not near breakouts for nowHey guys, BTC's setting up an intriguing consolidation pattern at $92,350 after getting rejected from yesterday's $94,221 high, and the technical structure underneath is telling a pretty bullish story despite the surface-level chop. Let me break down what I'm seeing across multiple timeframes and why this could be gearing up for the next leg higher.
On the 4-hour chart, we're dealing with a classic post-rejection consolidation phase. Price pulled back -1.40% from the 24h high but found solid support right at the EMA20 ($91,578) and has been coiling above it ever since. What's important here is the higher low structure that's forming, BTC bounced from $91,520 (24h low) and hasn't retested that level, instead building a base above $92,000. This is textbook bullish price action where dips are getting bought rather than cascading into lower lows.
The moving average stack is giving us mixed signals but leaning constructive. Price is trading above both the EMA20 ($91,578) and EMA50 ($90,985), which is your first confirmation of short-term bullish momentum. However, we're still below the EMA200 at $93,911, which is acting as the major resistance ceiling right now. This creates a clear battleground zone between $92,000 support and $94,000 resistance. The HMA55 at $91,458 is providing additional support confluence, reinforcing that $91,400-$91,500 zone as a critical floor.
Diving into the momentum indicators, the MACD is showing a bullish crossover with solid separation (MACD line at 523 vs Signal at 411). This 112-point spread indicates genuine upside momentum building beneath the surface, even though price action looks choppy. The histogram is expanding positively, which typically precedes price following momentum higher. Now, the ADX at 15.3 tells us we're in a weak trend environment, but don't mistake that for bearish. Low ADX during consolidation often means the market is coiling energy for the next directional move, and with MACD bullish, that move is more likely to be upward.
RSI at 52.2 sits perfectly neutral with massive room to run before hitting overbought territory at 70. This is ideal for swing longs because you're not buying into extended conditions. The Stochastic at 57.0 mirrors this neutrality, while the MFI (Money Flow Index) at 42.8 is particularly interesting. MFI below 50 during a consolidation phase with price holding support suggests we're not seeing heavy distribution from smart money. If whales were dumping, MFI would be diving toward oversold while price breaks support, that's not happening here.
Bollinger Bands are providing clear technical boundaries for this setup. Price is trading above the middle band at $91,404, which has flipped from resistance to support, a bullish development. The upper band sits at $93,744, just below that critical EMA200 at $93,911, creating a resistance cluster in the $93,700-$94,200 range. The lower band at $89,064 represents the extreme downside scenario, but we'd need to lose multiple support layers to get there. The current BB position (above middle, below upper) is typical of consolidation before continuation moves.
Volume analysis is revealing. Current volume at $12,060 is significantly below the average of $26,267, sitting at roughly 46% of normal activity. In isolation, low volume might seem bearish, but context matters. When price consolidates on low volume above key support levels, it typically indicates larger players aren't actively selling, they're waiting. Distribution phases show high volume with price failing to make progress. This looks more like accumulation or at minimum, a lack of selling pressure. Once volume returns, if it comes with upside price action, that's your breakout confirmation signal.
The wick analysis adds another layer of insight. Upper wicks at 33.9% versus lower wicks at 24.1% shows sellers are stepping in at higher prices (around that $93,700-$94,200 resistance zone), but buyers are absorbing that selling pressure without letting price collapse. This tug-of-war is creating the consolidation, but the fact that we're holding above $92,000 despite repeated upper wick rejections suggests demand is strong enough to eventually push through supply.
Looking at support and resistance levels with precision: Immediate support sits at $92,000 (psychological level), then $91,578 (EMA20), followed by $91,404 (BB middle). The critical support that must hold for bulls is $90,985 (EMA50), with final line in the sand at $90,800. Below $90,800, the higher low structure breaks and we'd likely see a flush toward $89,064 (BB lower) or even $88,500. On the upside, resistance layers at $93,744 (BB upper), $93,911 (EMA200), and $94,221 (24h high). A break and hold above $94,200 would be significant, flipping the EMA200 from resistance to support and likely triggering momentum algorithms.
For a concrete trading setup, here's what I'm watching: Entry zone is $92,000-$92,500, essentially current levels where we're consolidating. This gives you a defined risk entry rather than chasing breakouts. Stop loss goes at $90,800, which represents the invalidation point where the bullish structure breaks (losing EMA50 and higher low pattern). That's roughly a 1.6% risk from current price. Take profit targets: TP1 at $94,200 (2.0% gain, 1:1.25 R/R) for the conservative BB upper breakout, TP2 at $95,500 (3.4% gain, 1:2.1 R/R) for the EMA200 reclaim with extension, and TP3 at $97,000 (5.0% gain, 1:3.1 R/R) for those riding momentum. Scale out at each level to lock profits while leaving room to catch a larger move.
The key trigger to watch is volume returning on the breakout attempt. If BTC pushes toward $93,700-$94,000 and volume surges above the $26,267 average, that's your confirmation to add to positions or enter if you missed the initial setup. Conversely, if we approach resistance on weak volume (sub $15,000), that's a fade opportunity rather than a buy signal, expect rejection back to $92,000 support.
Risk-reward clearly favors the long side here with 1:2 to 1:3 setups available, solid moving average support underneath, bullish MACD momentum, and neutral oscillators with room to run. The main risk is a macro catalyst or sudden volume spike that breaks $90,800 support, but technically, the path of least resistance appears to be higher once this consolidation resolves.
What are you thinking here, are you playing this consolidation for the breakout or waiting for clearer confirmation above $94,000?

BTC/USDT | Another try before bearish move? (READ THE CAPTION)Good day everyone, Amirali here.
As stated in the previous analysis, BTCUSDT reacted to the supply zone and faced a dropdown and now it is being traded 92,600 level right now. I expect another move to the FVG and seeing how it reacts before making a move. Should it manage to break through the 4H FVG, I expect a move to $96,900, the lower level of daily FVG.
