Bitcoin is retesting trendline resistance and can dump morePrice is near major resistance of 116K$ and if it hold strong then price can dump easily below 100K$ this time but also we should consider this that if the resistance here break to the upside which is orange circle then heavy pump will lead and we can expect new ATH around 130000$ this time like the green arrow.
DISCLAIMER: ((trade based on your own decision))
<<press like👍 if you enjoy💚
BTCUSDT.3S trade ideas

Lingrid | BTCUSDT Swap Zone Break - Bull Signal ActiveThe price perfectly fulfilled my previous idea . BINANCE:BTCUSDT has closed above the swap zone around 112,000 and is holding above the upward channel trendline, signaling renewed bullish momentum. The breakout from the prior triangle pattern and formation of a higher low strengthen the case for continuation. If buyers sustain control, price could retest 123,000 before attempting the broader resistance area near 130,000. The overall structure points to a bullish phase, with consolidation likely to act as a base for further upside.
💡 Risks:
A drop back below 112,000 would weaken the bullish setup and expose downside toward 100,000 support.
Hawkish US monetary policy or stronger-than-expected macro data could pressure risk assets, including Bitcoin.
Broader crypto market weakness or heavy profit-taking at resistance zones may limit upside momentum.
If this idea resonates with you or you have your own opinion, traders, hit the comments. I’m excited to read your thoughts!

BTC - The Head and Shoulders of the Year?Bitcoin is shaping one of the most powerful reversal patterns traders could ask for: the inverse head and shoulders. After holding the ascending channel’s lower bound and bouncing from the key structure zone, BTC is signaling that bulls may soon take over.
Here’s what stands out on the chart:
🟢 Bullish Channel: Price continues to respect the rising channel, maintaining its long-term bullish outlook.
🛡️ Structure Zone: The $110,000 – $113,000 region is acting as a crucial pivot, flipping from support to resistance.
🔄 Inverse Head and Shoulders: A textbook reversal setup is forming, with the neckline aligning perfectly with structure.
🚀 Bullish Breakout: A confirmed break above this neckline could trigger the next major impulse move, putting BTC back on track toward higher channel targets.
Bulls need a clean daily close above the neckline for full confirmation — until then, the setup is in play but not yet validated.
📌 Will this become the pattern of the year that propels Bitcoin to new highs?
This is for educational purposes only, not financial advice. Always manage your risk before entering any trade.
📚 Stick to your trading plan regarding entries, risk management, and trade execution.
Good luck!
All Strategies Are Good; If Managed Properly!
~Richard Nasr

TradeCityPro | Bitcoin Daily Analysis #173👋 Welcome to TradeCity Pro!
Let’s dive into Bitcoin analysis. Today and tomorrow are very important days, and it’s crucial to have the right outlook on Bitcoin. We’ve got some interesting triggers for opening positions that could potentially hit our trading targets for the next few weeks.
⌛️ 4-Hour Timeframe
Bitcoin has been moving upward along a trendline and is now sitting inside a resistance zone. How price reacts to this level is key—it could determine Bitcoin’s next major move.
🔍 If the resistance breaks, an upward rally could begin, as volume has been increasing strongly and the RSI is sitting just below 64.92. That’s an important resistance level, and breaking it could bring fresh momentum into the market.
💥 Rising momentum and strong buying volume are always good signs of a powerful uptrend, and as long as these two factors align with price action, the trend should continue.
⚡️ So, if you already have open positions, you might want to take profits if the price rejects from support and RSI plus volume show divergence with the price move.
✨ If you’re looking to open a new position, the breakout of 113,237 is currently the best trigger for a long entry, provided no divergence appears.
🔽 On the other hand, if price rejects this zone and breaks below the trendline, a short setup could form. However, keep in mind that in the current market, where higher cycles remain bullish, all short positions are risky. Personally, I don’t take shorts in this environment and prefer to stay aligned with the broader uptrend.
📰 Finally, tomorrow we have the U.S. inflation report—one of the most important releases of the month, and it will have a big impact on the market. Be extra careful with your positions, because sharp volatility is highly likely once the data comes out.
❌ Disclaimer ❌
Trading futures is highly risky and dangerous. If you're not an expert, these triggers may not be suitable for you. You should first learn risk and capital management. You can also use the educational content from this channel.
Finally, these triggers reflect my personal opinions on price action, and the market may move completely against this analysis. So, do your own research before opening any position.

BTC & ETH Breakouts Explained (Simple Strategy)Bitcoin just printed a perfect daily breakout candle — and Ethereum is forming a massive structure. In this video, I’ll show you the exact triggers I use on Daily, 4H, and 15m to catch the next move before everyone else.
Drop your BTC analysis in the comments — let’s debate it together.
Want me to cover a specific coin in tomorrow’s update? Comment it below.

BITCOIN - Blow off top ? Well history doesn't repeat itself but it definitely rhymes.
My target for this cycle is still in the higher part of this longterm ascending channel between 160K - 220K.
Share your opinions
Do you think top is in ?
Or end of the year will be final expansion?
Can FED rates cut fuel this rally?
David Perk

$BTC market update.CRYPTOCAP:BTC Market Update
CRYPTOCAP:BTC is currently ranging between $120K and $106K.
If you didn’t enter near the bottom of this range, be cautious—there’s still a strong chance of rejection since the 1W consolidation isn’t finished yet.
The recent liquidity grab was expected, and with the CME gap nearly filled, the market is now at a decision point.
What’s next?
We’re sitting in the middle of the range:
If rejected, we could revisit the bottom around $106K, which would offer a stronger entry for the next leg up.
If momentum continues, the next target is the top of the channel at $120K.
The rejection scenario looks more likely since this push wasn’t impulsive—it was news-driven and unfolded slowly over a week, suggesting market makers may be buying to trigger short liquidations.
Indicators:
RSI → Each time it overheats, a cooldown follows. A better entry may be lower since this move seems topped.
MACD → Still ranging, offering clear buy/sell zones.
Stochastic RSI → Pointing toward a cooldown, reinforcing the rejection case.
Bearish divergence → If it is forming now, it would validate this idea further. Keep and eye on it.
Always remember: DYOR (Do Your Own Research).

BTCUSDT Open Ways correction before another buying attemptBitcoin Technical Outlook Market is consolidating near this zone. A false breakdown below support has already occurred, attracting buyers back into the range.
Key Levels for watch :
1st Resistance 120,000
2nd Resistance : 123,000
if Price action is waiting for confirmation from potential Fed rate cuts. A rate cut would act as fundamental support for Bitcoin, possibly accelerating upside momentum. If price holds above 113,300–114,600, consolidation could lead to a breakout toward 120K → 123K. A clean breakdown below 113,300 would invalidate this support and may open the way for deeper correction before another buying attempt.
You May find more details in the chart.
Trade wisely best of Luck Buddies,
Ps; Support with like and comments for better analysis Thanks for Supporting.
TradeCityPro | Bitcoin Daily Analysis #174👋 Welcome to TradeCity Pro!
Let’s dive into Bitcoin analysis. Today the U.S. inflation data was released, so let’s see how it impacted the market.
⌛️ 4-Hour Timeframe
Earlier today, the PPI index came in favorably for the market, and Bitcoin responded with an upward move following the news.
🔔 Yesterday, however, we saw some unusual global events. Israel carried out a military strike in Qatar, and at the same time, Nepal’s government collapsed following a popular revolution.
✨ These developments were negative for risk assets like Bitcoin, and as a result, the price was rejected from its resistance zone.
✔️ That said, news like this usually impacts markets only temporarily. Today, Bitcoin once again found support at the trendline and pushed higher with strong volume back into the key zone.
📊 Volume has risen significantly, and with today’s bullish PPI release, the current candle is closing above the resistance area.
💥 At the same time, the RSI is breaking through the 64.92 level, which greatly increases the likelihood of Bitcoin starting its next bullish leg. So if you’re already holding a long position, it’s worth keeping it open—there are no clear signs of weakness in the trend yet, and the market still has room to move upward.
🧩 If you don’t have a position open, you can look for entries on lower timeframes once resistance breaks. However, keep in mind that I personally already opened my positions with earlier triggers, and any new triggers appearing today come with higher risk.
❌ Disclaimer ❌
Trading futures is highly risky and dangerous. If you're not an expert, these triggers may not be suitable for you. You should first learn risk and capital management. You can also use the educational content from this channel.
Finally, these triggers reflect my personal opinions on price action, and the market may move completely against this analysis. So, do your own research before opening any position.

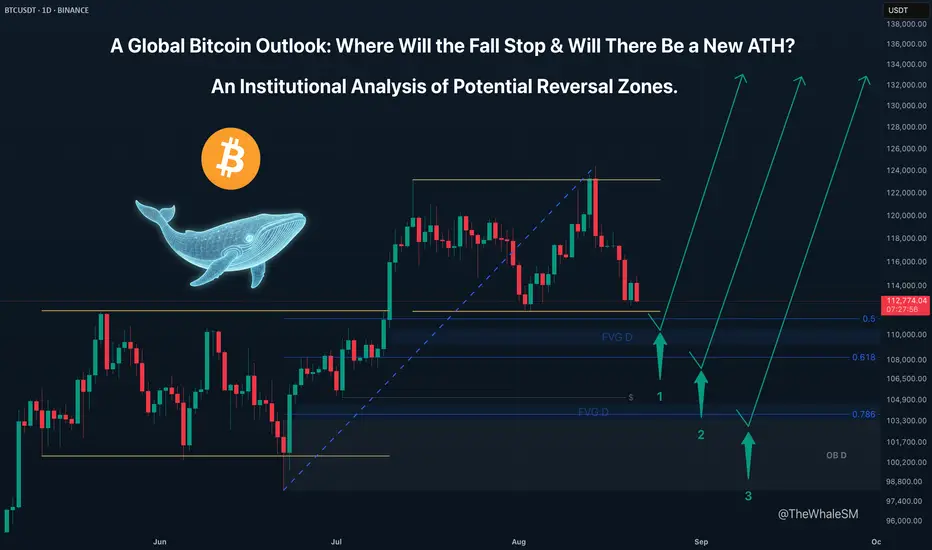
Bitcoin's Tumble: How Deep Does the Rabbit Hole Go?This isn't just a correction; it's a journey down the rabbit hole. The recent "fake" ATH was a calculated move by the whales to engineer a deep pullback. This analysis maps out the key levels in this rabbit hole where Alice—and Bitcoin—might finally find the bottom and begin the climb to a new Wonderland.
After updating its ATH on August 14th, Bitcoin did not continue its global uptrend. It was merely a liquidity sweep of the previous ATH, which confirmed the formation of a large range on the weekly and daily structures. In essence, this new ATH was a deviation above the range, after which the asset began a sharp markdown, collecting all the internal liquidity.
Most likely, the recent ATH was not the final one in this global bull cycle for Bitcoin because a proper, definitive high that would look like the start of a bear cycle was not established. Instead, it was achieved through a manipulation aimed at engineering a correction for the instrument down to key institutional levels.
Three Potential Long Scenarios
General Entry Conditions for All Scenarios:
Since these are levels from a global structure, a valid entry requires a clear reversal reaction and price finding acceptance above the respective Fib level . Confirmation of this may require waiting for 1-2 daily candles to close if the 1-4H candles do not immediately confirm the reversal.
SCENARIO 1 (Primary): The 50% Weekly Fib Level
This is the first corrective level from which a reversal is possible. A key confluence here is that reaching this level would be accompanied by a sweep of the external liquidity from the lower boundary of the range, as well as the mitigation of the upper boundary of the previous range, which could provide the necessary fuel for the next major impulse up. An added plus would be the price reaching the daily FVG that lies just below this level.
SCENARIO 2 (Deeper Correction): The 61.8% Weekly Fib Level
A break of the 50% level would mean that there wasn't enough liquidity and a deeper correction is needed. The next logical target would be the 61.8% level.
SCENARIO 3 (Final Defense): The 78.6% Weekly Fib Level
This is the last line of defense for the bullish structure. A reaction here would offer the most discounted entry to join the potential continuation of the bull run.
If the final retracement level is broken, the price will most likely attack the June 22nd low at 98200 . If the price finds acceptance below this level with daily/weekly candles, it would signal the end of the global bull cycle and the beginning of a bear market, but this is a distant and less probable perspective for now. I find it more probable that one of the three long scenarios will play out, and the price of Bitcoin will set a new, legitimate ATH.
Since the price is still inside the new large range—albeit near its lower boundary—reaching the first 50% global correction level may take some time and will likely happen next week. Whether this level can withstand the assault will determine if Bitcoin's fall continues, and just how deep Alice's rabbit hole truly is.
~~~~~~~~~~~~~~~~~~~~~~~~~~~~~~~~~~~~~~~~~~~~~~~~~~~~~~~~~~~~~~~~~
The principles and conditions for forming the manipulation zones I show in this trade idea are detailed in my educational publication, which was chosen by TradingView for the "Editor's Picks" category and received a huge amount of positive feedback from this insightful trading community. To better understand the logic I've used here and the general principles of price movement in most markets from the perspective of institutional capital, I highly recommend checking out this guide if you haven't already. 👇
P.S. This is not a prediction of the exact price direction. It is a description of high-probability setups that become valid only if specific conditions are met when the price reaches the marked POI. If the conditions are not met, the setups are invalid. No setup has a 100% success rate, so if you decide to use this trade idea, always apply a stop-loss and proper risk management. Trade smart.
~~~~~~~~~~~~~~~~~~~~~~~~~~~~~~~~~~~~~~~~~~~~~~~~~~~~~~~~~~~~~~~~~
If you found this analysis helpful, support it with a Boost! 🚀
Have a question or your own view on this idea? Share it in the comments. 💬
► Follow me on TradingView for timely updates on THIS idea (entry, targets & live trade management) and not to miss my next detailed breakdown.
~~~~~~~~~~~~~~~~~~~~~~~~~~~~~~~~~~~~~~~~~~~~~~~~~~~~~~~~~~~~~~~~~
The ray of hope doesn't last longI think in about 2 hours we will see a new downward movement.
Only the market maker knows of course.
But these are calculations using probability theory.
Always look at all the details when analyzing, don't look at the fact that the candle is green.
It lures you psychologically to buy. But it's still early.
There are few liquidations on the market. They are not being written about yet.
There are still strong token inflows to the exchanges

Bitcoin Next Step Towards LiquidityI guessed a little wrong with the time. But the probability theory works as usual. Because the thoughts of the market maker cannot be guessed more accurately.

Deep Learning Model for 24-Hour Bitcoin Price PredictionHi everyone,
I’ve developed a deep learning AI model designed to predict Bitcoin’s price movement over the next 24 hours on the 15-minute timeframe.
The model was trained using the following features:
Time-related: Hour, DayOfWeek
Price & volume lags: Close_lag_1, Close_lag_2, Close_lag_4, Close_lag_8, Close_lag_12, Volume_lag_1, Volume_lag_2, Volume_lag_4, Volume_lag_8, Volume_lag_12
Moving averages & statistics: MA_4, Std_4, Dist_MA_4, MA_16, Std_16, Dist_MA_16, MA_48, Std_48, Dist_MA_48, MA_96, Std_96, Dist_MA_96
Technical indicators: Return_log, MACD, RSI
It’s important to note that this model does not directly provide exact entry points for trades. Instead, it indicates the likely direction of the market, meaning you’ll still need basic trading knowledge to apply it effectively.
After testing it over the course of one month, I achieved a success rate of around 90% in my trades when using the model as part of my strategy.
Hourly Forecast for the Next 24 Hours
2025-09-16 14:00:00 115529.747893
2025-09-16 15:00:00 115664.378704
2025-09-16 16:00:00 115790.671571
2025-09-16 17:00:00 115908.788930
2025-09-16 18:00:00 116010.645005
2025-09-16 19:00:00 116097.736023
2025-09-16 20:00:00 116174.594429
2025-09-16 21:00:00 116243.739858
2025-09-16 22:00:00 116305.687168
2025-09-16 23:00:00 116361.291811
2025-09-17 00:00:00 116411.482625
2025-09-17 01:00:00 116438.178056
2025-09-17 02:00:00 116485.150875
2025-09-17 03:00:00 116547.137700
2025-09-17 04:00:00 116612.372218
2025-09-17 05:00:00 116678.941996
2025-09-17 06:00:00 116747.048977
2025-09-17 07:00:00 116816.420009
2025-09-17 08:00:00 116886.252751
2025-09-17 09:00:00 116955.774095
2025-09-17 10:00:00 117024.461468
2025-09-17 11:00:00 117091.921924
2025-09-17 12:00:00 117157.892829
2025-09-17 13:00:00 117222.173427

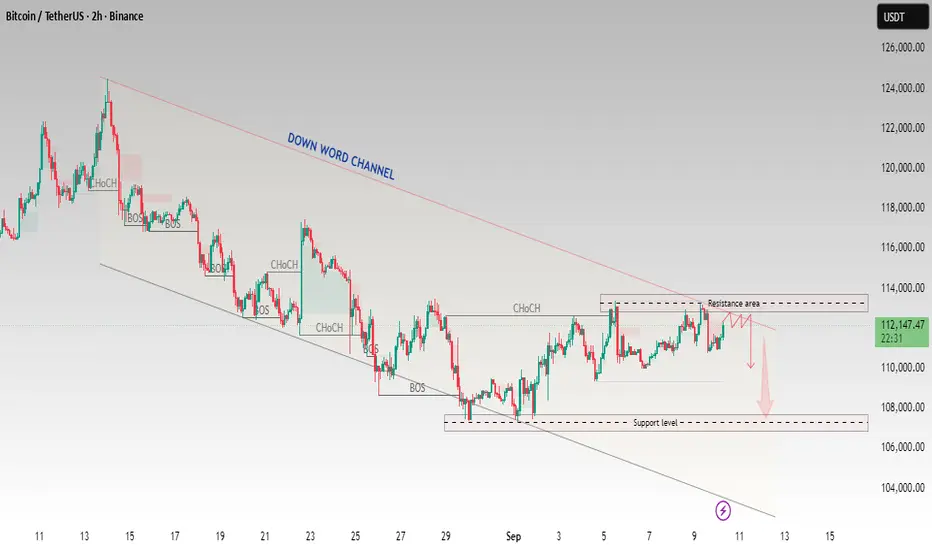
Bitcoin(BTCUSDT)–ResistanceRejection Setup|DownChannel structureBitcoin (BTCUSDT) is still respecting its downward channel structure, with multiple CHoCH (Change of Character) and BOS (Break of Structure) signals along the way.
Resistance Zone: 113,500 – 114,000
Support Zone: 107,500 – 108,000
Price is currently trading around 112,226, just below the resistance area. If sellers step in strongly, a rejection could drive price back down toward the support zone.
A sustained breakout above resistance would invalidate this short-term bearish outlook.
Watch for rejection patterns around resistance before taking entries.
Bearish continuation is valid only if the channel remains intact.
Always apply proper risk management and stop-loss levels.
This analysis is for educational purposes only. It is not financial advice. Please do your own research before making any trading decisions.
BTC Analysis 8/9-Psychological ResistanceFundamental Analysis:
Gold was supported to rise strongly to 3600 at the end of last week when the Nonfarm payrolls were released weaker than expected ==> Making the FED certain to cut interest rates by at least 0.25% on September 17. Even the expectation of the FED cutting interest rates by a strong 0.5% has increased - If the CPI data released next Thursday is weaker than expected, the expectation of a 0.5% cut in September will continue to increase and support the price of gold to increase.

BTC target 145 before crashingBTC is moving in a rising channel my target is 145k area in next month, where I expect the end of bullish cycle started in 2020 and a massive crash of bitcon to 40k-50k range

BTC's situation+next targets and expected movementsThe price seems to have completed the corrective wave, and from now on, it's time for a price increase, which will continue up to around $150k .
_ _ _ _ __ _ _ _ _ _ _ _ _ _ _ _ _ _ _ _ _ _ _ _ _ _ _ _ _ _ _ _
✅Thank you, and for more ideas, hit ❤️Like❤️ and 🌟Follow🌟!
⚠️Things can change...
The markets are always changing and even with all these signals, the market changes tend to be strong and fast!!

TradeCityPro | Bitcoin Daily Analysis #175👋 Welcome to TradeCity Pro!
Let’s move on to Bitcoin analysis. I haven’t posted an update for the past two days, but starting today, let’s get back to the market and see what’s ahead.
⌛️ 4-Hour Timeframe
The U.S. CPI and PPI data, two key inflation indicators, were released and came in favorably for the market. As a result, Bitcoin has moved toward 117,048.
💥 At the moment, most of the positions we’ve opened are in profit. Because of this, taking some profit could be a smart option, since Bitcoin might enter a corrective phase once it reaches the 117,048 level.
📈 For new entries, a clean breakout above 117,048 would be a valid trigger. However, the chance of breaking this zone on the first attempt is low, and there’s a strong possibility that price will wait for Powell’s upcoming speech before making its next decisive move.
📊 We can also use RSI’s move into the overbought zone as a momentum confirmation. If that happens, it could set off a powerful bullish leg to the upside.
❌ Disclaimer ❌
Trading futures is highly risky and dangerous. If you're not an expert, these triggers may not be suitable for you. You should first learn risk and capital management. You can also use the educational content from this channel.
Finally, these triggers reflect my personal opinions on price action, and the market may move completely against this analysis. So, do your own research before opening any position.

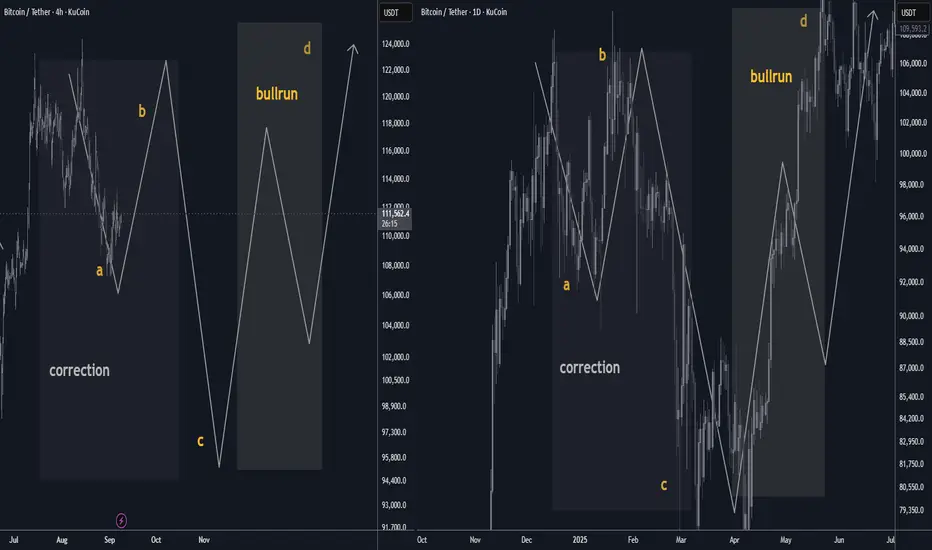
Bitcoin September 2025 Outlook: a/b/c price fractal structureBTC enters September post-ATH with a seasonal headwind. Base case: a ~10% A-leg dip toward $108k, a B-bounce into ~$122k, then a C-flush near ~$94k—echoing April’s ABC rhythm. Once complete, the uptrend should re-assert into year-end. 📉🔁📈 #Bitcoin #Seasonality #Crypto
🟠 Bitcoin September Outlook: Seasonality vs. Structure
After a fresh ATH, September’s historical bias skews mildly red. Base case is a ~10% A-leg dip that develops into an A/B/C correction before trend continuation. Think controlled pullback → consolidation → next markup. 📉➡️🔁➡️📈
________________________________________
🗓️ Seasonality Snapshot (2015–2024)
• Mean (10-yr): −2.55% · Median: −4.52%
• Red months: 6/10
• Worst September: 2019 (−13.88%)
• Best September: 2024 (+7.39%)
• Last 3 yrs avg: +2.8% (2024 +7.39%, 2023 +3.99%, 2022 −3.09%)
• Last 5 yrs avg (2020–2024): −1.3%
Read: September has tended to be weak, but the last two years printed green. Seasonality is a headwind—not a handbrake. 🌬️
________________________________________
🧩 Structure Thesis (Fractal Analog)
You’re looking for a repeat of April 2025’s A/B/C rhythm—scaled up:
• April 2025 reference: A ≈ $92k → B ≈ $106k → C ≈ $80k
• Now (projected):
o A ≈ $108k (≈ 10% pullback from recent highs) 📉
o B ≈ $122k (relief rally / lower high) 🔁
o C ≈ $94k (final flush into demand, completing the correction) 🧱
Interpretation: A measured September fade aligns with the A-leg. A reflexive B-bounce can follow as funding resets and late longs get cleaned up, with a C-leg completing the pattern before the next expansion. 🚀
________________________________________
📊 How Seasonality Supports the Call
• Typical drag: Median −4.5% and multiple red Septembers justify a down-bias.
• Volatility window: The historical 21-point spread (best +7.39% vs worst −13.88%) means a 10% dip sits well within normal bounds.
• Cycle context: With a new ATH just printed, a shallow corrective phase is constructive—not bearish regime change.
________________________________________
🧭 Levels & Triggers
• Bias line: Momentum cools into $108k → watch for seller absorption and open interest reset.
• Relief cap: $122k acts as B-rally resistance; sustained closes above $122k would invalidate the ABC idea and argue for immediate continuation. ✅
• Completion zone: $94k (C) is the buy-the-dip completion area; clean breaks below raise risk of a deeper time correction rather than a swift V-reversal. ⚠️
________________________________________
🧪 What to Monitor (Confirmation/Invalidation)
• Liquidity & OI: De-leveraging into A, controlled OI rebuild into B, washout into C.
• Spot-ETF flows / stablecoin issuance: Weakening into A, stabilizing by late month supports B→C rhythm.
• Funding/basis: Overheated → normalize during A; negative spikes near C often mark capitulation.
• Breadth (alts): Underperform into A/C; broad risk-on breadth usually returns post-C.
________________________________________
📝 Base Case Path (Textbook)
September: drift to $108k (A) → bounce toward $122k (B) → final tag of ~$94k (C) → reset + markup into Q4.
(If price reclaims and holds above $122k early, treat that as trend continuation—not a correction.)
________________________________________
🔒 Risk Notes
• Seasonality is a tendency, not a rule. Macro catalysts (CPI, policy, liquidity) can dominate calendar effects.
• This is market commentary, not financial advice. Manage risk and invalidation levels. 🛡️
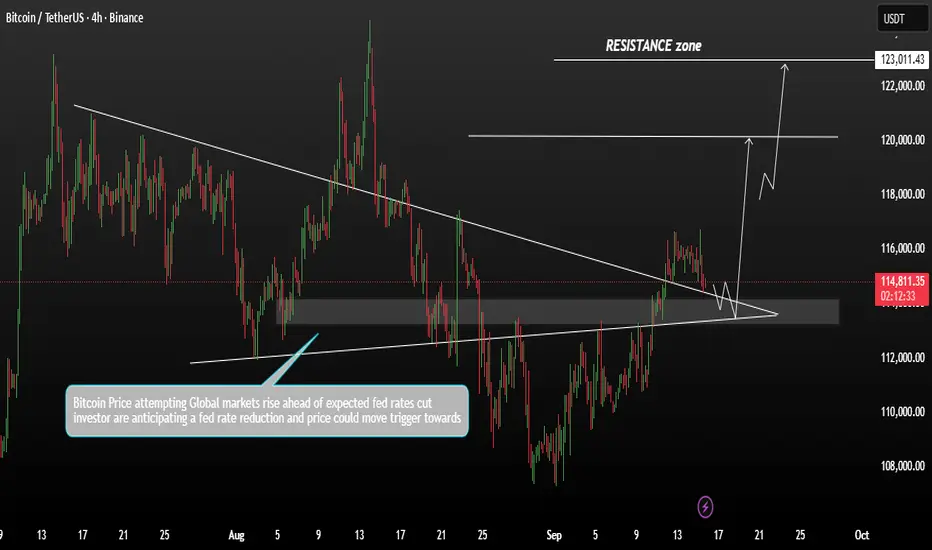
BTC/USDT | Bitcoin Rally Setup – Next Stops: $116.7K and Beyond!By analyzing the Bitcoin chart on the 4-hour timeframe, we can see that the price is currently trading around $115,500. As long as it holds above the key support zone of $113,700–$115,300, I expect Bitcoin to continue its bullish move toward higher levels.
The next possible upside targets are $116,700, $117,450, and $118,600. Longer-term targets will be shared in future updates!
Please support me with your likes and comments to motivate me to share more analysis with you and share your opinion about the possible trend of this chart with me !
Best Regards , Arman Shaban

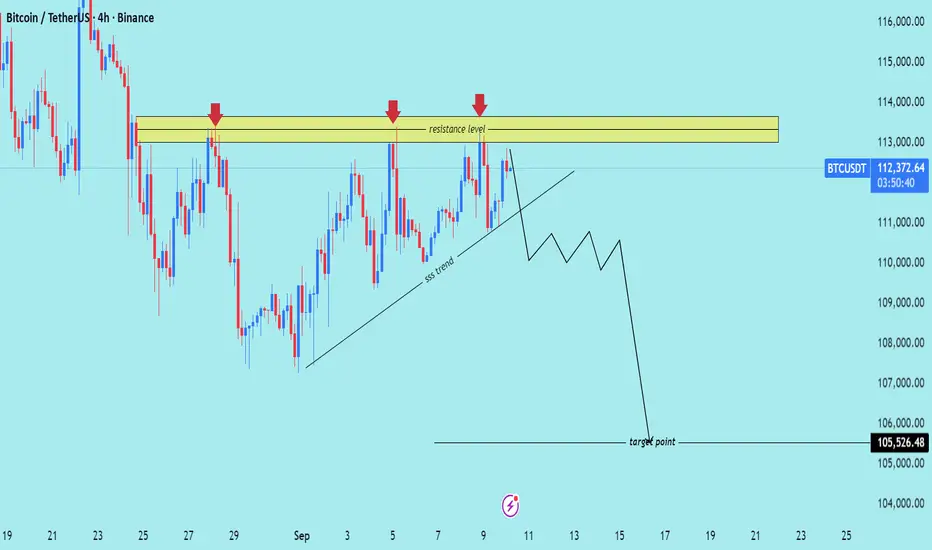
BTC/USD) Ready for drop Read The captionSMC Trading point update
Technical analysis of Bitcoin (BTC/USDT) on the 4H timeframe.
---
Technical Breakdown – Bitcoin (4H)
1. Resistance Zone
Strong resistance level between $113,000 – $114,000 (highlighted yellow).
Price has tested this zone three times (red arrows), showing clear seller strength and liquidity rejection.
2. Structure Trendline
Market is following a short-term ascending support trendline.
Current projection suggests this trendline may break, which would signal a shift in momentum to bearish.
3. Bearish Outlook
If resistance continues to hold, a trendline breakdown could trigger strong downside momentum.
Target Point: $105,526.48 – a major demand zone where liquidity sits.
4. Trading Plan Idea
Entry: On rejection at $113K–$114K zone or confirmation of trendline break.
Stop Loss: Above $114,500 (to protect from false breakouts).
Take Profit: $105,526.48
---
Summary
Bias: Bearish
Reason: Multiple resistance rejections + trendline vulnerability.
Setup: Look for shorts from resistance or after trendline break → Target $105.5K zone.
Mr SMC Trading point
---
This setup is a classic SMC bearish scenario: liquidity trapped at resistance → trendline break → expansion down to collect liquidity at lower demand.
Please support boost 🚀 this analysis
Bitcoin Holds Local Lows as Uptrend Extends HigherAfter testing recent local lows, Bitcoin has bounced strongly, signaling that buyers remain in control. With no significant bearish rejection at resistance, the price action structure suggests room for continuation higher.
Key Technical Points:
- Local lows defended with a bullish reaction.
- Structure of consecutive higher highs and higher lows remains intact.
- No bearish rejection at resistance, leaving upside potential open.
Bitcoin’s recent defense of local lows has been a decisive event for traders watching the sustainability of its uptrend. The reaction from this support zone not only reinforced buyer conviction but also highlighted the strength of market structure. As long as price continues printing higher highs and higher lows, the bullish trajectory remains valid.
Importantly, there has been no reactive rejection from nearby resistance zones. Typically, sellers would use these levels to push the market down, but the lack of bearish influx suggests that the market is comfortably absorbing supply.
Volume inflows further support this bullish outlook, with demand persisting during each upward rotation. This creates the conditions for momentum to carry price higher, potentially toward mid-range resistance and eventually high-timeframe objectives.
What to Expect in the Coming Price Action:
As long as higher-low formations are preserved, Bitcoin is likely to rotate higher toward resistance zones. A failure at support would challenge this outlook, but for now, continuation to the upside is the dominant scenario.

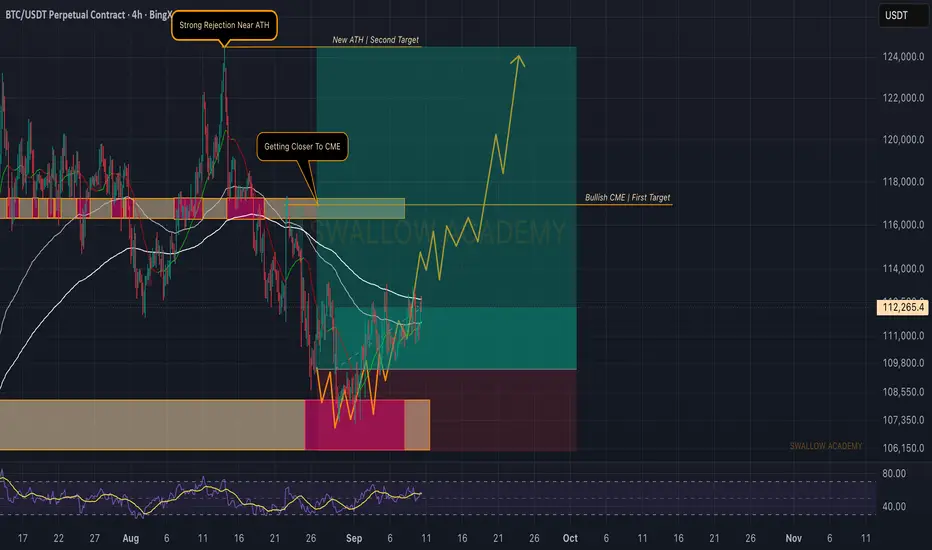
Bitcoin (BTC): Waiting For That Breakout of 200EMABTC still remains below the 200EMA, where we’ve now seen the third touch of that zone. Buyers continue to keep the pressure.
We keep waiting for the breakout — major target stays the same at the bullish CME gap near $116K–117K.
Swallow Academy