SPOT BTC LONG 4.12.2025📈 SPOT
BTC
Pinning after abnormal activity.
💰I enter at the market price.
I'll let you know when I record it manually.
‼️Risk per trade: 2% of the allocated funds for spot trading.
Thank you!
Trade ideas

Bitcoin Analysis| Key Decision Moments !
Fear & Greed: 27 — still in Fear.
🔁 Market Structure (Quick Summary)
We printed a higher low vs. the previous low and broke the important $92,000 level.
From here, longs are actionable, but only with clear structure & confirmation — this isn’t a blind buy.
If price fails back under $92k, the picture gets messy and I’ll prefer to step away from spot BTC.
🚀 Bullish Plan
Primary long trigger: breakout above 93,758 (preferably a 1-hour close).
If you see increasing, stepwise volume on the breakout, you can treat the long as valid earlier.
If BTC.D (dominance) is rising, BTC itself is the preferred long — otherwise, favor strong altcoins.
Reminder: even after a confirmed break, trade with distrust — this is a short-term setup in a market that’s not yet clearly bullish for higher timeframes.
⚠️ Why the trend isn’t “confirmed” yet
On the 4H, we still need to form a higher low above 92k and then break 93,758 to be more confident.
After the 92k break we didn’t see a meaningful volume surge, and candle shapes look weak — that reduces conviction.
🔻 Bearish / Caution Scenario
If price closes back below $92,000, I can’t clearly choose a side — there’s a lower high and a higher low and that’s ambiguous.
In that case I’ll distance from BTC and look for altcoin setups or wait for clearer structure.
Key deep support (for a sharp drop): $84,000.
If $90,000 is broken and held below, expect range behavior on lower timeframes (1H / 4H).
✂️ Short Trigger (what to watch)
I’m not hunting shorts while buyers look strong.
If bears take control and we close under 92k with confirming dominance, then I’ll consider shorts — but only with clear 1H structure and tight stop.
🧠 Trading posture & risk management
When the higher-timeframe trend is unclear, be sharper on screen time and reduce position size.
Good risk-to-reward entries now can fund bigger positions later when the trend is obvious.
Always manage risk — don’t forget stop placement and take-profits.
✅ Final take
I’ll enter long on a clean break & 1H close above 93,758, or pick the better altcoin if it shows a stronger setup.
If price closes below 92k, I’ll step back from BTC and scan altcoins for short or conditional setups.
Volume and BTC.D are your co-pilots — trade what they confirm.
Hope you found this useful — trade smart and stay disciplined! 💎🚀

BTC: Target at 100KCurrently, our strategy of continuing to go long remains profitable. Congratulations to friends who followed me to go long when the price was below 90K. It is expected that the market will continue to rise after a correction, with the target focusing on 100K.
I send out accurate signals every day, and all signals have been accurate for two consecutive weeks. Don't miss out.

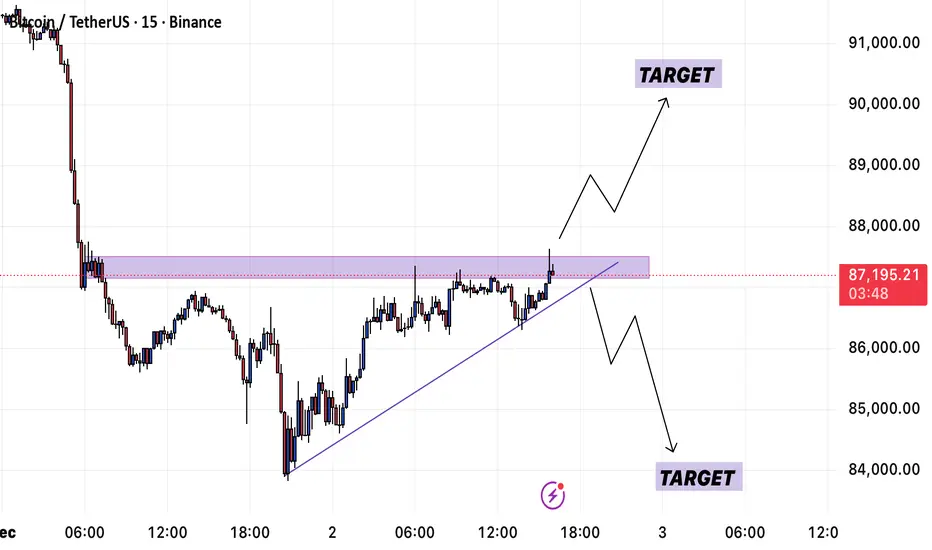
Bitcoin Squeezing Into Key Resistance: Breakout SetupBitcoin is currently testing a key horizontal resistance zone (highlighted in purple) after forming a steady series of higher lows along the ascending trendline. This creates a compression pattern where price is being squeezed toward a breakout point.
A decisive move above the resistance zone could trigger bullish continuation, with momentum potentially pushing price toward the next liquidity area around the upper target zone.
However, a rejection from this resistance or a break below the ascending trendline would shift the short-term bias bearish. In that case, price may revisit the lower liquidity pocket marked as the downside target.
Key Points:
• Structure: Higher lows forming against strong resistance
• Bullish Scenario: Break and hold above resistance → continuation toward 89k–90k zone
• Bearish Scenario: Trendline break + failure at resistance → move toward 84k area
• Decision Zone: Current resistance region is critical for determining direction
Bias:
Neutral-to-bullish while price holds above the ascending trendline. Confirmation required for either breakout or rejection.
BTCUSD: Reversal From Target & Demand Zone Liquidity Sweep Setup📊 BTCUSD – 30-Minute Smart Money Analysis + MMC Concept Used
Demand Zone Reaction | Volume Burst | QFL Strategy
🔍 1. Market Overview
Bitcoin on the 30-minute chart is currently pulling back after failing to break above the recent intraday high. Price is slowly drifting downward, showing signs of controlled seller pressure. This decline is driving BTC toward a key demand + target zone, marked in blue, with deeper liquidity resting in the green “Volume Burst” zone.
This setup suggests a potential reversal opportunity, but only with confirmed price action.
📉 2. Structure Breakdown
A. Decline After Swing High
BTC rejected the upper levels and started forming:
Lower highs
Lower lows
Weak bullish candles
This shows sellers are still in control until price touches a stronger demand pool.
B. QFL Level Marked
The "QFL" marking on the chart reflects:
A base level where price previously formed
A zone that held liquidity and triggered a bullish bounce last time
A zone that smart money may revisit to collect liquidity again
If no pattern forms at the first demand box, BTC may double the QFL, meaning price can dip into the deeper liquidity pool before reversing.
🎯 3. Key Zones to Watch
🟦 Target + Demand Zone (Upper Zone)
This is the first area where buyers may step in.
Expect:
A possible micro reversal pattern
Short-term bounce opportunity
Scalping potential
However, you must wait for a clean bullish pattern here (engulfing, pin bar, break of minor structure).
The chart clearly states:
“Pattern Needed Otherwise Double The QFL”
Meaning: No pattern = price moves lower.
🟩 Volume Burst Zone (Lower Liquidity Pool)
This deeper zone is stronger because:
It represents the previous area where a volume spike occurred
Smart money positioned aggressively here before
Liquidity is highly concentrated
If price reaches this zone, the reversal probability becomes significantly higher.
This area is ideal for high-probability long entries.
📌 4. Smart Money Logic
The price movement aligns with institutional behavior:
The current drop is likely a liquidity hunt
BTC is moving toward unfilled demand
Buyers may re-enter strongly once the market taps the liquidity pockets shown
Institutions often engineer these dips before the next bullish impulse.
📈 5. Professional Trading Plan
1. Let price fall into the demand zone.
Do not enter early.
2. Look for confirmation:
Bullish engulfing
Market structure shift
Large volume candle
Clean rejection wick
3. If no pattern forms in the first zone:
Expect price to dip toward the lower Volume Burst Zone.
4. Main long entry interest:
Lower (green) zone offers the best probability.
📝 Conclusion
BTC is heading toward a well-defined demand structure. The next move depends on how price reacts in the highlighted zones. A bullish reversal is possible, but confirmation is critical. Without a pattern, BTC may dip deeper to collect liquidity—exactly as marked on the chart.
This setup reflects precision-level smart money behavior, offering a clean high-probability trading opportunity for disciplined traders.

The Convergence and Evolution of AI and BlockchainThe Convergence and Evolution of AI and Blockchain: Reconstructing Productivity and Production Relations in the New Digital Economy Paradigm
Authors: SanTi Li, Chunfeng Jun, Lisa, Nahida
Abstract: Current market discussions regarding the relationship between Artificial Intelligence (AI) and Blockchain (Crypto) are often limited to a zero-sum game perspective focusing on liquidity fragmentation. However, in-depth industry analysis and technological evolutionary paths suggest that the two are, in fact, complementary and symbiotic. Against the backdrop of AI driving exponential productivity growth and trending digital content supply toward infinity, the reconstruction of production relations and ownership mechanisms based on blockchain is not merely "icing on the cake," but a fundamental necessity. This article aims to deeply analyze—from the dimensions of reshaping trust mechanisms, establishing ownership systems, shifting economic paradigms, the importance of Tokens as value carriers, and risk control—why the widespread adoption of AI will become the core driver and accelerator propelling blockchain technology from fringe experiments to large-scale application.
1. The Digital Trust Crisis in the Wake of the AI Explosion
With recent breakthrough advancements in AI technology, particularly the widespread application of Large Language Models (LLMs) and Generative AI (AIGC), the core economic significance lies in reducing the marginal cost of content production to near zero. While this has tremendously unleashed social creativity and productivity, it also poses an unprecedented challenge to the existing internet ecosystem, leading to drastic changes in the information environment.
Entropy Increase and Distortion in the Digital Information Ecosystem: With the proliferation of Synthetic Media and Deepfakes, the internet faces the tangible risk of the "Dead Internet Theory." Under this theory, the vast majority of network traffic and content will be generated by bots. When the cost of forging video, audio, and text is extremely low and can achieve pixel-level realism,⚡ the traditional cognitive argument of "seeing is believing," which sustains social operations, faces a total threat of failure in the digital realm. Political elections could be disrupted by forged scandal recordings, and financial fraud can be perpetrated against individuals via real-time face-swapping. These are no longer sci-fi scenarios from Black Mirror, but imminent realities.
Exacerbated Information Asymmetry and Cognitive Overload: When the rate of machine-generated content exceeds human creation by several orders of magnitude, high-quality authentic information risks being submerged. Humans face exponentially rising screening costs when ensuring the veracity of massive amounts of machine-generated information that may carry specific biases or misleading data. This information overload not only reduces decision-making efficiency but may also lead to a tearing of social consensus. In particular, 👼t he new generation growing up with AI will have a much higher degree of trust in AI than the generation that invented AIGC, thereby increasing the probability of being misled or blindly following algorithms.
The Scarcity of Human Inspiration Amidst AI Convenience: It is well known that a significant part of the value distinction between humans and robots lies in human inspiration, which is difficult for AI to mimic. However, human laziness is also a driver of technological progress. Due to the immense increase in convenience, reliance on AI may make future inspiration an absolute "luxury." Meanwhile, the intellectual property of these inspired creators is being ruthlessly plundered and diluted by the extreme speed of AIGC (much of current secondary creation involves unauthorized "content spinning"). Without technical means of protection, the motivation for original human creation will dry up.
In this context, the primary systemic risk facing digital society is not the awakening or rebellion of AI, but the complete collapse of the bedrock of social trust. Building a verification mechanism that can effectively distinguish truth from falsehood, establish information sources, and remain tamper-proof has become a necessary condition for maintaining a healthy digital ecosystem—and this is precisely where blockchain technology finds its purpose.
2. Blockchain Ownership: Evolving from "Optional Component" to Digital Infrastructure
In the "infinite supply" model constructed by AI, scarcity will become the core anchor of digital asset value. Without scarcity constraints, the value of digital content will approach zero as supply increases infinitely, much like a flood of diamonds.💎 Blockchain technology, as a decentralized distributed ledger, functions essentially to establish digital scarcity and ownership attribution through cryptographic means, thereby re-imbuing digital assets with value.
Institutionalization of Data Provenance: As the barrier to content generation lowers, distinguishing between "human creation" and "AI generation" becomes crucial. In 2022, a custom hand-drawn cartoon could sell for hundreds of dollars💵💴(I bought it 🥹), whereas in 2025, similar non-high-precision custom content can be completed in seconds. The on-chain storage of high-value data (such as news reports, artistic creations, legal contracts, academic papers, and identity information) will become an industry standard. Every digital file will need to carry an unforgeable "birth certificate" and "chain of custody." Digital content lacking a Cryptographic Signature and on-chain timestamp will face a severe "trust discount." The combination of C2PA (Coalition for Content Provenance and Authenticity) standards and blockchain technology will build a trusted verification layer for digital content, making the source and modification history of content transparent to all.
Proof of Personhood and Anti-Sybil Attacks: In an era where automated bots can pass the Turing Test and flood the network, the economic and social value of verifying a user's "human identity" is increasingly prominent. Traditional CAPTCHAs are gradually failing and cannot stop advanced AI Agents. Identity verification systems combining biometrics and Zero-Knowledge Proofs (ZKP) will become key infrastructure for distinguishing human users from AI agents. This is not only to prevent airdrop farming but also to prevent online voting and public opinion manipulation by zombie botnets.
In summary, AI creates an infinite supply of productivity, while blockchain provides trusted scarcity constraints and identity anchors. Logically, the two constitute indispensable complementary gears in the digital economy loop: AI makes the world "faster," and Blockchain makes the world "truer."🚀
3. Reconstruction of the Commercial Paradigm: Autonomous Agent Economics
The combination of AI and blockchain heralds a brand-new mode of economic interaction—the rise of the Machine-to-Machine (M2M) economy. This is not just a change in payment methods, but a fundamental transformation in the nature of economic entities.
Future internet interaction subjects will no longer be limited to humans; billions of Autonomous AI Agents will become natives of cyberspace. Traditional financial infrastructure (such as bank accounts, KYC processes, credit card payment networks) is designed for humans; it does not possess the capability to serve non-human subjects, nor can it meet the demands of high-frequency, micro-amount, 24/7 machine transactions.
Machine-Native Currency Systems: Cryptocurrency is a medium of value exchange naturally adapted to machine logic. AI agents cannot walk into a bank branch to open an account, but they can instantly generate wallet addresses via code and manage private keys. They can utilize stablecoins (like USDC) or specific utility tokens for data procurement, API calls, or computing power leasing. This payment method is not constrained by the intermediary barriers, business hours, or high cross-border fees of traditional finance.
Agent-to-Agent (A2A) Economic Networks: The future commercial landscape will evolve beyond B2B and B2C models toward an A2A (AI Agent-to-AI Agent) 🤖model. For example, an AI Agent responsible for itinerary planning may need to purchase real-time data from another Agent responsible for weather forecasting and pay a deposit to a third Agent responsible for ticket booking. These service exchanges involving micropayments and high-frequency transactions are only economically feasible when relying on high-performance, low-friction blockchain networks. Smart contracts will automatically execute these complex business logics without human intervention.
Synergy with Decentralized Physical Infrastructure Networks (DePIN): The operation of AI requires massive amounts of computing power (GPUs) and data. Through DePIN networks (such as io.net, Render, Gensyn), AI Agents can directly lease idle personal or corporate computing power globally and settle in real-time using Tokens. To a certain extent, this breaks the monopoly of centralized cloud service providers (AWS, Google Cloud), reducing the operational costs of AI. It also provides real utility scenarios for blockchain (although initially, the core source of computing power may still come from traditional giants, in the long run, this model will empower market autonomy and gradually dismantle absolute monopolies).
It is foreseeable that while human users conduct daily mobile payments, AI Agents will automatically complete massive value exchanges on backend blockchain networks, forming a colossal and efficient shadow economy.
4. Crypto: The Value Carrier and Symbiotic Engine of Ownership in the AI Era
Blockchain is not just a database; it is a value network. After clarifying the technical level of anti-counterfeiting/provenance (Section 2) and the commercial level of agent interaction (Section 3), we must delve into the core of assets and finance. Property Rights are the prerequisite for transaction and pricing. In the "infinite supply" model constructed by AI, relying solely on technical means for "anti-counterfeiting" is far from sufficient. We can use Crypto to truly Tokenize and Financialize these rights, giving rise to the RWA (Real World Asset) concept.
The Token, as the granular carrier of ownership and the lifeblood of equity circulation, constitutes the indispensable digital property rights cornerstone of the AI era. This upgrades AI and Crypto from a simple "tool stacking" to a deep "symbiotic evolution."
Tokenization🪙: Transforming abstract rights into programmable digital assets. Crypto uses NFT (Non-Fungible Token) and SFT (Semi-Fungible Token) technologies to transform abstract intellectual property (IP), ownership, copyright📜, unique datasets, fine-tuned model parameters, or even the ownership of an AI Agent itself into unique, immutable on-chain assets.
IP-NFTs as Value Anchors: Every unique style or original work of a human creator can be minted as an NFT. When AI needs to access these works for training or style transfer, it is no longer a traceless plunder but must obtain NFT authorization through on-chain protocols. Here, the Token is not only a copyright certificate but also proof of the right to earnings. For example, RWA music projects like Opulous and Audius tokenize artists' album rights to share revenue with fans in advance.
Data Assetization (Data Tokens): High-quality data from individuals or companies is no longer a static file but an asset that can be encapsulated into Tokens for trading. Every time an AI model calls upon data, it essentially consumes the rights represented by that Token, thereby generating refined revenue and rights protection.
Crypto: Realizing Immediate Settlement and Circulation of Ownership Value Ownership is meaningless if it is not linked to value distribution. Digital currency provides the only execution layer for equity ownership in the AI era.
Micropayments and Streaming Payments: In the high-speed operation of AI, ownership verification often occurs at the millisecond level (e.g., AI quoting a sentence or generating an image). Traditional fiat currency systems cannot handle such extremely small amounts ($0.0001) and high-frequency copyright revenue sharing. Digital currency (Crypto) enables smart contracts to automatically "stream" revenue to Token holders the instant ownership is verified, realizing a closed loop of "use equals ownership verification, ownership verification equals settlement."
Construction of the Incentive Layer: Why would humans spend energy verifying the authenticity of AI content? Why would nodes contribute computing power to maintain network consensus? Because there is Crypto as an incentive. Tokenomics rewards participants who maintain the ownership system through digital currency, thereby building a self-running trust network resistant to AI attacks. This is also the core value of public chain systems and corresponding projects; the internal circulation or local circulation models of consortium chains and private chains are difficult to generalize to a larger scale.
The Co-Evolution of AI and Crypto: A Double Helix Ascent
AI Needs Blockchain/Crypto: Without the ownership and payment facilities provided by blockchain systems, AI creators and users will easily fall into a dead end of rampant piracy, data exhaustion, and inability to monetize. The smarter the AI, the more it needs clear property boundaries to avoid disputes. The current freshness of AI creation exists because of the accumulation of data and creative sharing over the past decades; when these accumulations are exhausted, whether new creativity can fill the gap depends heavily on the meticulous protection of rights.
Crypto Needs AI: AI creates massive amounts of digital assets and high-frequency trading scenarios, providing unprecedented Utility and liquidity for Crypto.
This symbiotic relationship indicates that Crypto is the "Physics" and "Economic System" of the AI era. The combination of the two will reconstruct the production relations of the digital world, allowing the productivity dividends of AI to be fairly returned to every participant through ownership mechanisms.
5. Risk Governance: The Paradigm Shift from "Moral Self-Discipline" to "Technical Constraint"
Current AI development is highly concentrated in a few tech giants (like OpenAI, Google, Meta), continuing the centralized black-box logic of the Web 2.0 era. In this model, the public can only hope that companies maintain a moral self-discipline of "Don't be evil." However, historical experience shows that centralized power is often accompanied by risks of monopoly, data abuse, and algorithmic bias.
Blockchain technology introduces a governance logic of "Can't be evil," strictly constraining system behavior through open-source code, cryptographic proofs, and mathematical contracts:
Zero-Knowledge Machine Learning (ZKML): As an important branch of privacy computing, ZKML allows verifying through mathematical proofs that the inference process of an AI model was executed according to a set algorithm and has not been tampered with, without revealing underlying sensitive data (such as medical records, financial transactions) or core model parameters. This ensures the transparency and auditability of algorithmic decisions, which is crucial for AI applications in high-risk fields like medical diagnosis and credit assessment, solving the "black box trust" problem.
Moreover, public chains that have experienced multiple bull and bear cycles offer a degree of reputational assurance. #NEAR has fully pivoted to AI as the first AI public chain, while projects like Render have transformed from game rendering to AI computing power. BINANCE:ETHUSD ETH, BINANCE:BNBUSDT BSC, #Solana, Cardano, BINANCE:AVAXUSDT #Avalanche, Algorand, Hbar, BINANCE:CFXUSD #Conflux, and others all have their own unique domain advantages, technical characteristics, and deficiencies. Emerging public chains like #Monad BYBIT:MONUSDT are also facing a new round of tokenomics examinations. Addressing the "VC long-cliff" unlock model that has plagued the primary market in the past two years—where institutional chips are locked, but project ecosystem incentives and airdrops circulate early, leading to heavy selling pressure—the market still needs 1-2 years to verify the balance between their token release curves and ecosystem value capture.
Data Sovereignty and Value Distribution: Addressing the widespread issues of data infringement and "data harvesting" in large model training, blockchain projects can return data ownership to users, allowing them to selectively authorize data for training and receive earnings. This reconstructs production relations, enabling data contributors to receive reasonable value returns through Token economic models, thereby incentivizing a higher quality data supply and avoiding the "tragedy of the commons" regarding data exhaustion.
6. Conclusion: Digital Civilization's Dialectic—Reshaping the Future in Chaos and Order
The essence of Artificial Intelligence tends toward entropy increase—it brings about an explosive generation of information, rapid expansion of boundaries, and future uncertainty. The essence of Blockchain, however, tends toward entropy reduction—it strives to establish immutable contracts, anchor unique factual truths, and solidify execution rules.
A robust digital world cannot be composed solely of vibrant "chaos" or absolutely stable "order." The deep integration of AI and Blockchain is not a simple technological stacking, but the inevitable result of the digital ecosystem seeking dynamic equilibrium. If AI is the nuclear power engine driving digital civilization forward, then Blockchain is the navigation system and safety foundation ensuring it does not derail.
For investors and industry practitioners, understanding this "Double Helix" evolutionary trend means grasping the underlying code of digital economic development for the next five to ten years. Our gaze should not be limited to the AI computing power race but should also extend to the Web3 infrastructure layers that provide payment settlement, property definition, and value circulation for silicon-based life.
The future has arrived. This great convergence, beginning with technology and ending with institutions, is on the eve of explosion.
Disclaimer: This article is for educational purposes only. Projects mentioned are for relatively objective description and do not constitute investment advice. Please perform your own research (DYOR).

#BTCUSDT📊 Possible 4H Scenario for Bitcoin
- Current trend: Short-term bullish momentum.
- Key support: $91,500 (breakdown may trigger correction toward $89,500).
- Key resistance: $95,000–96,000 (breakout could extend toward $98,000).
- Trading idea:
- Bullish scenario: Long positions if price consolidates above $93,000, targeting $95,500–96,000.
- Bearish scenario: Short positions if $91,500 breaks, targeting $89,500.
⚠️ Note: Volatility in the 4H timeframe can cause fake breakouts. Risk management with tight stop-losses is essential.

BTCUSDT Possible LongBTC keep on surprizing us, here is a possible long on the 1 hr (RR =1-2) always wait for a clean full body breakout and I ususally go break even once RR 1-1. Midweek reversal that use to be on Thursday seems like moved more towards Friday, I will become bullish on BTC once we close weekly above $92 000-$93 000 Best of luck to all and please feel free to leave you comments and ideas.(This is no financial advice)

Two main bullish options on BTCI see a couple bullish options on BTC currently still. I like the expanded flat version more becuase the reality is that over this year its felt more like a bear market than a bull market. The alt coins show that clearly. However the 5th wave blow off still makes a lot of sense given the lidquidity dynamics and the extension on the typical 4 year cycle into a 5 year cycle. Time will tell.

Several reasons why the 98k range is not being touchedBitcoin stabilizes a safe zone between two points, 98800 (upper vertex) and 93910 (lower vertex). As long as the price does not fall below 93910, Bitcoin can clear lower levels such as 87, 85, and even further down to identify and eliminate reversal zones.
The intermediate reversal point in this process is 92790; meaning if a correction or pullback occurs around 89, the reversal is expected to extend up to approximately 92790. This structure allows traders to analyze the drop confidently and assess the probability of a price reversal based on these levels.
Therefore, maintaining the price above 93910 is crucial for clearing lower levels with the aim of a strong and reliable rebound while preserving the safe zone within this range.

BTCUSDT.P - December 4, 2025Bitcoin is in a short‑term uptrend on the 15‑minute chart, respecting a rising trendline from the recent swing low and currently pausing in a shallow pullback after an impulsive advance. Price is trading just above a key support band around 90,500–91,000, with a higher consolidation zone projected near 96,000–97,000 and major resistance and upside target identified in the 113,000 area. A clean bounce from the trendline and a sustained move above 92,000–93,000 would confirm continuation momentum toward the 96,000–97,000 range, while a decisive break below the trendline and 90,500 would invalidate the immediate bullish structure and open room for a deeper retracement toward 88,500–86,500 before any new long setups are considered.


BTC/USDT Analysis — Strong Buyer Steps In
Hello everyone! This is the CryptoRobotics trader-analyst, and here is your daily market review.
Yesterday Bitcoin surprised the market. After reaching the upper boundary of the $84,000–$82,000 buyer zone (volume anomalies), it printed a primary bounce. The movement was developing weakly at first, and we expected a deeper liquidity sweep. However, the market buyer acted much more aggressively: he broke through the key sell zone at $89,800–$90,800, shifting the priority direction to bullish.
We are now approaching the important resistance zone at $94,000–$97,500. A correction from this region is likely, and it may provide an opportunity to join long positions with extended targets from $100,000 and higher.
Buy Zones
$91,000–$89,800 (mirror volume zone)
$84,000–$82,000 (volume anomalies)
Sell Zones
$94,000–$97,500 (volume zone)
$101,000–$104,000 (accumulated volumes)
$105,800–$106,600 (local resistance)
This publication is not financial advice.

Will it continue?Around September 2022 I drew two potential paths for what I thought bitcoin would do. So far one has been almost identical to bitcoins actual chart. Will it continue?

Back in the stress test area againLooking at the 4-hour chart, the liquidity trend is still too strong. Let’s see if it can stay above 93,200 for the next 3 hours. If it holds, we can buy without hesitation. If not, we’ll sell.

BTC 4H AnalysisBitcoin is at important resistance zone right now.
Once it break the level upward we might see new levels as drawn on chart.
NFA DYOR

BTC 4H – Complete Technical Analysis & Trade PlanMarket Structure
BTC is still in a macro downtrend, continuously creating Lower Highs (LH) along the descending trendline.
Recent bounce from 87,766 formed a Higher Low (HL), but structure remains bearish until price closes above 93,080.
Key Levels
Resistance / Liquidity Above:
93,080 (Major LH + liquidity cluster)
98,888
107,473
116,380
Support / Liquidity Below:
87,766 (HL)
83,786
80,600
Pattern & Trend
Price is compressing inside a symmetrical triangle, between:
Descending trendline resistance
Ascending demand trendline
This signals a volatility expansion soon.
Indicators
RSI: 65 → bullish momentum but approaching overbought zone.
Previous bullish divergences have played out.
No fresh bearish divergence yet.
Volume
Impulse buying was strong, but volume faded near resistance.
This warns of a potential rejection unless a breakout happens with high volume.
Next Likely Move
BTC likely sees:
A pullback from the 93k resistance
Into the 90k–89.5k region
Then a decisive move based on trendline reaction.
Break above 93,080 = trend shift.
Break below 87,766 = continuation down.
High-Probability Long Setup
Condition: Breakout + retest of 93,080
Entry: 93,200–93,300 on successful retest
SL: 91,300
TP1: 98,888
TP2: 107,473
TP3: 116,380
RR: 2R to 7R
Confluence:
Break in structure, break in trendline, liquidity sweep, volume expansion.
High-Probability Short Setup
Condition: Rejection from descending trendline + 93k zone
Entry: 92,800–93,000
SL: 93,800 (above liquidity)
TP1: 90,000
TP2: 87,766
TP3: 83,786
TP4: 80,600
RR: 1.8R to 7R
Confluence:
Trendline resistance, LH zone, fading volume, liquidity above price.
Summary
BTC still bearish until 93,080 breaks.
Market in compression phase.
Large move coming soon.
Best setups:
Break-and-retest long above 93,080
Rejection short from 93,000

Full Double CycleDouble Bottom completed, now going to break and form Double Top.
See ya guys at the Top.

Bitcoin Analysis- Back Inside the Bullishh Channel📈 Bitcoin Analysis – Back Inside the Bullish Channel
After Monday’s sharp overnight drop, Bitcoin has shown a strong recovery, pushing back into the ascending channel and respecting its structure. Price has returned to the same zone where it was before the collapse, signaling that buyers are still defending key levels.
Technically, BTC rejected the midline of the bullish channel, failing to break above it—suggesting a possible need for a healthy pullback before continuation.
My preferred scenario remains a retracement toward the 92,000 support zone, which aligns with:
The lower half of the rising channel
A local demand zone from last week
The 0.382–0.5 Fibonacci retracement cluster of the recent recovery leg
From this area, I expect renewed bullish momentum as long as 92,000 holds.
🔍 Added Technical Factors
Higher lows remain intact despite volatility.
Volume on the recovery move was positive, indicating real demand.
The RSI on H4 is cooling off, supporting a potential pullback.
BTC continues to trade above the 50 EMA (H1)—short-term bullish bias.
🌍 Added Fundamental Factors
Risk appetite increased globally after softer U.S. inflation data, boosting crypto sentiment.
Fed officials continue hinting at possible rate cuts in early 2025, keeping BTC supported as liquidity expectations rise.
ETF inflows remain net positive, though slower this week—still a constructive long-term driver.
Reduced on-chain selling pressure from miners following difficulty adjustments helps stabilize price action.

Times are changing.Monthly change of color with well below zero selling volume. Haven't seen this in a while.

BTC & Crypto Winter 2.0 - The Foundation Cracked on 10.10.25The Setup
While everyone's celebrating Bitcoin near all-time highs and institutions piling in, I'm seeing something different. The market's telling a story most people are missing.
What Happened October 10th
No news. No warning. Just a massive liquidation cascade that wiped out every leveraged trader in one move.
The damage:
All leveraged positions liquidated
Traders gone for good - no capital left to rejoin
Zero-sum game: someone collected all that money
Bid support disappeared overnight
This wasn't natural price action. This was a reset.
The Missing Bids
Here's what people aren't seeing: those liquidated traders provided bid support. They're not coming back. They have no money to trade with!
In futures, it's always zero-sum. Their losses became someone else's gains. But those traders? Done. The bid side just lost a massive chunk of participants.
The MSTR Problem (Barings Bank 2.0)
While indices hit all-time highs and Nasdaq rockets with no pullbacks, MSTR is 50% off its highs.
The numbers:
$7.26B in debt
Net income: -$4.22B (negative margin of -3,797%)
Revenue declining: $496M (2023) → $463M (2024)
Free cash flow 2024: -$66.51M (-780% change)
Operating income: -$63M
Total debt jumped from $0 (2019) to $7.26B (2024)
This is Nick Leeson buying Nikkei at the 40-year top all over again.
Leeson doubled down with borrowed money, hid the losses, and collapsed Barings Bank - 233 years old, destroyed in weeks.
Saylor's doing the same thing. He's leveraged MSTR to buy Bitcoin near tops while the actual software business bleeds cash. When BTC cracks, he's holding $7.26B in debt on an asset that could drop 70-80%.
The market knows: MSTR trading 50% down while everything else moons tells you what's coming.
The Privacy Trojan Horse
Everyone bought the "privacy from government" narrative.
Reality?
Every exchange requires passport + bank statements
Every transaction is traceable
KYC everywhere
The surveillance they promised to escape? They delivered it.
People bought freedom, got tracking.
Why Crypto Winter is Coming-
The setup:
October 10th removed all leveraged bid support
MSTR overleveraged at $7.26B with a dying business
Indices at all-time highs (distribution phase)
Retail bullish at the top
No new bid support to replace liquidated traders
The parallel:
When indices correct, Bitcoin doesn't hold. It leads the crash. And this time, there's no leveraged traders left to provide support on the way down.
The Trade
Short Bitcoin
Entry zone: I am not your mom, use your own head
Target: Look at the picture
Stop: You should now this before getting into positions
Thesis: Foundation cracked Oct 10th, MSTR collapse incoming, no bid support
Risk factors:
Could go higher first (blow-off top)
Saylor could sell equity to cover debt (temporary support)
New institutional buyers could provide bids
Confirmation signals:
MSTR breaks down further
Bitcoin fails to make new highs while indices continue up
Volume declines on rallies
Final Thought
Everyone's watching Michael Saylor pump Bitcoin on Twitter while his company's financials look worse than pre-2008 subprime lenders.
The October 10th liquidation was the warning shot. The foundation cracked. We're just waiting for Bitcoin to catch up to what MSTR's price is already telling us.
MSTR is headed to zero. Bitcoin is headed to crypto winter.
This is not financial advice. Do your own research. Markets can remain irrational longer than you can remain solvent.

Bitcoin at the daily target: what comes after 93,092?This analysis is based on the Initiative Analysis (IA) method.
Hello traders and investors!
On the daily timeframe, Bitcoin has formed another confident buyer absorption — and this absorption was simultaneously a manipulation (a false breakout) of the 86,116 level.
Notably, the seller’s candle appeared with increased volume, and the subsequent absorption created a new buyer zone.
The buyer target within the current range — 93,092 — is almost reached.
Given the strength of buyer initiative, further movement toward 94,000 or even 97,000 cannot be ruled out.
However, once the price reaches 93,092, it is reasonable to expect seller initiative.
This is classic market behavior near a target: some buyers take profit while sellers get an opportunity to step in.
Wishing you profitable trades!

BTC Bullish Divergence: Eyeing 97,365 After 1h Break Above 91,58Bullish RSI divergence formed. BTC closed a 1h candle above the previous resistance at 91,580 and may move toward the 50% retracement at 94,283, with potential extension to 97,365 depending on price behavior. Trading involves risk, so manage positions carefully and be prepared for volatility
