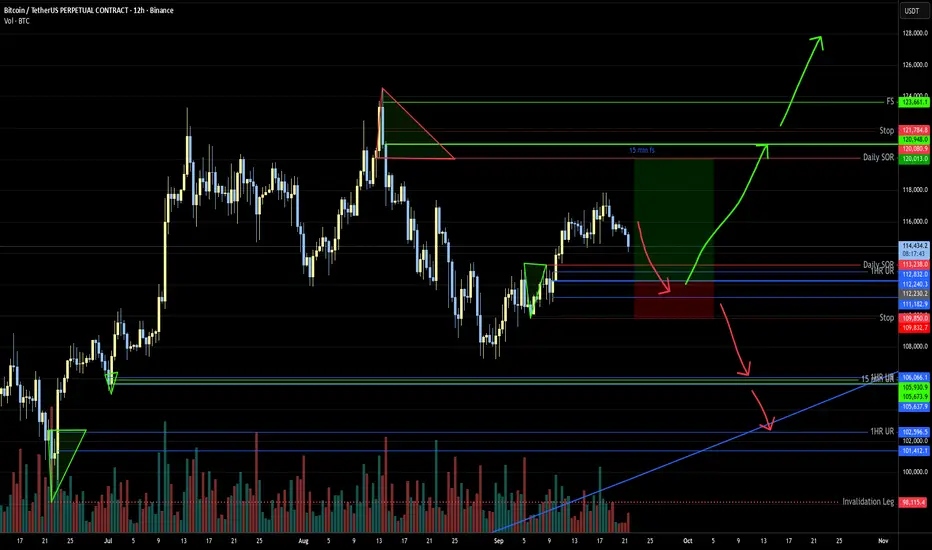
BTCUSDT.P - September 23, 2025$100,621.3 – $107,211.5 are ideal DCA zones before we push toward $130,000 by year-end; plan your trades accordingly.
BTCUSDT.3S trade ideas

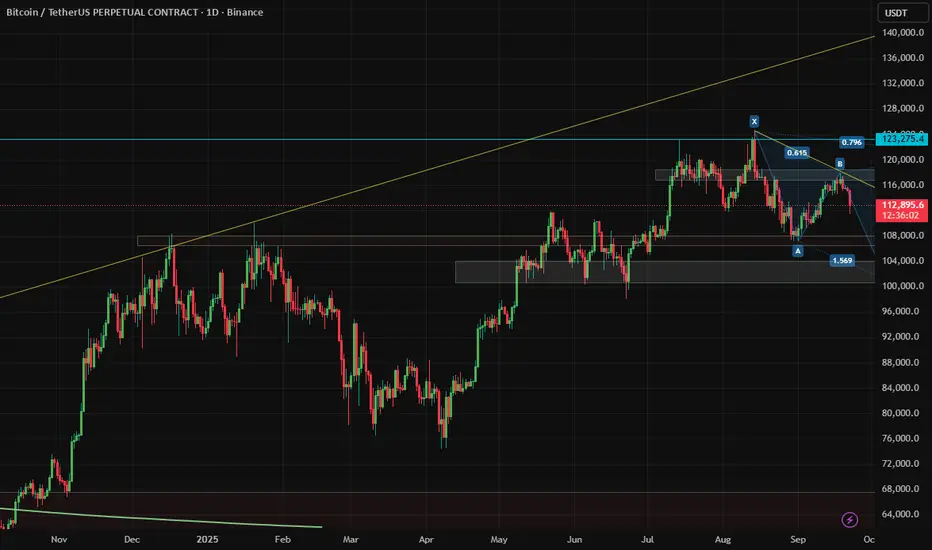
BTCUSDT 1D Rising Wedge PatternBitcoin is prepared to dump lower in my opinion and is looks to risky to buy now.
If you like my technical analysis idea, please like and follow for more.
Thank you

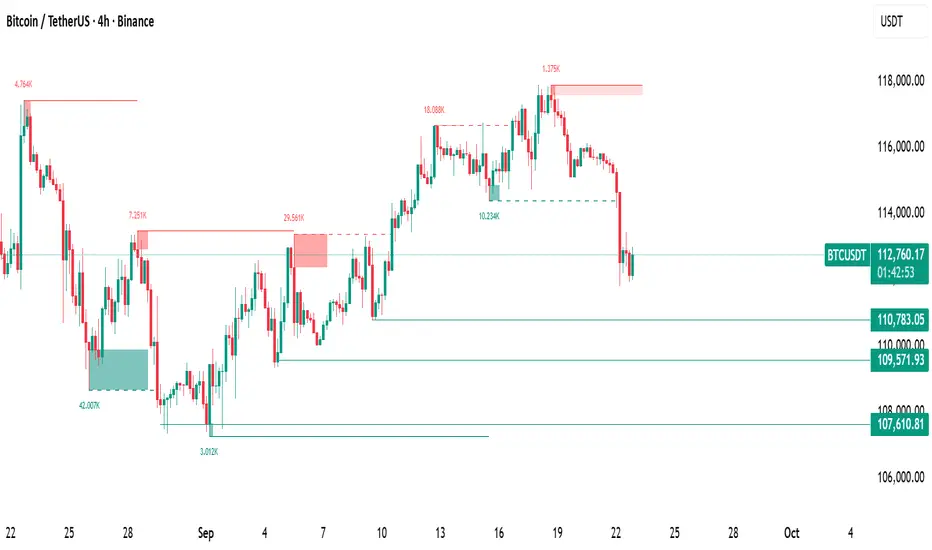
Bitcoin Price next WeekThe major concern for the bulls is that the immediate liquidity is still on the downside, near $110,000 price mark. This makes it an attractive magnet if the price stays bearish.
More here:
www.cointrust.com
Uptrend is around the cornerBullish Case (Long-Term): The long-term trend for BTC is strong and upward-trending. The break above the $106,000 resistance level is a significant technical event that could precede a sustained rally. For traders with a longer-term perspective (weeks to quarters), the overall assessment remains "Positive."
Bearish/Cautionary Case (Short-Term): The recent price drop and the "Sell" signals from various oscillators suggest that a short-term correction or consolidation period may be in progress. This could be a reaction to the medium-term "overbought" condition identified by the RSI being above 70. Short-term traders should be mindful of the volatility and potential for further downward movement toward the nearest support levels.

BTC Update📊 CRYPTOCAP:BTC Update
After forming a bearish Head & Shoulders pattern, BTC moved down and is now testing a new support level. ⚠️
If this support breaks, the next move could be a breakout of the blue support zone, with the first target at the green line level. 📉

BTC 4H Analysis - Key Triggers Ahead | Day 45😃 Hey , how's it going ? Come over here — Winter got something for you!
⏰ We’re analyzing BTC on the 4-Hour timeframe.
👀 On the 4-hour timeframe, Bitcoin formed a lower low followed by a lower high and lost its key support around $115,115 at the start of the new week, pushing price further down. Currently, BTC is testing support at $112,500, and if this level breaks, it could move toward lower supports.
🧮 The RSI oscillator shows that BTC fell below the 40 level toward oversold territory, triggering significant selling pressure. Bitcoin is now attempting to stabilize above the 30 level. If it fails, further downward movement is likely.
🕯 Red candle sizes and volumes have surged sharply at the start of this week, generating considerable FOMO in the market. If a large candle forms, it is likely to be bearish. The key question: will buyers step in to defend Bitcoin at this level?
🧠 Focus on short positions; long positions are removed for now.
A break of the current support could trigger additional short opportunities.
Watch the RSI carefully: if it exits oversold in the higher timeframe, short positions can be opened with more confidence. RSI acts as a multi-timeframe indicator, helping indicate market direction.
❤️ Disclaimer : This analysis is purely based on my personal opinion and I only trade if the stated triggers are activated .

Bitcoin's $1B Liquidation Nightmare—What's Next?Dive into Bitcoin's wild $1B liquidation chaos triggered by Powell's rate speech! From the half-point cut hype to the market's "holy sh*t" moment, I break down the events, lessons on money management, and why doing nothing might be your best move today. Full analysis inside—watch now! If it clicks, give a thumbs up and follow for more crypto insights.

Whatch out for BTC ANOTHER DUMP!!! I hope I'm wrong but in this situation usually another leg forms, it seems it's going down.

Trading plan for BitcoinLast week, the price reached our first two targets before entering a correction. At the moment, the price has shown a strong drop and already broke through the 0.5 Fibonacci level.
In the near term, I expect a gradual correction into the 114,000–114,800 area. The resistance zone lies in the 115,100–115,500 range — if it breaks, bullish momentum will return, and we could see further growth with a breakout of the 117,800 local high.

DOWNTREND just hit us. I've closed my Long and went ShortHey members, by adding the second band of the Gann Tool in for context I see that price no longer wants to go up....
Telling us we are in a DOWNTREND which means lower highs and lower lows
This means if you caught my call up on this transition, now is the time to close it (if not closed already) then open up a Short position and ride the price to below $107k
(dont take the trades unless you fully agree with me)

Bitcoin | Falling Wedge Breakout – Bulls Eye $123K📖 Bitcoin has been consolidating inside a falling wedge on the 4H timeframe.
A breakout has just occurred, with the first target zone near $117,000.
Multiple CHoCH + BOS signals hint at a possible bullish trend reversal.
If momentum holds, upside continuation toward $123K is on the table.
🔹 Invalidation: Below $107K (wedge low).
🔹 Confluence: Liquidity sweep + market structure shift.

BTC: Don’t Panic — The Bull Market Isn’t Over YetMaybe you’re scared right now, thinking Bitcoin is crashing, the market is over, and there’s no more altseason ahead. But don’t jump to conclusions so fast — one candle doesn’t end the market.
👉 In my view, as long as BTC doesn’t make a lower low below $107,394, the bullish trend is still intact.
🚫 Don’t fall into the trap of panic sellers. Usually, when everyone is afraid and thinks the market is doomed, that’s exactly when the next move starts — and if you panic, you’ll miss it.
⏳ My plan: I’ll wait and see if this whole drop reverses quickly. If not, then maybe we’ll enter a ranging phase for a while. But my overall bias stays bullish.

Short: BTC Liquidity SweepIdea: Short
Conviction Medium
Bitcoin rejected off its highs on the daily timeframe and is currently stalling from the golden pocket fib retracement level. There are many equal lows and a daily FVG gap below which I think could be a magnet for price. Entry condition is a sweep of last week's high, stop loss at the range high.TP targets are the equal lows and daily FVG shown on the chart.

BTCUSDT – 4H Harmonic pattern📉 BTCUSDT – 4H
Harmonic pattern reacting bearish from D.
Trendline break → upside losing strength.
🔺 Resistance: 115K–116K
🔻 Support: 111K–112K → 105K–107K
✅ Main view: correction extends to 105K–107K
⚠️ Only a strong break above 116K opens bullish continuation.
❌ Not financial advice.
BTC Daily Wave Check🌊 BTC Hangin’ at a Crucial Wave
📊 Current Setup
BTC’s chillin’ around 112.7k after sliding off that bounce. We already saw the uptrend line snap, but bulls are throwin’ down an inverse H&S attempt (check the arrows + curve).
🚦 Scenarios
👉 If price holds that 112k–114k support box, this wave’s still got juice for a bullish flip 🚀.
👉 But if that zone cracks, momentum could get sketchy fast and bears might drag us deeper.
🧭 My Take
This level’s the line between catchin’ the wave or wipin’ out 🏄♂️. I’m watchin’ to see if bulls can keep their balance here.
❓ What’s Your Read?
Are we about to ride this reversal wave, or do you see the tide pulling lower? Drop your vibe below 👇

Analytics: Market Outlook and Forecasts
📈 WHAT HAPPENED?
Last week, Bitcoin spent most of its time trading sideways. Towards the end of the week, there was a long entry, and Bitcoin reached the resistance zone of $117,500-$119,000 (accumulated volumes).
There was a rebound from this range, but we didn’t observe any selling initiative. Therefore, the scenario was based on a repeated, deeper filling of the aforementioned zone. However, the situation took a different turn.
Tonight, there was an impulsive breakout of two support levels. Below one of them, a large number of liquidations were released, leading to the formation of a new key volume support point and disrupting the long-term trend structure.
💼 WHAT WILL HAPPEN: OR NOT?
It’s important to closely monitor the buyer's reaction.
Today, we may see a resumption of buys and a test of the mirror sales level of ~$113,800 (market imbalance). This may be followed by a re-test of the current volume anomaly zone.
If the $113,000-$112,400 zone is successfully defended, there is a possibility of recovery to the $116,000 level. However, the focus remains on sales.
Alternative scenario: test of the buyer zone below the level of $111,600-$110,500 (accumulated volumes) and the development of a local sideways pattern between the two nearest volume zones.
Buy Zones:
$111,600–$110,500 (accumulated volume)
~$108,400 (cluster anomalies)
$108,000–$102,500 (accumulated volume)
Sell Zones:
~$113,800 (market imbalance, mirror zone)
$115,000–$116,000 (accumulated volume)
$118,000–$119,000 (accumulated volume)
$121,200–$122,200 (buy absorption)
📰 IMPORTANT DATES
This week, we expect the following macroeconomic events:
• September 23, Tuesday, 13:45 (UTC) — publication of the US Manufacturing and Services PMI for September;
• September 23, Tuesday, 16:35 (UTC) — speech by US Federal Reserve Chairman Jerome Powell;
• September 24, Wednesday, 14:00 (UTC) — publication of US August New Home Sales data;
• September 25, Thursday, 7:30 (UTC) — announcement of the Swiss interest rate decision;
• September 25, Thursday, 8:00 (UTC) — press conference of the National Bank of Switzerland;
• September 25, Thursday, 12:30 (UTC) — publication of the US GDP for the second quarter of 2025 and the number of initial applications for unemployment benefits in the US;
• September 25, Thursday, 14:00 (UTC) — publication of data on US second-hand housing sales for August;
• September 26, Friday, 12:30 (UTC) — publication of the US basic price index for personal consumption expenditures for August.
*This post is not a financial recommendation. Make decisions based on your own experience.
#analytics

BTC - WEEKLY OUTLOOK - ON POINT!!#BITCOIN - Weekly Outlook 🚨
Mastercall again! 🔥
As expected, we saw a solid rejection with a dump towards the $112,000 mark mentioned in my previous outlook ✅🎯
H1 trend: Still bearish in the short term 📉Price action remains weak below key resistance zones.
Key support to watch:
🔸Primary support: $110,500 – $110,000
🔸Clean break below $110,000 (with volume) could trigger a sharp move down toward $107,000+
However, the broader trend remains bullish on the weekly and monthly timeframes.
Above $110,000, bulls retain control according to my previous updates. A consolidation above $110,000 would be a positive signal for #alts recovery.
Scenarios:
⚠️ Loss of $110k support = possible accelerated drop to 107k+
🟩 Hold/Consolidation above $110k = base for #alts to rebound
Stay nimble, manage your risk!

BTC 17.09.25I'm seeing descend marked maker involvement in this current range. If this does not get invalidated by the FOMC meeting later, i'm looking for a potential distribution in this area, which grabs liquidity and reaccumulates. I would want to see a demand mitigation followed by a slow move up to create a good looking liquidity trail to the downside. This could be the beginning of a bigger distribution that creates a lower high on BTC, but thats for the future.

#BTCUSDT 12H ChartPrice moved down and swept the support at around 113k and it is currently bouncing off the 200MA. MACD turned bearish, RSI is sold and EMAs are neutral. If price breaks below the 200MA then i would expect it to sweep the liquidity below the support line at around 110k as a short-term target.

Bitcoin BearishI have no time to do all the analyst, but I feel the price will go down below $100,000 before bullish

Bitcoin & Bullish DivergenceBitcoin is retracing to 61% of the Fibonacci level from 107k to 118k, forming a bullish divergence on the 4-hour RSI, which should push the price to higher levels.

BTCUSDT PREDICTION_20250922Core PCE index announced on Friday will be a crucial news for Bitcoin achieve new price

Bitcoin Overall: Smaller decline likelyHope you are well!
It's likely BTC will eventually decline to the indicated buying area. I have constructed a balanced trade for a long at this region. This region could easily take price to new ATH, especially if price declines slowly with lots of corrective activity.
While it is possible to decline further to one of the other regions, I don't think the probabilities for this are as high