Bitcoin Next hurdel is waiting Hello trader's
Here is your bitcoin chart explained with all levels
work accordingly and read the chart form your own
learn the market & trade with it ..
Trade ideas

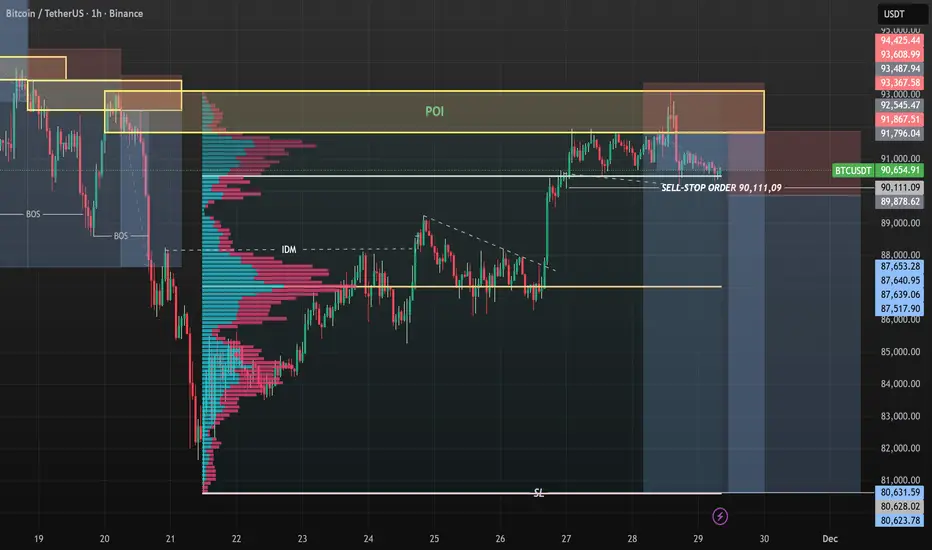
SELL-STOP ORDER ON BTCUSD......BTCUSD completed +1,900pips from my yesterdays analysis predictions today we have the price making strong rejections at the VAH on the Volume profile chart am looking forward to see price make a breakout the downside to take out the liquidity to sell down to new lows
Lets take or see your thoughts on this.....
BTCUSDT - What's Next? Bullish is over???BTC Daily & 4H Outlook
Bitcoin is showing mixed signals across the 1D and 4H timeframes. On the daily chart, BTC failed to hold the strong support zone and has now officially flipped it into a resistance. The drop also swept liquidity down to the 80.600 area before rebounding from the daily OB, which gives us a temporary relief bounce. Right now, price is pushing upward and may retest the resistance/supply zone above.
If BTC rejects strongly from that resistance, the market could be in trouble again because the downside target reopens toward the 83k–86k region. This area becomes even more important when we look at the 4H chart, where we still have a key support between 85.650–85.000. This zone must hold—if it breaks, then 83k becomes likely, and a worst-case scenario returns us to the 80k sweep zone.
For BTC to reclaim momentum and shift into a bullish structure, the market needs to break out above the major supply at 93.240. A clean breakout and confirmation would show strength and could trigger the next leg toward 98k–100k. If that happens, we may also see a strong positive impact on altcoins.

BTCCRYPTOCAP:BTC is forming a clean inverse head and shoulders pattern. If it breaks the neckline, the target sits near $150K. Based on structure, momentum, and higher time frame positioning, I think this outcome is very likely and entirely possible in the coming months.

BTCUSDT.P - November 29, 2025Bitcoin is trading in a sideways range after a sharp rejection from the 92,900 resistance area, with intraday structure showing lower highs capping price under the 91,200–91,300 band.
A key support shelf sits around 90,200–90,400; holding above this zone could fuel a range breakout back toward 92,900, while a decisive close below it would confirm a bearish rotation and expose the lower support region near 89,000.

BTC. End of correction long.Only if we can take the 94.6 level the true long confirmed. Otherway it flat between 85 -95 +/-

Chart Analysis: BTC / USDT (Weekly Timeframe)Pattern: EMA Retest (Potential Breakdown Risk)
The chart shows Bitcoin (BTC) facing notable bearish pressure after recent highs. Price is currently testing the 50-week EMA, a historically important support zone that has previously triggered strong bullish rebounds. However, current momentum shows weakness as sellers dominate.
Key Observations
🔹 Support Zone: Around $100,900 (50 EMA) — acting as critical dynamic support.
🔹 June Low Support: Near $98,200, the next major level to monitor.
🔹 Bearish Candle: BTC down nearly 8% for the week, showing strong selling pressure.
🔹 Bull Bear Power (BBP) Indicator: signaling that bearish strength outweighs bullish demand, and selling momentum remains strong.
🔹 Previous Bounces: The last two retests of the 50-week EMA (circled) led to solid recoveries, but this time, price action looks weaker and sentiment more cautious.
Potential Move
If BTC fails to hold above the 50-week EMA, further downside targets could be:
🎯 Target 1: $95,000
🎯 Target 2: $90,000
Conversely, a strong bullish reaction from the 50 EMA may spark a rebound phase and signal renewed accumulation.
Summary:
Bitcoin is currently at a critical support retest on the 50-week EMA. The Bear Power indicator suggests growing downside pressure, and a weekly close below $100K could confirm a deeper correction. Holding this zone, however, might preserve the broader uptrend.
#Bitcoin #BTC #BTCUSDT #CryptoAnalysis #TechnicalAnalysis #TradingView #CryptoTraders #CryptoMarket #BullBearPower

BTC SHORT TO 90K THEN BOUNCE TO 91,500Looking for a small move to the down side and then a bounce up to $91,500.
Liquidating both Long and Short positions.

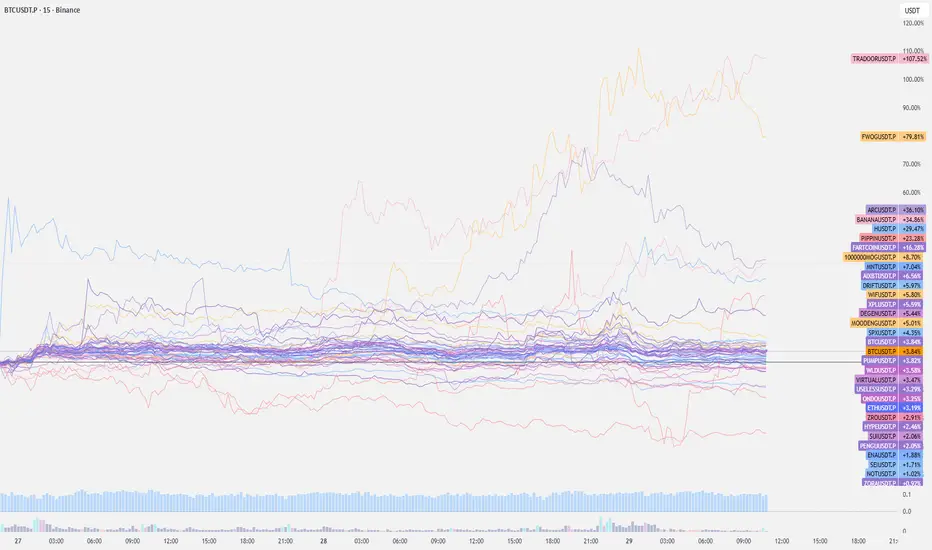
Altcoins - A Shift in Plain SightOne thing that stands out lately is how several mid-caps and low-caps have started to drift above CRYPTOCAP:BTC on relative performance. When BTC sits in the middle of the pack while pockets of alts are steadily printing higher % moves, it usually hints at a rotation brewing.
This kind of spread normally shows up when:
- BTC cools off or ranges after a strong move
- Liquidity becomes more comfortable chasing risk
- Traders start searching for higher beta plays
- Early bids creep in across multiple alt sectors at the same time
You don’t need a breakout or a big narrative to see it — the relative strength alone is a decent tell. When alts cluster above BTC while the rest flatten out, it’s often the first sign that the market is prepping for an alt window.
It doesn’t guarantee a full-blown alt season, but historically this type of structure gives a decent shot at short-term relief rallies or sector pops, especially if BTC remains stable and doesn’t nuke volatility across the board.
For now, the key read is simple:
If you see BTC is no longer the top performer in the group. When that happens, attention tends to rotate outward — and alts usually breathe.
BTCUSD _ Daily
Fake breakout or starting a range!
Price reacted on the resistant area on lower timeframes, expected to touch the resistance line again in near future.
BTC/USDT: Potential Uptrend and Buying OpportunityBitcoin is creating a buying opportunity as it continues to follow a clear uptrend channel. With support from macroeconomic factors and positive momentum from the cryptocurrency market, BTC/USDT has the potential to move upward strongly.
The chart shows that BTC is currently moving within an uptrend channel, supported by the EMA lines. The recovery from the recent bottom around 86,700 USD and the price moving closer to 91,000 USD indicates that the market is starting to regain upward momentum.
Looking at the current price levels, BTC is approaching an important resistance level at 95,500 USD. If this level is broken, the uptrend could extend, pushing the price to higher levels, potentially reaching 100,000 USD. However, if BTC fails to break through the 95,600 USD level and pulls back to test the 86,700 USD support, this would provide a good buying opportunity before continuing the uptrend.
In summary , BTC/USDT is currently on a strong uptrend, and the buying opportunity remains as the price adjusts back to key support levels. Watch the 86,700 USD level as an ideal entry point to take advantage of the upcoming strong rally.

BTC – Why this 25–30% drop doesn’t surprise me (what's next)After making a new ATH above $126k in early October, BTC is now trading around $90k – roughly 25–30% below the highs. On the 4H chart it’s a clean downtrend: lower highs, lower lows, and a break of the prior support zone in the mid-90k area.
For me, this isn’t just “random FUD” – it’s a mix of macro, flows and positioning all lining up:
---- Macro / narrative shift ----
Earlier in the year BTC traded as a “Trump trade”. Recently that narrative has been shaken by tariff headlines and policy uncertainty, while capital attention also rotated toward AI after the Genesis Mission executive order. Less confidence = less appetite for chasing BTC at extremes.
----Spot ETF + on-chain flows ---
U.S. spot BTC ETFs have seen around $3.8B of net outflows in November, removing a big source of steady demand. At the same time:
A Satoshi-era wallet (~12k BTC, ≈$1.4B) moved coins to exchanges.
On centralized venues (especially Binance) we’ve seen billions in net inflows, which usually means more inventory available to sell.
---- Leverage flush-----
The violent October selloff already triggered a record liquidation event (≈$19B in 24h). What we’re seeing now looks like the second phase: spot selling + de-risking after the leverage was washed out.
----- Levels I’m watching on the 4H chart-----
1 - Resistance: 92–93k – former support, now capping bounces.
2 - Support: 80–82k – recent reaction zone, roughly around the 0.618 retrace of the whole bull leg.
3 - Lose 80k convincingly and 70k starts to open up as the next big “magnet” area; reclaim and hold above 93k and we can talk about a deeper relief rally.
Not financial advice – just how I’m trying to connect price action with flows and macro instead of blaming every red candle on “whales” only.

THE TREND IS YOUR FRIEND As much as we can see buying activity erupting, we should be aware that the BULL run is over and allow the trend line guide us to the best entries where the bears are waiting

Correction CompleteBTC should now hit our targets of 65.9k next
Other noteable supports are 59k and 57.1k
and finally, 48.2k (but I don't think this will happen for a few months)

Watch Out! $BTC Trap Ahead!CRYPTOCAP:BTC 1H & 30 mint trend is still bullish, but on lower TF it has shifted to bearish. Be careful don’t get trapped by a small weekend pump.
Wait for my next update

Bitcoin: The Downtrend Begins Just as the title suggests, this is where Bitcoin is poised to fall once more.

BTCUSDT 4hr TF - 29th November 2025BTC USDT 4hr TF
As Long as price action remains above the mention support line can expect price to go further up as MACD has flip bullish on daily TF

My thoughts on BTC and the Market. $200K BTC looms on 2026.My thoughts on Bitcoin for 2025 yearly close and 2026. Covering TA, Macro, bullish signals, bearish signals and more.
Do you agree or disagree?

The god of fractal draw thisORVIBE STRATEGY
A new model thinking
New analyses and …
ORVIBE.
BE THE LIGHT!

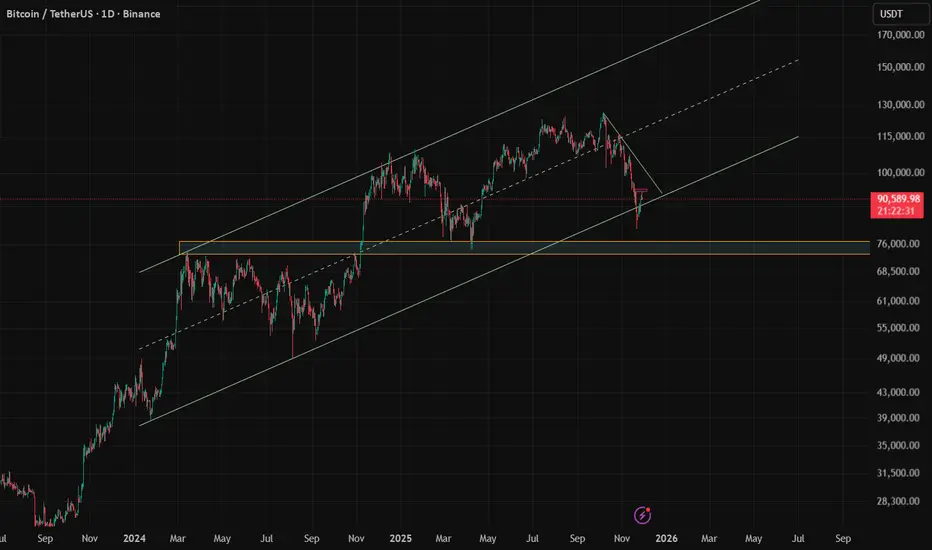
BTC Major trend Bitcoin on the weekly timeframe is currently resting on four zones starting from March 2020 until now in late November 2025, and this is a strong indication of the strength and stability of the upward trend.
The 125K area is considered important to break with strong trading volume.
For more deep analysis flow me on Clubhouse
This is not financial advice.

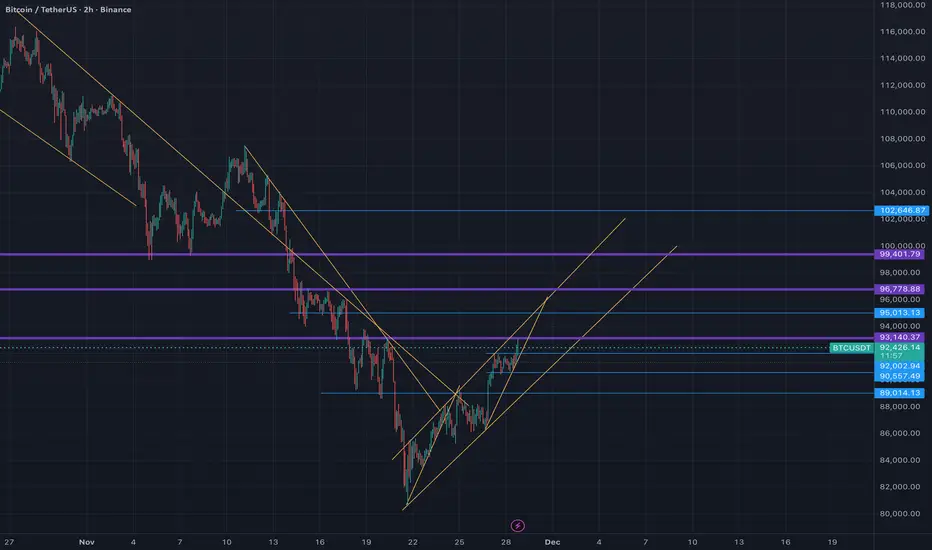
Falling Wedge on the 2H Timeframe: Is a Bullish Breakout BrewingHey TradingView community,
I’ve been closely monitoring Bitcoin’s price action amid this volatile November, and the 2H chart is painting an intriguing picture. After a sharp correction from October’s all-time highs above $126,000, BTC has been grinding lower, but it’s now forming a classic falling wedge pattern – a setup that’s often a precursor to bullish reversals in downtrends.    Check out my screenshot below for the details.
Key Observations from the Chart:
• The Pattern: We’ve got a descending resistance line connecting the lower highs since mid-November, paired with an ascending support line from the recent lows around $88,000-$90,000. This compression is typical of a falling wedge, where selling pressure diminishes, setting the stage for an upside breakout. If it holds, we could see a snap higher, similar to how these patterns resolved in past cycles.  
• Support and Resistance Levels:
• Strong support cluster at $92,000-$92,500 (current price action bouncing here) and lower at $89,000-$90,000, which has acted as a demand zone multiple times this month. 
• Overhead resistance at $96,000-$97,000 (prior highs), with a breakout potentially targeting $100,000-$104,000 based on the wedge’s measured move. On the flip side, a breakdown below $89,000 could open the door to $80,000 or even lower, as some analysts warn of deeper corrections.   
• Momentum Indicators: Volume appears to be drying up in the wedge, which is bullish, and RSI is hovering near oversold levels (around 30-40 on higher TFs), hinting at a potential rebound. No major divergences yet, but watch for one on the next leg down.
Market Context:
November 2025 has been a bloodbath for Bitcoin, with a 33% drop from peaks amid overleveraged longs getting flushed and broader macro pressures.  However, on-chain data shows accumulation by whales, and BlackRock’s ETF flows are turning positive again, suggesting the selling might be exhausting.  Sentiment is numb – perfect for a contrarian setup. Interestingly, ETH/BTC is also breaking out of its own multi-month wedge, which could signal altcoin strength if BTC stabilizes.  
Trading Idea:
• Bullish Scenario: Long on a confirmed breakout above the upper trendline (~$94,000) with stops below $92,000. Targets: $97,000 (short-term), $105,000+ (extended). 
• Bearish Scenario: If support cracks, short toward $85,000-$88,000, but I’d wait for confirmation to avoid whipsaws.
• Risk Management: Always use 1-2% risk per trade. Volatility is high, so position size accordingly. This isn’t financial advice – DYOR!
What do you think, bulls or bears in control? Drop your thoughts below. Let’s discuss!
#BTC #Bitcoin #Crypto #TechnicalAnalysis #FallingWedge #Trading
The Bill Williams Strategy ExplainedWe all know the market doesn’t always play nice, but the Bill Williams Fractal Indicator can help you read between the lines. If you're focused on fine-tuning your entries and exits, let’s break down how fractals can be a useful tool in your strategy.
What is the Bill Williams Fractal Indicator?
At its core, the Bill Williams Fractal Indicator is a technical analysis tool that identifies potential reversal points in the market. This indicator is based on the fractal definition by Bill Williams, who described fractals as price patterns that can be used to predict potential shifts in price direction.
In simple terms, a fractal pattern consists of five consecutive bars or candlesticks on a chart. The middle bar of this pattern represents a local peak or trough, while the two bars on either side of it are smaller. A bullish fractal occurs when the middle bar is a higher high than the surrounding bars, and a bearish fractal appears when the middle bar is a lower low.
Bill Williams Fractal Definition
The Bill Williams Fractal is defined by a sequence of five consecutive bars. The middle bar represents the peak (for bearish fractals) or trough (for bullish fractals), surrounded by smaller bars on both sides. When price breaks the high (for bearish fractals) or low (for bullish fractals) of this central bar, it signals a potential breakout.
How Does the Bill Williams Fractal Trading Strategy Work?
The Bill Williams Fractal Strategy is a proven approach in crypto trading. Whether you're a beginner or an experienced trader, using the fractal strategy can provide valuable insights into potential market reversals and breakouts. By combining the Bill Williams Fractal Indicator with effective risk management, you can improve your trading edge.
A common method is to use the 200 EMA to gauge the overall trend. If the price is below the 200 EMA, traders tend to focus on lower fractals and look for short opportunities, while if the price is above the 200 EMA, they focus on upper fractals and consider long trades. However, always remember to confirm the breakout of local levels for greater reliability in your trades.
Master the Bill Williams Fractal Strategy
The Bill Williams Fractal Strategy is a well-established method in crypto trading. Whether you're just starting out or you're an experienced trader, incorporating the fractal strategy can provide useful insights into potential market reversals and breakouts. By combining the Bill Williams Fractal Indicator with a solid risk management plan, you can enhance your trading approach.
That said, remember that no strategy guarantees success. Fractal trading isn't about predicting the market with absolute certainty — it's about managing your entries and exits with precision and maintaining discipline. Always make sure to think critically and adapt to market conditions. So, when you spot a Bill Williams Fractal on your chart, use it as a guide, but always trust your analysis and approach. Happy trading!
