FOMC Day: Prepare for Potential Bitcoin Volatility!Today is a big day for the markets – the US Federal Funds Rate decision and the FOMC Press Conference are scheduled, events that could potentially change the game for Bitcoin ( BINANCE:BTCUSDT ) and other assets .
But until the meeting begins , we still have time to analyze the charts and prepare.
Keep in mind : as we get closer to the announcement and especially during the release, the market could turn highly volatile. Manage your positions wisely and don’t forget your stop-loss levels .
-------------------------------------------
Bitcoin rose about +2% yesterday on the news that " Trump Family's American Bitcoin just went public on the Nasdaq ."
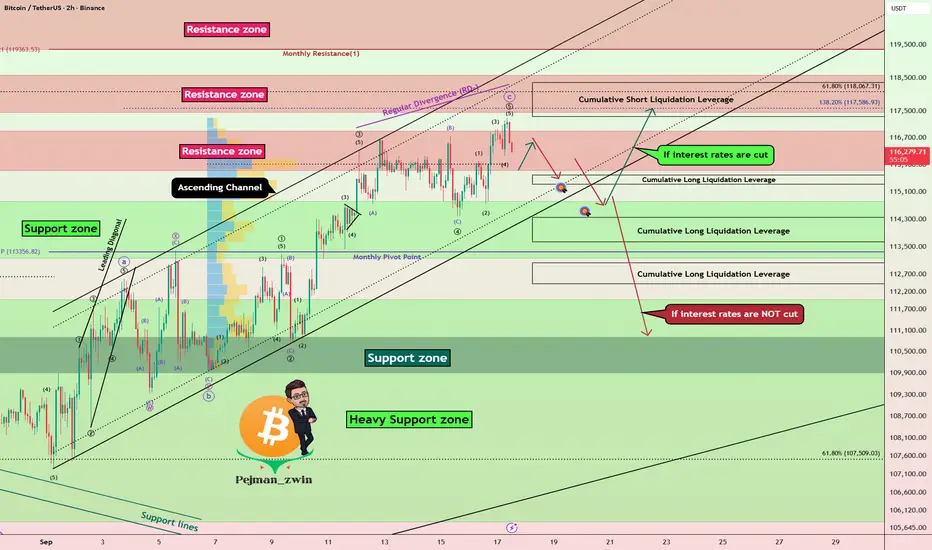
Bitcoin is currently trading in an ascending channel and Resistance zone($116,900-$115,730) near the Cumulative Short Liquidation Leverage($118,354-$117,329) .
In terms of Elliott Wave theory , if interest rates cut , Bitcoin could be completing wave 4 and then rising again and possibly forming a new All-Time High(ATH) . On the other hand, if interest rates do NOT cut , Bitcoin appears to have completed wave C of the Zigzag Correction structure(ABC/5-3-5) .
Also, we can see the Regular Divergence(RD-) between Consecutive Peaks .
I expect Bitcoin to drop to at least $114,860(First Target) before the Fed meeting starts , and if interest rates are not cut , we will see a further and more sudden drop in Bitcoin . And if interest rates CUT , there is a high probability of a Bitcoin pump, so stick to the first target($114,860) for now.
Second Target: $114,470
Cumulative Long Liquidation Leverage: $115,597-$115,330
Cumulative Long Liquidation Leverage: $114,351-$113,640
Cumulative Long Liquidation Leverage: $113,031-$112,430
Do you think the Federal Reserve will cut interest rates?
Please respect each other's ideas and express them politely if you agree or disagree.
Bitcoin Analysis (BTCUSDT), 2-hour time frame.
Be sure to follow the updated ideas.
Do not forget to put a Stop loss for your positions (For every position you want to open).
Please follow your strategy and updates; this is just my Idea, and I will gladly see your ideas in this post.
Please do not forget the ✅' like '✅ button 🙏😊 & Share it with your friends; thanks, and Trade safe.
BTCUSDT.3S trade ideas
$BTC not finished yetHey!
I'm still me, just a quick rebranding honoring my father.
CRYPTOCAP:BTC cycle is far from over. Not saying we bottomed yet. I think prices bewteen 96 - 102k could be reached on the upcoming days.
Althought this bearish momentum, we should encounter a goooood support level which would lead us to a great short absortion. If price holds those levels this week (maybe next too) there is a high chance we will see a new leg above the ATH level.
Im long here. Stay tuned


Pending UltraShort SELL signal pendingLet's be honest, there's no crystal ball on BTC, but the way it trends seems like it does follow a very nice path for trading. The candles show weakening at the top and potentially a nice drop. It's probably waiting on the jobs report this morning at 8:30am ET which will likely look horrible (again).

BITCOIN 4H GOLDEN CROSS BITCOIN 4H Golden Cross ⚡
BTC just confirmed a 4H Golden Cross — a bullish signal that historically kicks off new legs within the Channel Up 📈.
Even though price often cools off after such setups, structure remains bullish and momentum is building 🚀.
Kaizo precision. Next move loading 🥷🔥

Bitcoin Price Crosses $117,000 Post-Fed’s 35 bps Rate CutBitcoin is currently trading at $117,182, continuing its uptrend since the beginning of the month. The immediate challenge lies in flipping $117,261 into support, which would give the cryptocurrency the base it needs for further upside.
If successful, Bitcoin could target $120,000 as its next milestone. A breach and consolidation above that level could set the stage for further gains. This is likely, particularly if ETF inflows continue reinforcing investor confidence.
However, risks remain. Should selling pressure increase, Bitcoin may struggle to hold above key levels. A drop below $115,000 could open the door to a correction toward $112,500, invalidating the bullish thesis and cooling near-term momentum.

Bitcoin (BTC): Bullish CME Filled | Signs of Breakout | BULLISHPressure from buyers continues on BTC; after the first target that we reached, the price might be going for a breakout here.
The game plan is simple: we are looking for a breakout, which would then open for us an opportunity to move towards the current ATH (and most probably form a new one as well).
Swallow Academy

BTC to 120kBTC is progressing through a bullish Inverse Head & Shoulders pattern, projecting a primary target near $120,000. Simultaneously, a shorter-term Bullish Flag (a continuation pattern) has formed within the IHS, confirming the momentum and pointing toward a similar target zone of $120,000 - $121,000.
All eyes are on the immediate Demand Zone. A successful retest and re-accumulation in this area could provide the fuel for the next leg up toward the target. Watch for bullish reversal signals (e.g., hammer, engulfing candle) on a retest of the Demand Zone for a potential long entry.
Target: $120,000 - $121,000
This is a short-term play within a larger bullish structure. Let's see how it develops.

BTC/USDT Technical Analysis, 2025-09-14 17:30 UTCBTC/USDT Technical Analysis, 2025-09-14 17:30 UTC
📈 BTC/USDT – Long Setup from EMA200 Proximity Zone
🎯 Trade Setup
Entry: 115,509.76 USDT
Take Profit (TP): 117,588.94 USDT (+1.80%)
Stop Loss (SL): 113,777.11 USDT (-1.50%)
Risk/Reward Ratio: 1:1.20
🔍 Signal Reasoning
✅ Oversold Detection: Market showed short-term exhaustion, signaling a potential local bottom.
✅ Bullish Pattern Recognition: Clear bullish engulfing pattern detected on 5m candle at EMA200 proximity.
✅ Local Bottom Confirmation: Price tested support near EMA200 (115,831.13) and held.
✅ Market Pressure Analysis: Positive shift with volume pressure confirming buyer strength.
✅ Whale Activity: Notable whale bids (~1.13M USDT) vs. moderate asks (~0.25M USDT), creating bullish imbalance.
✅ Volume Flow Analysis: Flow turned positive with increased buy volume.
✅ Order Book Imbalance: Strong buy-side imbalance at +0.6679 confirmed market support.
✅ Pre-Breakout Setup: ATR compression below mean signaled volatility contraction before expansion.
📊 Technical Context
EMA Levels:
• EMA8: 115,653.14
• EMA21: 115,733.62
• EMA50: 115,792.69
• EMA100: 115,817.30
• EMA200: 115,831.13
Dip Zone Type: EMA200 Proximity Zone
Volatility: 5.00% (ATR 57.32 vs. Mean 59.59 → 0.96x)

BTC Analysis — Long-Term Buy Zone AheadI'm watching $111,000 as a major buy zone on Bitcoin.
If price retraces to that level, I’ll be ready to enter a long position.
This is not a prediction — it’s a scenario.
Smart traders don’t guess, they prepare.
Let price come to your level. No chasing.
📍Set your alerts and stay patient.

BTC: Fed Fuel Ignites the Next Leg UpBTC's coiling like a spring between $116.5k support and $118.5k resistance, with smart money reloading post-rate cut while retail chases shadows. The Fed's 25bps trim is the cheat code here—liquidity's flowing, on-chain whales are backing the truck, and technicals scream bounce to $119k as DXY dips.
Entry zone: $117k-$117.5k for that low-risk long. TP1 at $118.5k (quick scalp), TP2 $119.5k if momentum sticks. SL tight at $116.5k to avoid the flush.
This setup's classic: Crowd's neutral-greedy, but we're thinking like institutions—patience shakes out the weak hands before the real move. Don't FOMO the chop; scoop the dip.

BitCoin $BTC weekly demand level helping the strong rallyWeekly demand imbalance is still in control and is playing out well. A third large bullish candlestick body is being created. Trying to break the resistance level and the all-time highs.

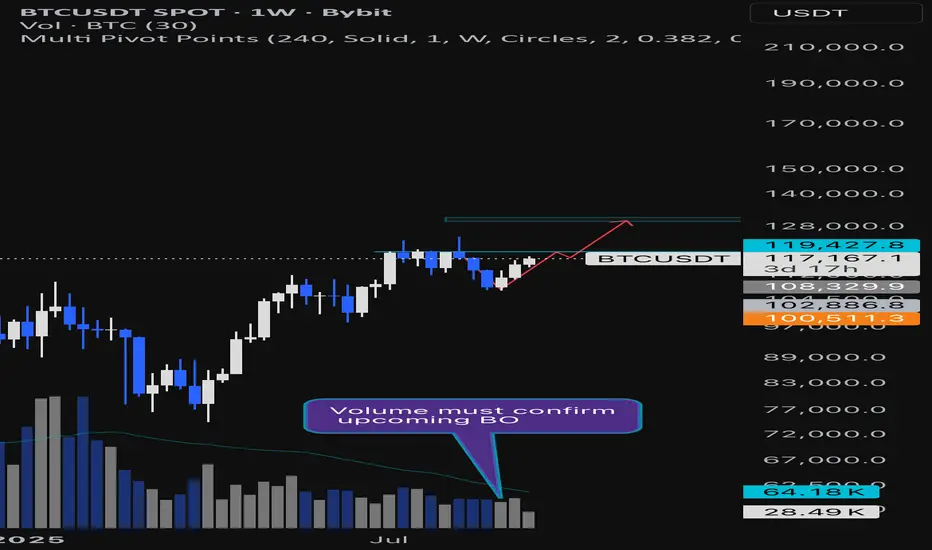
BTCUSDT Weekly Chart Analysis | Bullish V-Pattern Breakout ?BTCUSDT Weekly Chart Analysis | Bullish V-Pattern Breakout Possible
🔍 Let’s dive into the Bitcoin/USDT weekly setup and map out the current momentum, focusing on a key bullish scenario as price nears decisive levels.
⏳ Weekly Overview
Bitcoin is trading near $119,427, just below a major resistance zone at $119,430. A confirmed weekly close above this level, accompanied by sustained volume, would activate a textbook bullish V-pattern breakout. The V bottom structure is recognized for its aggressive buying pressure — price first sharply reverses from the support zone, then rallies as bulls take control, validated by both price and volume signals.
🔺 Long Setup:
A strong volume-backed weekly close above $119,430 unlocks a 10% move at RR1, projecting further upside toward the next reachable target at $130,000, which acts as a Potential Reversal Zone (PRZ). The setup relies on clean confirmation: breakout, high volume on the weekly, and consolidation above resistance for sustained momentum.
📊 Key Highlights:
- Weekly V-pattern maturation can drive a strong bullish leg if confirmed above $119,430.
- Volume confirmation is vital: look for above-average weekly bars to validate breakout strength.
- Target zone sits at $130k, an area with clustering past liquidity and technical importance (PRZ).
- If the breakout stalls or is rejected, expect price to retest lower bands; first support now sits at $113,000–115,000.
🚨 Conclusion:
A bullish scenario is building, hinging on a weekly close with volume above $119,430. Such confirmation would validate a breakout from the V-pattern and set sights on $130k, where trend participants may look to realize or reassess positioning. Failure at this level could reload bids at key lower supports. Stay sharp for volume cues and structural follow-through.
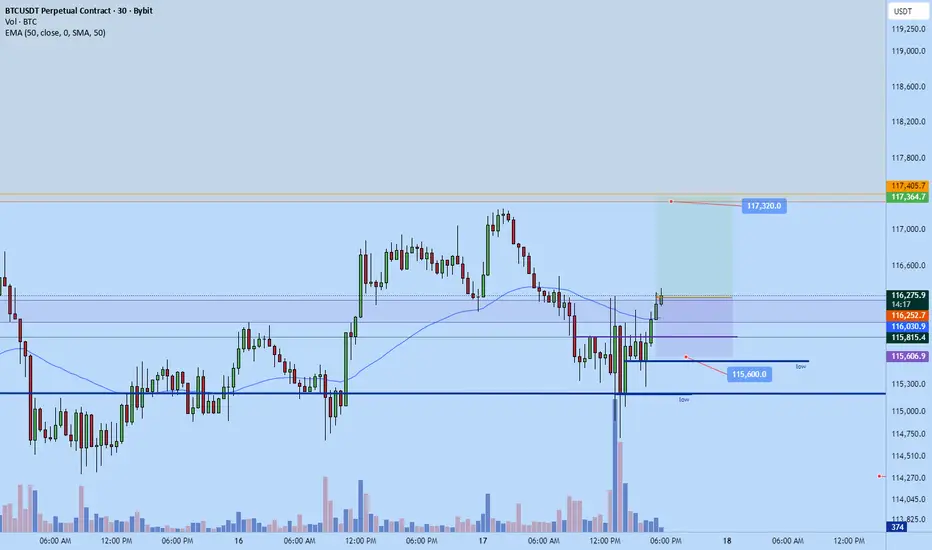
#BTC/USDT - Are the bulls looking for a liquidity grab?#BTC
The price is moving within a descending channel on the 1-hour frame, adhering well to it, and is heading for a strong breakout and retest.
We have a bearish trend on the RSI indicator that is about to be broken and retested, which supports the upward move.
There is a major support area in green at 115,000, which represents a strong support point.
We are heading for consolidation above the 100 moving average.
Entry price: 115,600.
First target: 116,215.
Second target: 117,000.
Third target: 117,900.
Don't forget a simple matter: capital management.
When you reach the first target, save some money and then change your stop-loss order to an entry order.
For inquiries, please leave a comment.
Thank you.

International Trade Week – Analysis & Insights1. The Concept and Relevance of International Trade Week
International Trade Week is often hosted by governments, international organizations, and trade promotion bodies to bring together stakeholders across the global trade ecosystem. It includes panel discussions, workshops, exhibitions, and networking opportunities, where thought leaders share insights about trade flows, barriers, and innovations.
Its relevance lies in three primary dimensions:
Global Trade Interdependence – Today’s world is interconnected. From microchips made in Taiwan to textiles from Bangladesh and crude oil from the Middle East, every economy relies on imports and exports. ITW recognizes this interdependence and creates a collaborative environment.
Policymaking and Regulation – Trade is shaped by laws, tariffs, and treaties. Governments use ITW as a platform to communicate policy shifts and reassure investors and businesses.
Innovation and Opportunities – Trade is no longer limited to physical goods. Services, intellectual property, and digital platforms dominate the 21st century. ITW offers a window into new-age opportunities, including e-commerce, fintech, and sustainability-driven trade practices.
By bringing together diverse participants—from multinational corporations (MNCs) to small exporters—ITW acts as a bridge between aspiration and execution in international trade.
2. A Historical Perspective: Evolution of Global Trade
Understanding International Trade Week also means looking at the evolution of global trade itself.
Early Exchanges (Silk Road & Spice Routes): Ancient trade routes such as the Silk Road and maritime spice routes connected civilizations. These exchanges were as much about culture as they were about goods.
Colonial Trade (15th–19th Century): European colonial powers expanded global trade networks, often exploiting colonies for raw materials and markets. This era set the foundation for the global economic order.
Post-War Reconstruction (20th Century): After WWII, institutions like the General Agreement on Tariffs and Trade (GATT) and later the World Trade Organization (WTO) were created to ensure fair and open trade.
21st Century (Digital & Fragmented Trade): Today, trade is shaped by supply chain networks, technology, and geopolitics. The rise of China, regional trade agreements (RCEP, CPTPP, USMCA), and digital commerce show how trade continues to evolve.
International Trade Week acknowledges this historical journey, reminding participants that trade has always been dynamic, responding to power shifts, technological progress, and social needs.
3. Key Themes of International Trade Week
Every edition of International Trade Week usually focuses on specific themes that reflect the challenges and opportunities of the moment. While these themes vary by host country or organizer, some recurring topics include:
a) Resilient Supply Chains
The COVID-19 pandemic exposed the vulnerabilities of global supply chains. ITW sessions emphasize strategies like diversification, regionalization, and digital supply chain management.
b) Digital Trade & E-Commerce
With Amazon, Alibaba, and Shopify reshaping consumer behavior, ITW explores how digitalization is breaking down trade barriers and empowering small businesses to sell globally.
c) Sustainability & Green Trade
Sustainable trade practices, carbon border taxes, renewable energy, and ESG (environmental, social, governance) frameworks dominate discussions. Trade is increasingly tied to climate responsibility.
d) SMEs and Inclusive Trade
While multinational corporations dominate global exports, SMEs are crucial for job creation. ITW highlights financing, capacity building, and digital tools to help SMEs go global.
e) Geopolitics & Trade Wars
From the U.S.–China trade tensions to Brexit, geopolitics often disrupt trade flows. ITW provides a platform to address these issues diplomatically and pragmatically.
4. Economic Insights: The Impact of Trade on Economies
Trade is not an abstract concept; it directly affects jobs, prices, wages, and economic growth. During ITW, economists often present data-driven insights to show how trade shapes economies.
GDP Growth: Countries that embrace trade generally grow faster. For instance, export-oriented economies like South Korea and Vietnam have shown strong growth.
Employment: Trade-intensive industries provide millions of jobs. However, automation and offshoring can also displace workers, raising concerns of inequality.
Inflation Control: Imports can keep inflation in check by offering cheaper alternatives. But over-reliance on imports can expose economies to global shocks.
Innovation Transfer: Trade encourages technological adoption. Developing countries benefit from importing advanced machinery, while developed nations access new markets.
Economic models discussed at ITW reinforce the idea that balanced trade policies drive long-term prosperity.
5. Geopolitics and Trade Diplomacy
Trade cannot be separated from geopolitics. ITW sessions often feature diplomats and strategists who emphasize how global power dynamics shape commerce.
US–China Rivalry: The trade war between the U.S. and China reshaped global supply chains, pushing companies to adopt a “China+1” strategy.
Regional Trade Agreements (RTAs): Agreements like the EU Single Market, RCEP (Asia-Pacific), and CPTPP are creating trade blocs that bypass WTO stagnation.
Sanctions & Trade Barriers: Sanctions on countries like Russia and Iran illustrate how geopolitics directly impact trade.
Emerging Markets: Nations like India, Indonesia, and Brazil are being courted as alternative trade partners amid shifting alliances.
International Trade Week discussions often stress that diplomacy and trade are intertwined, and businesses must be agile in navigating these complexities.
6. Technology and Digital Trade
Perhaps the most transformative theme in recent ITW events has been technology.
Blockchain in Trade: Enhances transparency and traceability in supply chains, reducing fraud.
Artificial Intelligence (AI): Predicts demand patterns, optimizes logistics, and supports cross-border compliance.
Fintech & Trade Finance: Digital payments and blockchain-based financing reduce costs for SMEs.
Digital Platforms: Marketplaces allow even the smallest entrepreneur to reach global customers.
By showcasing case studies and startups, ITW emphasizes that digitalization is not a distant future—it is already redefining how trade works today.
7. Sustainability and the Future of Green Trade
One of the strongest insights from ITW is the link between trade and climate responsibility. With carbon emissions and environmental degradation becoming urgent issues, trade policies are being reshaped.
Carbon Border Adjustment Mechanisms (CBAM): The EU, for example, taxes imports based on carbon footprints.
Sustainable Supply Chains: Companies are expected to ensure responsible sourcing (e.g., conflict-free minerals, ethical textiles).
Green Technologies: Renewable energy products, electric vehicles, and eco-friendly goods are becoming trade growth drivers.
Global Cooperation: ITW emphasizes that sustainability in trade requires collective action, not isolated efforts.
8. Role of SMEs and Inclusive Growth
Small and medium enterprises (SMEs) often struggle to compete with global giants due to limited resources. Yet, they are the backbone of most economies.
ITW highlights policies such as:
Easier access to trade finance.
Training programs to improve export readiness.
Digital tools to reach international buyers.
Public–private partnerships to support SME participation in trade fairs.
Inclusive trade ensures that globalization does not just benefit large corporations but uplifts grassroots entrepreneurs as well.
9. Challenges in International Trade
While ITW celebrates opportunities, it also brings attention to challenges:
Protectionism: Countries imposing tariffs and quotas to shield domestic industries.
WTO Deadlock: The WTO’s inability to resolve disputes weakens global trade governance.
Digital Divide: Not all countries have equal access to digital infrastructure, creating imbalances.
Environmental Concerns: Trade expansion sometimes worsens ecological damage if not regulated.
Global Shocks: Pandemics, wars, and natural disasters disrupt supply chains.
These challenges remind stakeholders that progress in trade requires continuous adaptation.
10. Case Studies from International Trade Week
During ITW, real-world examples highlight successes and failures:
UK Trade Week 2023: Focused on post-Brexit trade diversification, encouraging SMEs to explore markets outside Europe.
Singapore’s Trade Dialogues: Emphasized digital trade corridors across ASEAN.
African Continental Free Trade Area (AfCFTA): Case studies showed how intra-African trade could unlock massive growth if infrastructure and regulations align.
Such case studies turn theory into actionable insights for businesses and policymakers.
11. Future Outlook of International Trade
Looking ahead, several trends are likely to dominate ITW discussions:
Multipolar Trade World: With the rise of Asia, Africa, and Latin America, trade will no longer be West-centric.
Digital & AI-Driven Commerce: Data will become as valuable as goods in trade.
Resilient Regional Supply Chains: “Friend-shoring” and nearshoring will increase.
Green Protectionism: Environmental rules will reshape competitive advantages.
Inclusive Globalization: Pressure will grow to ensure trade benefits are shared fairly.
12. Conclusion
International Trade Week is not just a ceremonial event—it is a mirror reflecting the state of global commerce and a compass pointing toward future directions. It encapsulates history, geopolitics, economics, and innovation in one platform. By analyzing themes like digitalization, sustainability, and inclusivity, ITW helps stakeholders prepare for a future where trade is more complex but also more opportunity-driven than ever before.
Ultimately, International Trade Week reminds us that trade is not about borders, but about connections. In an era where globalization faces both skepticism and necessity, ITW stands as a beacon for dialogue, cooperation, and shared prosperity.
[BTCUSDT] Breakout or Breakdown?In my previous analysis, I reached the target at 117k and exited my position. Check my profile posts.
I believe the recent rally has largely reflected market expectations that the Fed will cut interest rates. Given the Fed’s cautious stance in recent months, I think the most likely scenario is a 0.25% rate cut.
With a 0.25% cut, I expect the market to remain relatively subdued and potentially dip slightly due to a sell-the-news effect.
With a 0.50% cut, the market could react more positively in the short term, sparking a temporary surge across multiple asset classes.
If the Fed keeps rates unchanged, I expect a negative market reaction.
My base case is that the Fed opts for a 0.25% cut as a way to test market response, which could lead to a mild decline. Therefore, I lean more toward a bearish outlook.
On the hourly chart, I am watching two key support levels at 114.5k and 113.25k. On the upside, if the Fed cuts by 0.50% and price breaks above 117k, I will reassess for potential bullish continuation.
This analysis is for reference only and should not be considered financial advice.

Bitcoin Under Pressure, Correction or Breakout Ahead ?Regarding the overall trend, BTC is currently in a corrective phase after a strong rally from March to July, and is now facing a key resistance zone between 114,500 – 117,500 USDT.
🔸 The price failed to break the recent high at 117,500.
🔸 A clear supply order block is visible between 116,500 – 117,300 USDT, acting as strong selling pressure.
🔸 There’s also a partial Fair Value Gap (FVG) between 111,000 – 113,000 USDT, which may get retested.
📈 If BTC breaks above 117,500, the likely scenario is a rally toward the major resistance at 124,000 USDT, where a potential Double Top formation may occur with a possible failed second high.
📉 On the other hand, if support at 114,500 is broken, the price could head toward the strong support zone around 110,000 – 107,000 USDT.
💡 Trade Idea (Short-Term):
Entry: Sell from price ~117,500
🎯 TP1: 114,600 (Consider closing 50% here)
🎯 TP2: If 114,600 breaks, hold the remaining position for a move toward 110,000
SL: Daily close above 117,500 (If this happens, trend flips bullish and a long trade toward 124,000 can be considered).
Please note:
This is not financial advice – I’m only sharing my personal trades.
Always do your own research before taking action.
👍 Don’t forget to like if you found this useful, and feel free to follow me for more analysis of this kind.
Best of luck 🌹

$BTC - Post-OPEX Dip OPEX in one day! Expecting a sweep of 118-120k!
Bitcoin often drops after large options expiries (OPEX) because of market positioning and hedging flows.
It’s common when open interest is large and skewed in a way that pressures the market once contracts roll off.
Curious if we’ll see a post-OPEX dip for a higher low?

118500$ soon , after taht 122000$ Bitcoin seems to have completed Elliott Wave 4 at $107,000 with Fibonacci 0.38. This is a reasonable ratio considering the pressure from buyers to buy Bitcoin. I think we will soon touch the $118,500 range. Bitcoin reaching this number will tempt buyers to buy even more and we will probably see a new record for Bitcoin soon.

What happened to the BTC pump? Been hearing about the BTC pump etc., but it was already priced in. Starting to cross key indicators DOWN. Now, we are seeing that the market has hit a ceiling and gravity is strong (correction). Wish all the crypto bros with lambos all the best, but it's going to cross 110k then 75k as whales leave and protect their liquidity (at least, what's left).

Bitcoin BTC price analysis FOMC Fed rate🚀 CRYPTOCAP:BTC price is rising, while altcoins remain silent.
What happens tomorrow when the Fed announces its new rate? 🤔
📊 Expectations:
98% believe in a -0.25% cut
2% expect -0.5%
and no one believes it will stay unchanged at 4.5%
That’s why the market has already priced this in. But tomorrow, once the official decision comes — everything could flip ⚡️
📉 The chart looks like chaos to most, but a "trained eye" sees harmony: candles moving level to level.
🔑 Key zones for OKX:BTCUSDT :
Upper channel boundary: $117,800 – $118,000 (only breakable on massive volumes).
September is statistically weak. It opened at $108K, that’s the “zero point”. Logical scenario — dip to $102K.
😬 Worse scenarios:
$96,500
GAP close at $91,600 (but you’ll roast us for this one 😂).
❓Your take: By the end of September, will #Bitcoin be above $108K or below?
______________
◆ Follow us ❤️ for daily crypto insights & updates!
🚀 Don’t miss out on important market moves
🧠 DYOR | This is not financial advice, just thinking out loud.

BTCUSD NEW OUTLOOK According to H1 analysis BTCUSD market running in side wave from from last couple of days now market will be touch the RESISTANCE ZONE and it will be falling from resistance zone you have good chance to sell from resistance level
TRADE AT YOUR OWN RISK
REGARD ALBERT
