BTC Major Short Zone Identified
Bitcoin is approaching a strong Fibonacci confluence short zone between the 0.382–0.5 retracement, a level that previously acted as heavy resistance.
A fakeout + rejection from this area can trigger a mid-cycle correction.
📌 Short Zone:
$0.382 → $0.5 fib area (marked on chart)
🎯 Targets:
T1 → $72,607.37
T2 → $58,502.88
Trade ideas

BTC projection- in a bigger picture!What I see is a close resemblance to the previous double tops on monthly chart. We are currently printing the same. If June goes red confirming the double top, we might go visit the past.
This is self explanatory so I am not adding more details.
Chart invalidates if we close above the previous months high.

BTC/USDT | The real test ahead! (READ THE CAPTION)Hello everyone, back with another analysis, this time on BTC.
By examining the daily chart of BTC, we can see that bitcoin has been boosted up after hitting the demand zone and is currently being traded in 93K zone. I expect a rise to 97k-98k FVG zone, if BTC manages to go past through this zone, a rise to 104K could be possible. Should it fail to go past 98K, another drop to 81K is likely to happen.

BTC/USD) Bearish trend analysis Read The captionSMC Trading point update
Technical analysis of Bitcoin (BTC/USDT), showing likely support/resistance zones + moving averages + a projected downside “target.” I think the analysis has merit — but it also carries risks. Here’s a breakdown of what works & what to watch out for:
---
What the analysis does well (strengths)
Use of support and resistance zones: The chart marks a “key support zone / breakout level” and a “resistance level.” That’s textbook technical analysis — horizontal zones where price has previously stalled or reversed tend to work as future decision points.
Dynamic resistance via moving averages: The chart uses EMAs (50 and 200) — those help traders spot trend direction and possible dynamic resistance/support. When price is below a major EMA (like the 200), that EMA often acts as resistance rather than support.
Clear target defined: Having a target around ~$83,783 (as drawn) gives a concrete downside level if the bearish case plays out. This is useful for planning scenarios and risk management.
Logical structure: support → breakdown → target: The idea seems to be that price broke a support zone (or tested and failed), is now below important moving averages — which supports the bearish bias. If support fails, move down toward target. That’s a valid “trend + structure” bearish setup.
---
What to be cautious about (weaknesses / risks / what’s uncertain)
Support/resistance zones are not guarantees: As described in guides for support/resistance — these zones work because many traders place orders there, but price can ignore them, especially under high volatility or news triggers.
EMAs as dynamic resistance/support are probabilistic: While 50-EMA or 200-EMA often act as resistance/support, they are not always respected — especially in volatile crypto markets.
Timeframe & context matter: The chart seems 1-hour, which means the zones and signals are relatively short-term. Levels that look robust on a 1-h chart may dissolve quickly when broader contexts (daily/weekly) shift. Many TA educators stress using multiple timeframes to confirm strong levels.
No certainty of target — market structure can change: The “target point” assumes continuation of bearish momentum. But if price action reverses, or some bullish catalyst emerges, the setup becomes invalid. This is true for any technical projection.
---
What this setup implies — possible scenarios
Bearish scenario (the chart’s base case): Since price is below both EMAs and has recently broken support, BTC could drift toward the projected target around $83,000–$84,000 if downward pressure continues, especially if sellers dominate near EMAs/resistance zones.
Invalidation / bull scenario: If BTC climbs back above the 50 and 200 EMAs, or reclaims a broken support zone, that bearish thesis fails — and price may instead bounce back toward higher resistance. In that case, the target becomes irrelevant.
Choppy / range-bound scenario: Price may hover between the support/resistance / EMA zones, bouncing up/down without reaching the target — which is common in crypto when there’s no strong directional catalyst.
Mr SMC Trading point
---
My view: Reasonable as a probabilistic bearish trade — but not a guarantee
Your chart offers a plausible bearish setup. It makes sense to watch how price interacts with the EMAs and the support/resistance zones. However: because markets are never deterministic, it’s best to treat this as one possible scenario, not a sure bet.
If I were trading this, I’d probably:
Wait for confirmation (e.g. a breakdown + close below support, or rejection at EMA) before committing.
Define risk controls: like where to set a stop-loss (maybe just above the 200-EMA or above recent consolidation), and a realistic profit target as indicated.
Monitor for catalysts (volume spikes, news) — these can up-end technical setups quickly in crypto.
---
Please support boost 🚀 this analysis

BTC will pump to 130k in next 3 months By looking the chart, we can find out that BTC is completing a huge impulse wave, according to the theory of Elliott's wave we are now completing the main wave 5 that started when BTC fall to 80k . This wave will continue to pumping around 130k.

BTCUSD dump after pumpNews pump that does not change the fundamental background for the cryptocurrency market
Traders may quickly exhaust the potential, leading to a decline or correction
Volume triggered a strong impulse, but resistance stopped the current movement. Most likely, the struggle may continue for some time, but the bears have a good chance of holding back the movement
Scenario: false breakout of resistance at 93800 and subsequent decline


BTCUSDT Price Update – Clean & Clear Explanation✅Bitcoin is trading inside a broader downward structure, and the recent rally has reached a strong supply zone near 92,000–94,000, where sellers have stepped in again. The price reacted sharply from this resistance band, indicating that the market is still respecting the higher-timeframe bearish trend.
✅Currently, the market is showing signs of exhaustion after the latest push upward, and the price is starting to form a lower-high rejection pattern, suggesting that buyers are losing momentum. As long as Bitcoin stays below the 92,000–94,000 supply zone, the long-term outlook remains bearish.
✅If selling pressure continues, the chart supports a gradual decline toward the first target near 88,000, where a previous demand zone and trendline support meet. Breaking below that structure may trigger a deeper drop toward the second major demand zone around 83,000–84,000, which aligns with the lower boundary of the long-term descending channel.
✅Overall, unless Bitcoin breaks and holds above 94,000, the higher-timeframe structure favours a bearish continuation, with sellers aiming for lower levels over the coming sessions or weeks.
✅If If you find it helpful please like and comments for tis post and share thanks.

BTCUSDT Long: Buyers Defend 91K Zone – Targeting 96K ExpansionHello, traders! The current BTCUSDT price action is developing within a strongly structured bullish environment after a prolonged decline driven by the Descending Channel. Earlier, the market broke down from the upper supply region and continued to move lower while respecting the descending channel boundaries. After reaching a pivot low near the demand zone around 91,000, buyers stepped in, initiating a reversal and shifting momentum to the upside. Following this, Bitcoin formed a clean Ascending Channel that confirmed growing bullish pressure. Price then entered a Range phase, indicating temporary equilibrium before the next impulsive move. After completing this consolidation, BTCUSDT created a clear Head and Shoulders reversal structure near demand, signaling a strong bullish reversal. Buyers took control and pushed price sharply upward, breaking through the range and reclaiming higher structure levels.
Currently, BTCUSDT is trading inside a new Ascending Channel, steadily climbing toward the 96,000 supply level, where sellers previously reacted. As long as price remains above the 91,000 demand zone and continues to respect the ascending channel structure, the bullish scenario remains valid. The next upside target is the 96,000 resistance area, aligned with the upper channel boundary.
My scenario is a continuation toward 96,000 as long as buyers maintain control of the channel. However, a strong rejection from this supply zone may trigger a corrective pullback back toward demand before buyers attempt another move upward. Manage your risk!

TradeCityPro | Bitcoin Daily Analysis #245👋 Welcome to TradeCity Pro!
Let’s move on to the Bitcoin analysis. After the fake move we had yesterday, today Bitcoin has entered a ranging box.
⏳ 1-hour timeframe
Yesterday on Bitcoin we had a trigger at the 91447 zone that we could use as a long trigger.
🎯 Before that, we also had a trigger on Bitcoin at 89849 which had been activated, and with the break of 91447 the second trigger was also activated.
🎲 After this trigger was activated, given the trend weakness we had on Bitcoin, the price could not stabilize above 91447, and with that move being faked, it dropped again to 89849.
⛏ The 89849 zone is an important support area on Bitcoin, and the next support we have on Bitcoin is 88890.
✔️ Considering that Bitcoin has faked both the 89849 low and the 91447 high once, we can say currently there is no specific trend in the market, and we can open both short and long positions.
📊 For a long position, again we can enter with the break of 91447 and open our position.
✔️ In case the market drops, we have two short triggers:
the first is 89849 and the second is 88890, and by breaking either of them we can have a trigger for a short.
❌ Disclaimer ❌
Trading futures is highly risky and dangerous. If you're not an expert, these triggers may not be suitable for you. You should first learn risk and capital management. You can also use the educational content from this channel.
Finally, these triggers reflect my personal opinions on price action, and the market may move completely against this analysis. So, do your own research before opening any position.

TradeCityPro | Bitcoin Daily Analysis #244👋 Welcome to TradeCity Pro!
Let’s move on to Bitcoin analysis; with the start of the new week, the market has taken a fresh trend.
⏳ 1-hour timeframe
Yesterday on Bitcoin, we had two very important levels that the price was fluctuating between.
⭐ The resistance zone 90022 and the support 88890 were the areas where breaking either of them could give us a position.
💥 The first position we could open yesterday was a short, which after breaking 88890 made a sharp move that would reach our target as well, but afterward the price started a bullish move, and after the previous bearish move turned into a fakeout, a lot of bullish momentum entered it.
💧 After this move, the 90022 trigger also activated, and Bitcoin moved upward to the 91447 area.
🧩 Overall, yesterday was a very volatile day, because after reaching 91447, Bitcoin corrected to near 88890, and then again moved upward.
🎲 But today Bitcoin was struggling with the 91447 zone, which it has so far managed to break, and with a bit of momentum and a slight slope, it is moving upward.
⚡️ We can see this trend weakness inside the RSI; the shape of the candles also shows a lot of trend weakness, but volume still doesn’t have a strong divergence with the bullish trend.
✔️ If this weakness continues, the probability of a fake break of 91447 and the start of a new bearish move increases a lot.
🔔 But if Bitcoin keeps its momentum and the move continues, the next zone the price can react to will be 93609.
❌ Disclaimer ❌
Trading futures is highly risky and dangerous. If you're not an expert, these triggers may not be suitable for you. You should first learn risk and capital management. You can also use the educational content from this channel.
Finally, these triggers reflect my personal opinions on price action, and the market may move completely against this analysis. So, do your own research before opening any position.

How to Start Trading with Technical Analysis (Beginner Guide)How to Start Trading with Technical Analysis (Beginner’s Guide)
--
Why you must understand support and resistance before you trade
Before we place a single trade in crypto or stocks, we need to understand support and resistance. At the core, this comes down to the basic law of supply and demand.
Price doesn’t pause or bounce at certain levels by accident. It happens because those levels are where people who want to buy (demand) and people who want to sell (supply) collide in size. Areas where buyers consistently win tend to form support, while zones where sellers keep overwhelming buyers turn into resistance.
In a 24/7, highly volatile market like crypto, these support and resistance zones become reference points we can rely on in the middle of chaotic price swings. You’re not just drawing a few lines on a chart you’re asking,
“ How have market participants reacted around this price in the past? ”
Reading support and resistance is essentially reading the footprints of supply, demand, and crowd psychology on the chart. That’s why understanding these levels is one of the very first skills you need to build if you want to trade crypto or stocks with any consistency.
--
Support and resistance are not just lines you draw wherever the price has “touched a lot,” like in the typical examples you see on charts.
Why not?
If you look closely at past price action, the zones where support or resistance keeps showing up are always places where someone’s interests are heavily involved.
Some participants have accumulated a large position around that price and need to defend their average entry.
Others want to quietly accumulate in that area over time.
→ So when price comes back down, buy orders step in around that zone and a support level forms.
On the flip side:
Some traders see a certain area as “a good place to unload” and wait there with sell orders,
And traders who are stuck from buying near the top are often eager to get out at breakeven or with a small loss when price revisits that zone.
→ As a result, resistance forms there, and it becomes harder for price to push higher.
That explains why certain zones have acted as support or resistance in the past.
But the next question we must ask is:
“ Are support and resistance levels from 1–2 years ago still valid today? ”
Why is that such an important question?
Because a chart doesn’t only have a price axis (Y) — it also has a time axis (X).
As time passes:
The players who were defending that level may have closed or reduced their positions,
The overall mix of market participants may have changed completely,
And price may have broken above, below, and through that level many times,
gradually diluting its significance compared to the past.
That’s why support and resistance shouldn’t be drawn just as
“places where price touched a lot before,”
but rather as
“places where supply and demand are still likely to concentrate now.”
In other words, you’re not only asking “Where did price react?”
You’re also asking “Is there still a good reason for the market to care about this level today?”
--
So we need to adjust the way we define support and resistance.
Instead of just re-using levels where “price touched a lot in the past,”
we focus on zones where, after a strong rally or a sharp drop,
price makes its first strong pullback or bounce.
Why are these areas so important?
Because they are the zones where recent supply and demand have collided the most aggressively.
After a big move up, the first strong dip that gets bought up shows a price area where
buyers are still saying: “If price comes back here, I’m happy to buy aggressively.”
After a big move down, the first strong bounce shows a price area where
sellers are still saying: “If price comes back up here, I’m happy to sell into it.”
As we mentioned earlier, a chart doesn’t only have a price axis (Y) —
it also has a time axis (X).
That means, when we look at support and resistance, it’s more logical to focus on
“ the most recent levels where the market reacted strongly ”
rather than just
“ the oldest levels that were touched many times. ”
Old support levels, over time, can lose their power:
The players who used to defend that level may have already closed or reduced their positions,
The composition of market participants may have changed completely,
And repeated breaks above and below that level may have gradually diluted its importance.
In contrast, the most recent support and resistance zones:
Reflect the latest state of supply and demand, and
Show you where today’s traders are actually willing to buy and sell right now.
In other words, they are levels that are “more alive,”
because they incorporate both price and time.
That’s why, in real trading,
instead of clinging to very old levels, it’s far more useful to first mark
the zones where price made its first strong pullback or bounce after a major move.
Those are the areas that help you read current, active supply and demand,
and they tend to give you much more meaningful support and resistance in today’s market.
--
Of course, there are countless ways to analyze the market.
And as we just discussed, even “freshly formed” support and resistance levels don’t last forever.
At some point those levels will break, price will move into a new area, and it’s completely natural to update your chart with new support and resistance zones.
Even so, just by doing what you see in the image above – splitting the recent range based on the latest support and resistance –
you can already get a very intuitive sense of whether price is temporarily expensive or cheap.
We do this by using a Parallel Channel:
The upper half becomes the Premium Zone
The lower half becomes the Discount Zone
1. Premium vs Discount – training your eye to look at “location” first
Once you divide the range like this,
the very first thing you check when you open a chart is:
“ Where is price sitting right now? ”
If price is in the Premium Zone
→ It means that, relative to the recent box/trend, price is in a more expensive area.
→ In this zone, instead of blindly chasing new longs,
You might think about taking profits or scaling out of existing long positions, or
Look for mean-reversion shorts / corrective moves rather than fresh break-out longs.
If price is in the Discount Zone
→ It means that, within the same range, price is sitting in a cheaper area.
→ Here,
If the higher-timeframe trend is up, this is where you look for dip-buying / long entries, and
If you’re already short, this is where you start thinking about locking in profits or reducing risk.
In other words, the Premium/Discount split acts as a location filter that quickly answers:
“At this price area, does it make more sense to be looking for longs or for shorts?”
2. Learning to trade only from “good locations”
A common mistake for beginners is entering trades without any regard for location,
just reacting to a few candles.
Price is already near the top of the Premium Zone,
→ but a couple of green candles appear and FOMO kicks in → chase a long.
Price is already near the bottom of the Discount Zone,
→ but a few red candles print and fear kicks in → chase a short.
When you trade like this, your risk–reward structure is broken from the start.
Your stop can’t be tight, and your upside is limited because you’re trading in the worst part of the range.
If you first split the range with a parallel channel, the order of thinking changes:
Check location first,
Then look for entry signals (patterns, candles, FVG, structure shifts, etc.).
That tiny change in sequence turns
“pressing buttons anywhere” → into → “only fighting from good locations,”
and it massively upgrades the overall quality of your trades.
3. Looking at it again from a supply–demand perspective
From a more theoretical point of view:
Near the bottom of the Discount Zone,
the market has recently decided, “If price falls this low, it’s cheap.”
→ This is where demand (buy orders) is likely to show up again.
Near the top of the Premium Zone,
the market has treated that area as “expensive enough to take profits.”
→ This is where supply (sell orders) is likely to reappear.
So by splitting the range into Premium and Discount with a parallel channel,
you’re effectively seeing how recent supply and demand are tilted
without using any complicated indicator — just clean price action and location.
4. One-line summary
Treat support and resistance as zones , not thin lines.
Divide that zone with a parallel channel into Premium and Discount .
Decide on the favorable side first, and only then look for concrete entry and exit signals inside it.
Once you do this,
“ Which area is cheap today, and which area is expensive? ” becomes much clearer in your mind,
and you’ll naturally avoid taking random trades in the messy middle where your psychology and PnL both suffer.
--
Let’s say price is currently sitting in the Premium Zone,
but your RSI just flashed an “oversold” signal.
(Much later we’ll go deeper into indicators, so for now you can simply think of RSI as a tool that sometimes marks potential highs and lows on the chart.)
A lot of beginners see this and immediately think:
“RSI is oversold → price must be cheap → time to go long.”
But with our framework, this is actually a situation where
location and indicator are telling you two different stories.
Location view (Premium Zone)
→ “Within the recent range, this is an expensive area.
→ I should be more focused on taking profits, fading rallies, or waiting for a deeper discount,
not blindly chasing fresh longs.”
RSI view (oversold)
→ “Price has dropped sharply in the short term and might be due for a bounce.”
So an RSI oversold signal inside the Premium Zone often means:
“Price is having a short-term pullback within an expensive area,”
not
“This is a structurally cheap level where I should load up.”
In other words, it may simply be a dip in a larger down move or distribution area,
rather than a high-probability bottom.
By contrast:
RSI oversold near the bottom of the Discount Zone
= “Cheap area + oversold signal”
→ Much stronger candidate for a meaningful short-term low.
That’s why, in practice, it’s safer to:
Check location first (Premium or Discount),
Then look at oscillator signals like RSI, MACD, Stoch, etc. as secondary confirmation.
For now, just keep this rule of thumb in mind:
Only take indicator signals seriously when they line up with a good location.
That simple filter alone will help you avoid a lot of impulsive trades where
You buy high just because an indicator said “oversold,” or
Sell low just because it flashed “overbought.”
(We’ll cover RSI and other indicators in detail later, including
how to combine them with location to build much higher-quality entries and exits.)
--
In the end, what really matters is a simple question:
“Is price expensive here, or cheap here?”
Put differently:
Is this an area where sell supply is likely to show up,
or an area where buy demand is likely to step back in?
That’s the first thing you want to figure out.
If we boil down everything we’ve talked about so far into a few key points:
Treat support and resistance not as thin lines, but as zones where supply and demand have actually clashed .
Use those zones to carve out Premium (expensive) / Discount (cheap) areas.
Inside those areas, decide first where it makes sense to fight from (which side is favored: long or short),
And only then start paying attention to indicators, patterns, or candle signals.
Most people start their journey by asking,
“Which indicator is the best?”
“Which pattern has the highest win rate?”
But with just a bit of experience, you eventually arrive at the same conclusion:
“Where you enter (location)
matters more than what you enter with (signal).”
When you enter from a good location:
You can keep your stop loss tighter.
The same profit feels much easier to hold through.
Even if the trade loses, you can at least say, “I took the trade from a logical area,” which helps your psychology.
When you enter from a bad location:
No matter how “nice” the indicator looks, your stop tends to be wide,
A small move against you immediately stresses your mindset,
And even when the trade is in profit, it feels like you could get slapped the other way at any moment, so it’s hard to hold with conviction.
So here’s a simple practical checklist you can take into your own trading:
Find the most recent support and resistance zones where price reacted clearly and meaningfully.
From that structure, draw a Parallel Channel or box,
and split it into a Premium zone (upper half) and a Discount zone (lower half).
Check first: is price currently in the Premium side or the Discount side?
Only after that:
Look at oscillators like RSI, MACD, Stochastics,
And patterns, structure shifts, FVGs, candles, etc.
as secondary tools for entries and exits, not primary drivers.
Simply not chasing longs near the top of the Premium zone,
and not chasing shorts near the bottom of the Discount zone,
is enough to noticeably improve the quality of your trades.
At the end of the day, the chart is asking you something very basic:
“ At this price level,
based on the recent structure, is this
cheap enough that people want to buy,
or expensive enough that people want to sell? ”
If you can answer that question first,
then all the other tools that come afterward — RSI, MACD, FVGs, patterns, order blocks, ICT concepts, you name it —
become tools you use at meaningful locations , not random signals on a random chart.
If you can’t answer that question,
and you just keep adding more tools on top,
your trading usually becomes more complicated on the screen,
while your account and your mindset quietly get worn down in the background.
In the next parts, we’ll go into:
How to layer oscillators like RSI and Stochastics on top of this location framework, and
How to design actual entry, stop-loss, and take-profit plans using these ideas.
But before that, if you only take one thing away from this section, let it be this:
“Always ask first: is this area expensive or cheap?”
That one question alone
can dramatically upgrade the quality of the trade you’re about to take when you hit that buy or sell button.
--
If this was useful for your trading, consider giving it a Boost (🚀) and leaving a quick comment (💬).
That kind of interaction helps me know what’s working and motivates me to keep posting.
You’re welcome to follow so you don’t miss the next idea.
BtcIt seems like Bitcoin has failed to reach its peak and is trending down. We will enter at the bottom.

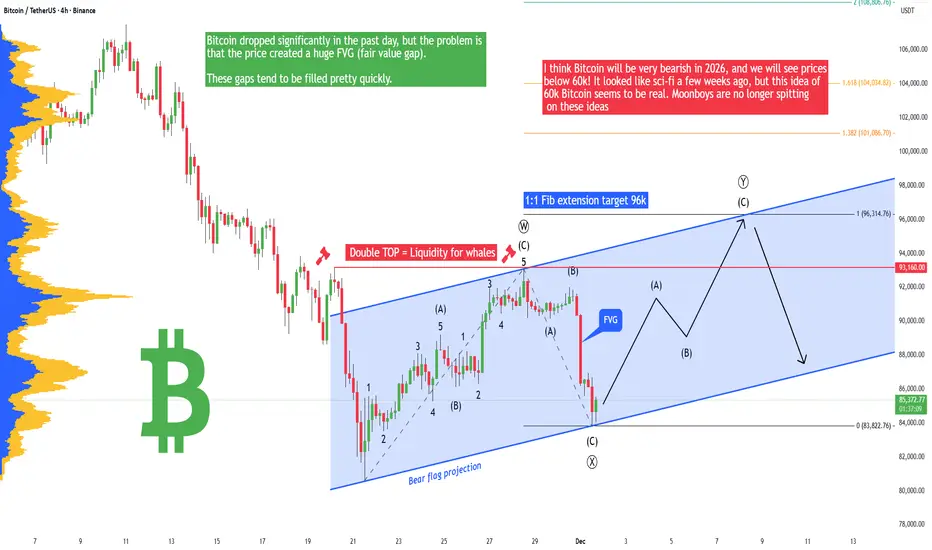
Bitcoin - Fake drop! Soon return to 96k (December PUMP!)Bitcoin has dropped like crazy in the past day because we are in a strong bear market, but I think we should see a December rally! I have been warning you against these big crashes pretty much since Summer 2025. I knew it was going to happen - the question was not if but when.
The price created a huge FVG, and this gap is very unfilled. Pretty much it looks like a huge manipulation from big players (they sent the price down significantly to liquidate high-leverage traders on futures). You know that the Bitcoin market is completely manipulated by the Fed, banks, and huge institutions. They even have a roadmap, and they know what the price of Bitcoin will be in 2030 and 2040. I know everyone hates the Fed and banks, but this is how it is. We trade it, so you have to be able to predict their movements and trade with their plan.
I think Bitcoin will be very bearish in 2026, and we will see prices below 60k! It looked like sci-fi a few weeks ago, but this idea of 60k Bitcoin seems to be real. Moonboys are no longer spitting on these ideas, and some people are calling for 30k or 40k Bitcoin. Let me know in the comment section your prediction. I am curious! You have to understand that there is a lot of manipulation going on in this world. We live in a physical world that has been created recently. The original astral world is where the magic happens. And yes, the physical world is a scam and fraud. The sooner you understand that after you're dead, you wake up in the original astral world, the better for you.
Currently, I am pretty bullish, I think we will see a bullish rally sooner rather than later!
Write a comment with your altcoin + hit the like button, and I will make an analysis for you in response. Trading is not hard if you have a good coach! This is not a trade setup, as there is no stop-loss or profit target. I share my trades privately. Thank you, and I wish you successful trades!
BTCUSDT.P - December 7, 2025Price is consolidating in a sideways range after a sharp prior decline, forming an ascending triangle-style squeeze against short-term resistance around 90,300–90,500. A break and sustained hold above this ceiling would likely trigger a continuation move toward the higher resistance band near 92,200–92,400, aligning with the marked long scenario. Failure to clear resistance followed by a break of the rising trendline and support near 89,200–89,300 would favor the short scenario, exposing the lower support zone around 87,300–87,600.

Here's why Bitcoin surged ahead of Thanksgiving
The digital asset broke $90,000 on Wednesday afternoon, reflecting strong growth in stocks as well.
What's driving Bitcoin's latest rally?
Cypherpunks and bearded libertarians used to be the epitome of Bitcoin. But after the approval of the first Bitcoin exchange-traded fund (ETF) last year, the new image is more likely that of Wall Street executives in navy suits. The ETF now holds over 1.5 million BTC, representing nearly 7.2% of the total supply. The next largest group of holders is publicly traded companies. This is key, as it likely explains why Bitcoin's $90,000 surge on Wednesday followed closely behind the stock market rally.
I'm now watching to see if Bitcoin will break $100,000 again before Christmas!
According to Newhedge, the correlation between Bitcoin and the S&P 500 climbed to 0.87 on Wednesday. In other words, the two asset classes are actually moving in tandem. Therefore, as stocks rose ahead of Thanksgiving due to increased AI hype, Bitcoin followed suit. Oracle, a major cloud infrastructure player, led a surge in large-cap tech stocks after it struck a $300 billion deal with OpenAI in September. This was largely thanks to Deutsche Bank analyst Brad Zelnick, who highly praised the company's revenue potential from the arrangement.
“OpenAI’s backlog of orders represents a solid return on investment business,” Zelnick wrote. “And validates Oracle’s leadership in large-scale deployment of AI cloud infrastructure.”
Oracle rose 4%, while the S&P 500, Nasdaq, and Dow Jones rose 0.77%, 0.86%, and 0.80%, respectively. Bitcoin rose 4%, breaking $90,000 for the first time this week, catching Turkey Day. It needs to be clear that Bitcoin is not always closely correlated with stocks; it often diverges. But as institutional money flows into the ecosystem, the cryptocurrency will inevitably succumb to Wall Street and simply reflect the ups and downs of traditional markets.
According to Coinmarketcap, Bitcoin rose 4.06% on the day, trading at $89,872.10 at the time of the report. Digital assets also rose 1.21% on the week, fluctuating between $86,171.48 and $90,389.93 in the past 24 hours.
Daily trading volume was roughly flat at $65 billion, with a market capitalization of $1.79 trillion. Bitcoin's market dominance rebounded to 58.75%, an increase of 0.41%, as the cryptocurrency regained a small portion of market share from smaller cryptocurrencies.
Coinglass data shows that total open interest in Bitcoin futures rose 2.24% to $60.52 billion, after falling to $59 billion on Tuesday. At the time of writing, liquidations remained slightly higher at $119 million. Short sellers saw $80.58 million in margin wiped out, while long investors were largely unaffected, with only $19.61 million liquidated.

BTC recovers ahead of interest rate announcementBTC Daily Chart – Short Analysis
Bitcoin is still trading inside a bearish structure, staying below key moving averages and the descending trendline.
Main resistance: $100,000 – $102,000
This zone aligns with the 0.5 Fibonacci level and previous support turned resistance → high probability of rejection.
Current move: Price is bouncing, but no bullish confirmation as long as it stays under $102k.
Expected scenario:
BTC may retest the $100k–$102k zone, fail to break it, and continue downward.
Downside target: $83,700 – $84,000
This level matches liquidity and trendline confluence.
Conclusion:
Trend remains bearish unless BTC breaks and closes above $102k.

TradeCityPro | Bitcoin Daily Analysis #243👋 Welcome to TradeCity Pro!
Let’s move on to today’s Bitcoin analysis. The market is still ranging because it’s the weekend, but today there is a strong chance of movement.
⏳ 1-Hour Timeframe
After the drop to the 88,890 zone, the market formed a range structure yesterday, and Bitcoin is now preparing for its next move.
✔️ Bitcoin’s volume was very low yesterday (Saturday), and this low volume has continued today as well.
💡 However, since we’ve recently seen New York session volatility on Sundays, today we may also see movement.
💥 With RSI pulling back to the 50 level and failing to stabilize above it, bearish momentum can enter the market.
🧩 If RSI enters the oversold zone, this bearish momentum will increase even more.
🎲 If 88,890 breaks, opening a short position is logical, and the price may move toward 85,818.
⚖️ But today, the market can also give us a long setup.If the 90,022 level breaks, we can look for a long position.
🎯 The next resistance levels for Bitcoin are 91,974 and 93,609.
✨ The most important note for both triggers is VOLUME.The breakout must be supported by increasing volume.
📊 If volume stays this low and doesn’t improve, the probability of fake breakouts increases significantly.
🔭 But if the breakout happens with rising volume, the trend can continue smoothly.
❌ Disclaimer ❌
Trading futures is highly risky and dangerous. If you're not an expert, these triggers may not be suitable for you. You should first learn risk and capital management. You can also use the educational content from this channel.
Finally, these triggers reflect my personal opinions on price action, and the market may move completely against this analysis. So, do your own research before opening any position.

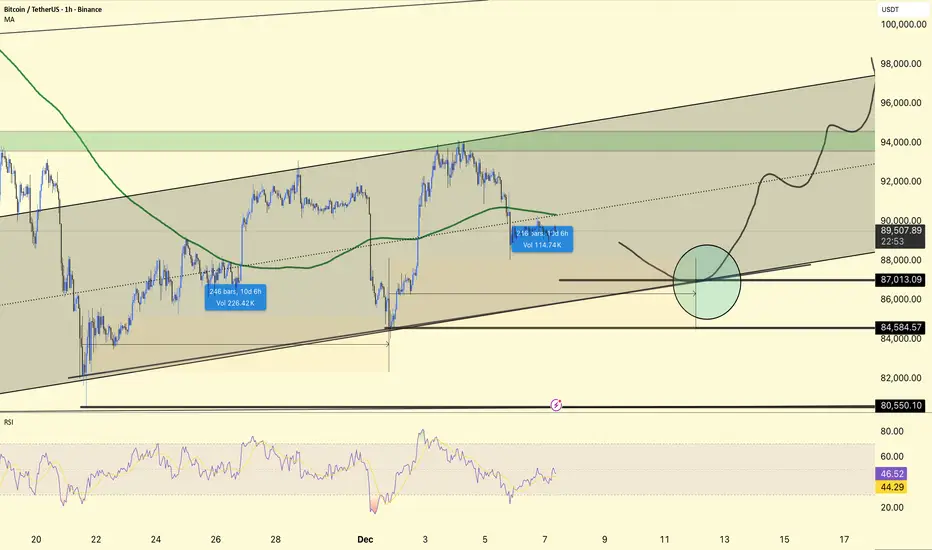
#BTC 4HOUR CHART UOPDATE !!BTCUSDT is still trading within an ascending channel, now pulling back towards the mid-lower portion of the structure after failing to sustain above 90k on the latest push.
The price has rolled over from the upper half of the channel and is heading towards the main confluence zone around 87,000–88,000, where the lower channel line, previous horizontal support, and your marked circle align.
84,584 and 80,550 remain the next downside reference supports; holding above 87k maintains the short-term bullish channel, while a break below 84,584 would increase the risk of a deeper correction towards 80k.
A decline into the 87k area, followed by basing and a continuation back towards 92k–94k, and if buyers defend the channel as drawn, possibly to the 96k–98k channel top.
The RSI is mid-range rather than overbought, so there is room for another leg down or a sharp bounce to test support; using 87k–84.5k as the main invalidation band for aggressive longs fits within the current 4H structure.
DYOR | NFA,
Consistency: The Real Market Hack!Every trader wants consistency.
But very few understand what consistency actually means.
Consistency is not:
❌ winning every trade
❌ predicting the market
❌ avoiding losses
❌ being perfect
Consistency is built long before you press the buy (or sell) button.
Here’s what consistent traders all have in common:
1️⃣ They Repeat the Same Process Every Day!
Consistency comes from repetition; not randomness.
The best traders don’t have a different plan for every chart.
They use the same routine, the same checklist, the same rules.
Clarity replaces guesswork.
2️⃣ They Trade Only When Their System Shows Up!
Consistency is not about taking more trades.
It’s about taking only the trades that match your edge.
No signal = no trade.
No confluence = no risk.
No clarity = no entry.
Most inconsistency comes from forcing trades that never belonged in the plan.
3️⃣ They Accept Losses Without Breaking Structure!
A consistent trader still loses, they just don’t fall apart when it happens.
❌They don’t double their risk.
❌ They don’t chase entries.
❌ They don’t change strategy mid-trade.
They take the loss the same way they take the win:
within the system.
4️⃣ They Focus on Long-Term Data, Not Single Trades!
You can’t judge a strategy by one day, one week, or even one month.
Consistency is measured across:
✔ dozens of trades
✔ multiple cycles
✔ all market conditions
Professionals think in probabilities.
Beginners think in outcomes.
The Real Secret?
Consistency is not an ability.
It’s a decision you make every day:
➡️ Follow your rules
➡️ Manage your risk
➡️ Trade your edge
➡️ Ignore the noise
When your habits become consistent, your results eventually follow.
⚠️ Disclaimer: This is not financial advice. Always do your own research and manage risk properly.
📚 Stick to your trading plan regarding entries, risk, and management.
Good luck! 🍀
All Strategies Are Good; If Managed Properly!
~Richard Nasr
The One Pattern Every Trader Misses!Most traders focus on flags, wedges, double tops, fibs…
But there’s a pattern far more powerful, and almost no one talks about it:
-- The Behavior Pattern. --
📈It’s not drawn on your chart. You can’t code it into an indicator.
But it determines your success more than any formation.
Here’s the pattern professionals watch, and beginners ignore:
1️⃣ Impulsive Behavior
When price moves fast, traders move even faster.
FOMO kicks in. Chasing begins. Risk is forgotten.
Professional interpretation:
➡️ If emotions are impulsive, structure won’t be respected.
Avoid trading in emotional markets unless you already have a plan.
2️⃣ Hesitation Behavior
Price reaches your level. Your alert triggers.
Everything lines up… and you still don’t enter.
Why?
Because hesitation is a sign your risk is unclear.
Professional interpretation:
➡️ If hesitation appears, your plan isn’t ready.
The chart is never the problem, the plan is.
3️⃣ Revenge Behavior
One loss turns into five.
You stop trading the chart and start trading your frustration.
Professional interpretation:
➡️ If frustration is present, you’re trading without structure.
Step away. Market will be here tomorrow.
Why This Matters ⁉️
The market doesn’t punish bad trades. It punishes bad behavior.
Your biggest losing streaks didn’t come from your strategy.
They came from emotional patterns you didn’t recognize in real time.
Once you learn to see these behavior patterns, your charts become clearer, your decisions simpler, and your risk finally makes sense.
🧠Final Thought
Chart patterns tell you where the market might go.
Behavior patterns tell you whether you’ll survive long enough to get there.
Master both; and you’ll trade with the clarity most people never reach.
⚠️ Disclaimer: This is not financial advice. Always do your own research and manage risk properly.
📚 Stick to your trading plan regarding entries, risk, and management.
Good luck! 🍀
All Strategies Are Good; If Managed Properly!
~Richard Nasr
TradeCityPro | Bitcoin Daily Analysis #242👋 Welcome to TradeCityPro!
Let’s move on to the Bitcoin analysis. Today is Saturday, and after yesterday’s drop, the market is ranging and resting.
⌛️ 1-Hour Timeframe
Yesterday, we saw clear signs of correction and bearish momentum in Bitcoin, and with a sell-off candle, the price dropped to the 89,082 level.
🔭 After reaching this zone, the correction has paused, and Bitcoin is now moving sideways near 89,082.
💥 On the RSI oscillator, we had a descending trendline that RSI respected very well.
✨ Now that this trendline has been broken, RSI is testing the 42.25 resistance level.
⚡️ If RSI breaks above this level, we will have the first signal of bullish momentum returning to Bitcoin.
🎲 If we get that confirmation from RSI, we can then look for a long trigger on the Bitcoin chart itself.
🧩 Once BTC breaks the short-term structure it forms by then, we can open a long position.
🎯 However, since today is Saturday, I personally prefer to wait and avoid opening any trades until the new week starts.
💡 Still, I’ll stay behind the chart, and if the bullish scenario plays out, I will open a long position.
📊 For a short position, we can enter on a break of 89,082, but honestly, many altcoins paired with BTC have much better short triggers right now.
❌ Disclaimer ❌
Trading futures is highly risky and dangerous. If you're not an expert, these triggers may not be suitable for you. You should first learn risk and capital management. You can also use the educational content from this channel.
Finally, these triggers reflect my personal opinions on price action, and the market may move completely against this analysis. So, do your own research before opening any position.

A Bearish SentimentHey guys, Bitcoin on the 4H is setting up what looks like a textbook distribution pattern, and I'm leaning bearish here despite the recent bounce off $87,688.
Price is currently trading at $91,332, sitting in a really uncomfortable middle zone. We're above the short-term moving averages (EMA20 at $90,193 and EMA50 at $90,276), which on the surface looks bullish. But here's the problem: we're still firmly rejected below the EMA200 at $93,179, and that level's been acting as a ceiling for multiple sessions now. Every time we push toward $92,900-$93,200, sellers step in hard. That's your primary supply zone, and it's reinforced by the Bollinger Band upper limit at $92,918.
The indicator stack is where things get really interesting. ADX is screaming at 77.1, that's extreme trend strength, folks. But which trend? The MACD is still bearish at -286.85 versus signal at -284.68, telling us the momentum remains to the downside despite this bounce. More importantly, check out the Stochastic at 96.4, that's massively overbought on the 4H timeframe. When you see Stochastic that extended, you're usually near a local top, not the beginning of a rally.
Here's where it gets spicy: the MFI is sitting at just 22.9. Let that sink in. Price is pushing higher, Stochastic is overbought, but money flow is absolutely anemic. That's classic divergence, price going up on declining participation. Smart money's distributing into strength while retail's buying the breakout. I've seen this movie before, and it doesn't end well for late buyers.
Volume analysis supports the bearish thesis. We're running 30% above average at $26,852, which confirms active participation. But notice the wick structure: 18.4% lower wick shows buyers stepped in aggressively, yet we've got a 5.6% upper wick showing sellers immediately absorbed that pressure. In a healthy uptrend, you want to see small upper wicks and strong closes. This candle structure screams exhaustion.
From a structural perspective, we've formed a higher low (bullish), but we haven't confirmed a higher high yet (neutral to bearish). That makes this a potential bear flag rather than a reversal pattern. The Bollinger Bands are telling a similar story, we're trading just above the middle band at $90,391, but we haven't been able to sustain any momentum toward the upper band. That middle band is now acting as resistance rather than support, which is a bearish flip.
Support levels to watch: immediate support sits at the HMA55 around $90,540, then the EMA20 at $90,193. If those break, we're looking at a quick move back to the lower Bollinger Band at $87,864, which aligns with today's low of $87,688. That zone saw significant buying interest earlier, so it should provide a bounce, but if it fails, we could see acceleration toward the $86,200-$85,500 range where weekly support clusters.
Resistance is clearly defined: $92,918 (Bollinger upper), $93,179 (EMA200), and $93,500 (psychological). Any sustained move above $93,200 would invalidate this bearish setup and suggest we're heading for price discovery toward the $95,000 zone. But with current momentum and indicator readings, I'm assigning less than 30% probability to that scenario.
Trading setup: I'm looking at short entries in the $89,800-$90,500 range if we get a lower high formation on the 1H chart. Stop loss goes above $92,500 to give room for a false breakout. Targets are $87,800 (TP1), $86,200 (TP2), and $85,000 (TP3) for the aggressive traders. Risk/reward on this is roughly 1:2.5 to first target, which is acceptable given the confluence of bearish signals.
The internal market state shows bullish bias but only 38.6% directional confidence, that's essentially a coin flip, and when the algos are this uncertain, I fade the recent move. The 6-2 bull-bear stack sounds bullish until you realize that's only 75% agreement, and with ADX this high, we need near-unanimous confirmation for continuation.
Bottom line: this looks like a corrective bounce within a larger downtrend rather than the start of a new leg up. The combination of overbought Stochastic, weak money flow, bearish MACD, and resistance cluster overhead tilts the probabilities toward downside resolution. I'm giving this a 68% confidence bearish call, not slam-dunk territory, but enough edge to take a position with proper risk management.
What are you guys seeing here? Are you fading this bounce or waiting for confirmation above $93,200?
