Correction CompleteBTC should now hit our targets of 65.9k next
Other noteable supports are 59k and 57.1k
and finally, 48.2k (but I don't think this will happen for a few months)
Trade ideas

Watch Out! $BTC Trap Ahead!CRYPTOCAP:BTC 1H & 30 mint trend is still bullish, but on lower TF it has shifted to bearish. Be careful don’t get trapped by a small weekend pump.
Wait for my next update

Bitcoin: The Downtrend Begins Just as the title suggests, this is where Bitcoin is poised to fall once more.

BTCUSDT 4hr TF - 29th November 2025BTC USDT 4hr TF
As Long as price action remains above the mention support line can expect price to go further up as MACD has flip bullish on daily TF

My thoughts on BTC and the Market. $200K BTC looms on 2026.My thoughts on Bitcoin for 2025 yearly close and 2026. Covering TA, Macro, bullish signals, bearish signals and more.
Do you agree or disagree?

The god of fractal draw thisORVIBE STRATEGY
A new model thinking
New analyses and …
ORVIBE.
BE THE LIGHT!

BTC Major trend Bitcoin on the weekly timeframe is currently resting on four zones starting from March 2020 until now in late November 2025, and this is a strong indication of the strength and stability of the upward trend.
The 125K area is considered important to break with strong trading volume.
For more deep analysis flow me on Clubhouse
This is not financial advice.

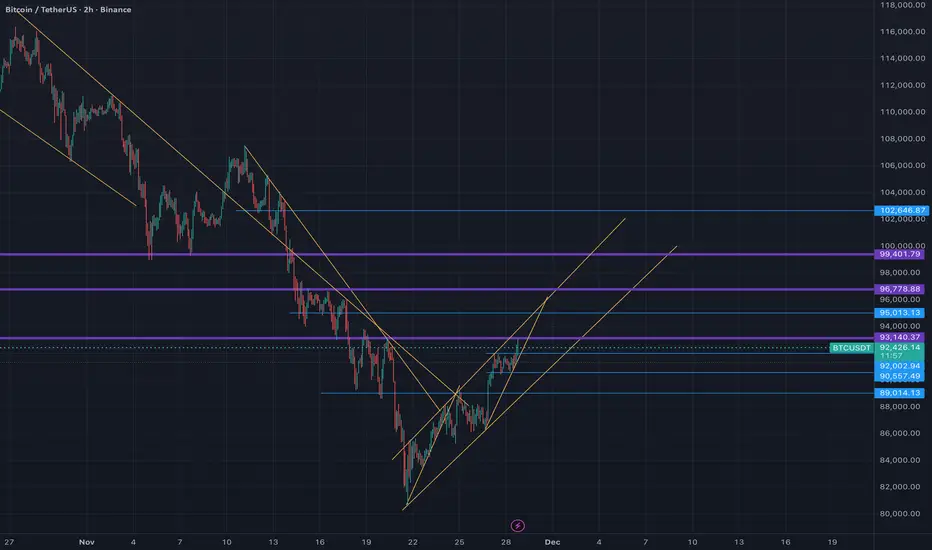
Falling Wedge on the 2H Timeframe: Is a Bullish Breakout BrewingHey TradingView community,
I’ve been closely monitoring Bitcoin’s price action amid this volatile November, and the 2H chart is painting an intriguing picture. After a sharp correction from October’s all-time highs above $126,000, BTC has been grinding lower, but it’s now forming a classic falling wedge pattern – a setup that’s often a precursor to bullish reversals in downtrends.    Check out my screenshot below for the details.
Key Observations from the Chart:
• The Pattern: We’ve got a descending resistance line connecting the lower highs since mid-November, paired with an ascending support line from the recent lows around $88,000-$90,000. This compression is typical of a falling wedge, where selling pressure diminishes, setting the stage for an upside breakout. If it holds, we could see a snap higher, similar to how these patterns resolved in past cycles.  
• Support and Resistance Levels:
• Strong support cluster at $92,000-$92,500 (current price action bouncing here) and lower at $89,000-$90,000, which has acted as a demand zone multiple times this month. 
• Overhead resistance at $96,000-$97,000 (prior highs), with a breakout potentially targeting $100,000-$104,000 based on the wedge’s measured move. On the flip side, a breakdown below $89,000 could open the door to $80,000 or even lower, as some analysts warn of deeper corrections.   
• Momentum Indicators: Volume appears to be drying up in the wedge, which is bullish, and RSI is hovering near oversold levels (around 30-40 on higher TFs), hinting at a potential rebound. No major divergences yet, but watch for one on the next leg down.
Market Context:
November 2025 has been a bloodbath for Bitcoin, with a 33% drop from peaks amid overleveraged longs getting flushed and broader macro pressures.  However, on-chain data shows accumulation by whales, and BlackRock’s ETF flows are turning positive again, suggesting the selling might be exhausting.  Sentiment is numb – perfect for a contrarian setup. Interestingly, ETH/BTC is also breaking out of its own multi-month wedge, which could signal altcoin strength if BTC stabilizes.  
Trading Idea:
• Bullish Scenario: Long on a confirmed breakout above the upper trendline (~$94,000) with stops below $92,000. Targets: $97,000 (short-term), $105,000+ (extended). 
• Bearish Scenario: If support cracks, short toward $85,000-$88,000, but I’d wait for confirmation to avoid whipsaws.
• Risk Management: Always use 1-2% risk per trade. Volatility is high, so position size accordingly. This isn’t financial advice – DYOR!
What do you think, bulls or bears in control? Drop your thoughts below. Let’s discuss!
#BTC #Bitcoin #Crypto #TechnicalAnalysis #FallingWedge #Trading
The Bill Williams Strategy ExplainedWe all know the market doesn’t always play nice, but the Bill Williams Fractal Indicator can help you read between the lines. If you're focused on fine-tuning your entries and exits, let’s break down how fractals can be a useful tool in your strategy.
What is the Bill Williams Fractal Indicator?
At its core, the Bill Williams Fractal Indicator is a technical analysis tool that identifies potential reversal points in the market. This indicator is based on the fractal definition by Bill Williams, who described fractals as price patterns that can be used to predict potential shifts in price direction.
In simple terms, a fractal pattern consists of five consecutive bars or candlesticks on a chart. The middle bar of this pattern represents a local peak or trough, while the two bars on either side of it are smaller. A bullish fractal occurs when the middle bar is a higher high than the surrounding bars, and a bearish fractal appears when the middle bar is a lower low.
Bill Williams Fractal Definition
The Bill Williams Fractal is defined by a sequence of five consecutive bars. The middle bar represents the peak (for bearish fractals) or trough (for bullish fractals), surrounded by smaller bars on both sides. When price breaks the high (for bearish fractals) or low (for bullish fractals) of this central bar, it signals a potential breakout.
How Does the Bill Williams Fractal Trading Strategy Work?
The Bill Williams Fractal Strategy is a proven approach in crypto trading. Whether you're a beginner or an experienced trader, using the fractal strategy can provide valuable insights into potential market reversals and breakouts. By combining the Bill Williams Fractal Indicator with effective risk management, you can improve your trading edge.
A common method is to use the 200 EMA to gauge the overall trend. If the price is below the 200 EMA, traders tend to focus on lower fractals and look for short opportunities, while if the price is above the 200 EMA, they focus on upper fractals and consider long trades. However, always remember to confirm the breakout of local levels for greater reliability in your trades.
Master the Bill Williams Fractal Strategy
The Bill Williams Fractal Strategy is a well-established method in crypto trading. Whether you're just starting out or you're an experienced trader, incorporating the fractal strategy can provide useful insights into potential market reversals and breakouts. By combining the Bill Williams Fractal Indicator with a solid risk management plan, you can enhance your trading approach.
That said, remember that no strategy guarantees success. Fractal trading isn't about predicting the market with absolute certainty — it's about managing your entries and exits with precision and maintaining discipline. Always make sure to think critically and adapt to market conditions. So, when you spot a Bill Williams Fractal on your chart, use it as a guide, but always trust your analysis and approach. Happy trading!

How to use statistics and Pine Script to find a real edge.Are patterns really profitable, or are we just connecting random candles with a story?
Most of us started trading by seeing patterns on the chart: double bottoms, pin bars, three green candles, “smart money” footprints… but do we have any evidence they actually works ?
In this idea, I want to talk about the statistical significance of chart patterns, and how you can use simple statistics + Pine Script to move from “I think this works” to “I measured this edge.”
◼ Patterns are opinions until you define them
“Strong bullish candle”, “nice rejection”, “liquidity grab” – these are subjective words.
Statistics don’t work with feelings, they work with clear rules. Before testing anything, a pattern must be converted into something like:
Candle 1: bullish, body size > X% of price
Candle 2: low does not break previous low
Close of Candle 3 > high of Candle 1
Once you can write your pattern as strict conditions (true/false), you can: Count how many times it appeared, measure what happens after it appears, and decide if it’s worth trading or not. That’s where Pine Script becomes a powerful research tool.
◼ What does “statistical edge” actually mean?
A pattern is interesting if, when you look at many occurrences, you see a consistent tendency. For example, choose a simple question like: “When this pattern appears, where is the price on average after 10 bars?”
If you track that over hundreds or thousands of samples, you’ll get:
How often price is higher vs lower (win rate).
The average move (for example, +0.8% after 10 bars).
How volatile or noisy the results are.
This doesn’t magically make a holy grail, but it tells you: Is this pattern better than random? Is it worth building a full strategy around it? Without this step, you’re basically trading based on screenshots and memories.
◼ Using Pine Script as your statistics magic tool.
Even without going deep into code, the logic in Pine Script is simple, here is a simple example that you can do.
A. Detect the pattern Whenever your conditions are true on a bar, mark that bar as a “pattern bar”.
B. Look forward in time For each pattern bar, check the price after N bars (for example 5, 10, or 20 bars later). Calculate the % change between the pattern close and the future close.
C. Aggregate the results Keep a running count: How many patterns triggered (sample size), How many ended positive (wins), The average % move after N bars.
D. Interpret the numbers If you find that your pattern appeared 800 times, and after 10 bars: 62% of the time price was higher, Average move was +0.6%... then you have something much more concrete than “this looks good on the chart.” You don’t need to turn this into a full strategy immediately. Even a simple statistical study like this already filters out a lot of illusions.
◼ Common mistakes when testing patterns
When you start doing this, it’s easy to fool yourself. A few traps to avoid:
Tiny sample size : If your pattern only occurred 15 times and 11 of them were winners, that 73% win rate is probably not reliable. Statistics start to mean something with large samples (hundreds or thousands of events).
Obsession with win rate : A 70% win rate means nothing if your winners are tiny and your losers are huge. You must look at: Average move, Distribution of outcomes (are there huge negative outliers?), How a realistic stop-loss / take-profit would behave. Sometimes a pattern with 52–55% win rate can be excellent if the average reward is larger than the average risk.
Overfitting the past : If you keep changing rules until the backtest looks perfect, you are no longer discovering a pattern – you’re forcing the past to agree with you. A healthier flow is: Start with a simple, logical idea. Define it clearly in rules. Test it on one market / timeframe. Check it on other symbols and timeframes without changing the rules.
If the edge survives in different environments, that’s much more interesting.
Using this approach will save you a lot of time and money in losses, do your research before taking a trade, make sure you have the statistical evidence if you want to trade a pattern.
i will be sharing more ideas on the use of Pinescript to improve your trading in the next days. make sure you follow me.
BTC not over yet.BTC is not over yet, As you can see on the chart there are still 2 major trends remaining as BTC is having a reaction of the 85k level. As long as we can remain this area, there are still possibilities fo a push to a new ath.

BTCUSDT Long PossibilityHere is a setup for a possible long on BTCUSDT in the immediate short term with a risk to reward 1:2

LONG TRADE (BTCUSDT)ENTRY: 92,300
STOP LOSS: 91,800
TP1: 93,100
TP2: 93,700
RRR: ~2.0:1
1m:
Clear micro breakout above 92,200, followed by tight consolidation and bullish wick reclaim
Structure formed a strong higher low → clean sniper entry near 92,300
Momentum candle confirms bullish intent
5m:
Strong bullish engulfing breakout from prior chop zone
Price reclaimed the 91,800–92,000 zone with follow-through
Volume increase supports breakout structure
15m:
Confirmed higher low → impulsive continuation
Holding above recent key consolidation resistance (~91,800)
Next clean target zone at prior rejection highs near 93,000–93,700

TradeCityPro | Bitcoin Daily Analysis #234👋 Welcome to TradeCityPro!
Let’s move on to the Bitcoin analysis. The market is continuing the upward movement it started earlier.
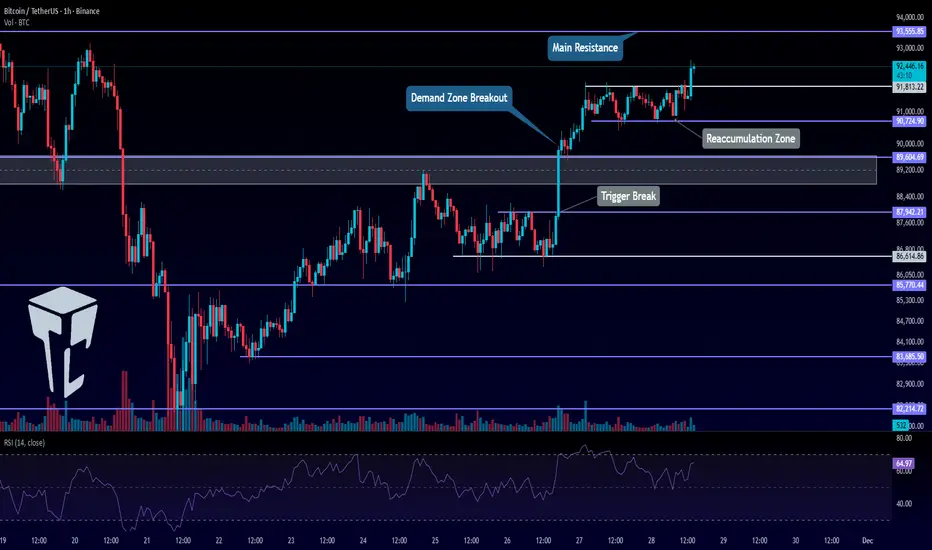
⏳ 1-Hour Timeframe
Yesterday, after breaking the resistance zone, Bitcoin entered a small ranging box, and now the price has managed to stabilize above this box.
🔔 This range allowed the price to rest, and with new momentum entering the market, Bitcoin is now ready to move toward the 93,555 level.
💥 The RSI oscillator has formed a new momentum low around the 50 level.
✔️ This shows increased bullish momentum compared to the previous leg, because in the previous leg, RSI’s support was at 21.
✨ If this new RSI low holds, the market’s momentum will remain bullish, allowing the price to continue its upward movement.
📊 The triggers we previously had 87,942, 89,000, and 91,813 all activated and are currently in profit.
The next trigger for Bitcoin is at 93,555.
⭐ When the price reaches 93,555, there is a high probability that the market will begin ranging again or enter a correction.
⚡️ So if I see signs of exhaustion or reversal at that level, I will manage risk and take profits on my positions.
❌ Disclaimer ❌
Trading futures is highly risky and dangerous. If you're not an expert, these triggers may not be suitable for you. You should first learn risk and capital management. You can also use the educational content from this channel.
Finally, these triggers reflect my personal opinions on price action, and the market may move completely against this analysis. So, do your own research before opening any position.
BTC/USDT Analysis. Local Structure Favors Buyers
Hello everyone! CryptoRobotics trader-analyst here with the daily market breakdown.
Yesterday, Bitcoin continued rotating inside the resistance zone at $90,000–$92,300.
Locally, there is a strong probability of a breakout above this range, followed by a move toward the next resistance at $94,000–$97,500 (volume zone). This is supported by the absence of aggressive selling pressure and the way volume is distributed inside the consolidation.
The $90,000 level remains a key pivot point. We still allow for a retest of this level before buyers attempt another upward move.
On a larger scale, once price reaches the next sell zone, we expect a deeper correction to form.
Buy Zones
$90,000 (cluster anomalies)
$88,000–$86,000 (local volume zone)
$84,000–$82,000 (volume anomalies)
Sell Zones
$94,000–$97,500 (volume zone)
$101,000–$104,000 (accumulated volumes)
$105,800–$106,600 (local resistance)
This publication is not financial advice.

BTCUSDT.PA safe and sound plan has been marked on the chart on 1 day TF.
It might take long time but as soon it will drop to our zone and we see some bullish momentum we are in definitely.
Trading is only patience we cannot just move with moving line.
We need the price to act as we need and once the price starts acting as we decided than it will go where we want to see.
Have a good trading.
Trade once or twice a month is better than trading whole day 24/7.
Make it a peace of mind not stress.
Follow for more.

Trend Exhaustion: How to Spot a Reversal Before It HappensReversals rarely start with dramatic candles. They begin quietly, through subtle shifts in momentum and structure that most traders overlook.
A strong trend doesn’t collapse all at once. It loses strength in stages, and those stages are visible long before price turns in the opposite direction.
The first sign of exhaustion is weakening impulse strength. In a healthy trend, impulsive moves are clean and decisive, and retracements are controlled. When each new push produces smaller higher highs or lower lows, it signals reduced participation.
Buyers or sellers are still present, but the force driving the trend is fading.
The second clue lies in how price interacts with liquidity. Strong trends break key levels with conviction. Exhausted trends start reaching above highs or below lows only to reject immediately.
These sweeps show that the market is clearing liquidity without gaining follow-through, often trapping late entries and signaling that larger players are offloading positions.
A third indication appears when structure begins to fracture. An uptrend losing its higher-low sequence or a downtrend failing to maintain lower highs is a shift in narrative. A single break is not confirmation, but when it aligns with slowing impulses and liquidity failures, momentum is clearly changing.
Volatility then begins to compress. Candle ranges shrink, movement becomes less directional, and price enters a tightening pattern.
This compression often precedes expansion in the opposite direction. When a decisive candle breaks out of this cluster, the reversal typically accelerates.
Trend exhaustion is about recognizing when the conditions that supported continuation no longer exist.
By reading momentum, liquidity, and structure together, you can anticipate shifts earlier, manage risk more effectively, and position yourself on the right side of the next move.
BtcBitcoin could experience a short-term decline. It looks like it could return to the $86,000-$85,000 range and reach its highest level.

$BTC Ready for Continuation?CRYPTOCAP:BTC on 30-minute chart is making an inverse H&S neckline is around 91,850.
As many of you know, inverse H&S can act like a trend-continuation pattern.
So here’s the question…
If neckline breaks, do you think trend will continue? 📈
Let’s learn together.

Bitcoin recovers rise again moveBitcoin is showing signs of bullish consolidation after a prolonged decline into key support. Based on the current range structure, the market may be preparing for an upward move.
The recovery aligns with broader market sentiment, as U.S. stock indices recorded their fourth consecutive session of gains, driven by expectations of potential Federal Reserve interest-rate cuts.
From a technical perspective, if Bitcoin can hold bullish momentum and secure a 4H candle close above the 90,000 level, it would strengthen the case for continuation to the upside. After the recent long fall, price may look to retest overhead resistance in the 98,000 – 105,000 zone.
You may find more details in the chart.
Trade wisely best of Luck buddies.
Ps; support with like and comments for better analysis thanks for supporting.

btcusdtBitcoin (BTC) Daily Technical Analysis
Current Market Context:
Price action suggests a bearish intraday bias within the broader context. The setup indicates a potential for a short-term decline towards lower support levels.
Trade Setup Overview:
Direction: Short (Bearish)
Strategy: Fade on strength towards resistance / anticipate breakdown.
Execution Parameters:
Entry Point: $91,630
Rationale: This level is anticipated to act as a point of rejection following a retest of a breakdown level or a minor resistance zone.
Stop-Loss: $92,065
Rationale: Placed just above the recent swing high or a key resistance level. A break above this invalidates the bearish premise and suggests a potential move higher.
Take-Profit Target: $90,365
Rationale: This target aligns with a significant support level where profit-taking or a bullish reversal might occur.
Risk Management:
Risk/Reward Ratio: ~1:4.9
This is an excellent risk-to-reward ratio, where the potential profit significantly outweighs the potential loss.
Position Sizing: Ensure the position size is calibrated so that a loss from this trade remains within your predefined risk tolerance (e.g., 1-2% of total capital).
Technical Justification & Chart Analysis:
This setup implies that Bitcoin is facing selling pressure near the $91,630 - $92,065 zone. A rejection from this area, confirmed by bearish price action (e.g., a bearish engulfing pattern, pin bar, or loss of momentum), could trigger a sell-off towards the $90,365 support level.
The trade's validity relies on the market structure remaining bearish on the lower timeframes (e.g., 4-hour or 1-hour charts). The tight stop-loss requires precise execution.
Conclusion:
This is a high-probability, high-R/R short-term bearish setup. The key to success lies in waiting for confirmation at the entry zone rather than entering blindly. Monitor lower timeframes for bearish confirmation signals before executing the trade.
Disclaimer: This analysis is for educational purposes only and does not constitute financial advice. Trading cryptocurrencies carries significant risk.

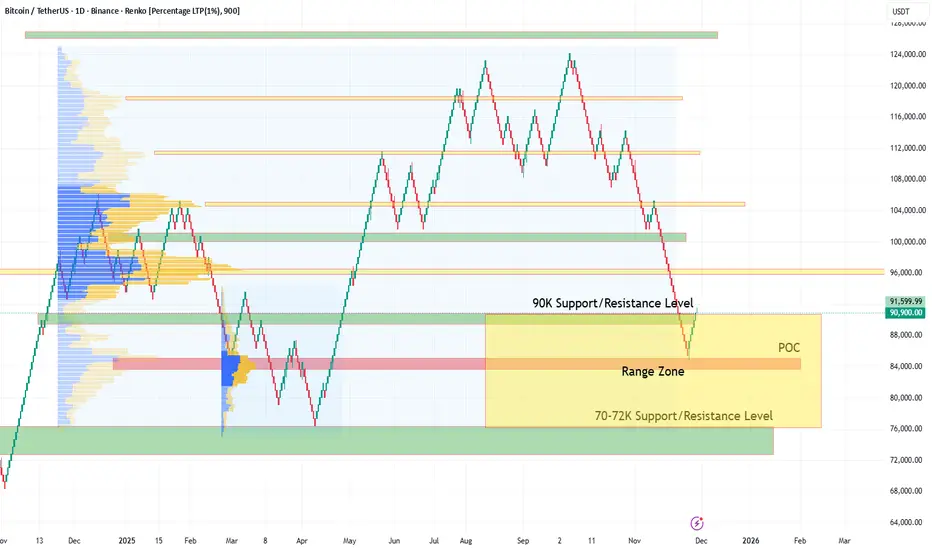
Bitcoin Tests $90K Range High: Binance Netflows Signal PotentialTechnical & On-Chain Outlook:
After losing the $90K support level, Bitcoin has settled into a clear Range Zone between $70,000 and $90,000.
As seen on the technical chart, price action found support near the Point of Control (POC) and is now rallying to test the Range High at $90K.
Binance Netflows: Bearish Divergence Appears
Binance’s 7-day cumulative netflow data highlights a potentially bearish setup:
1. Heavy Asset Inflows (Bearish Signal)
Large amounts of crypto assets have been deposited into Binance:
$2 Billion in BTC
$500M in XRP
$315M in ETH
Such large inflows typically indicate an intention to sell.
2. Weak Stablecoin Buying Power
Stablecoin movements show limited demand:
$1.4B USDT flowed into the exchange
$665M USDC flowed out
➡️ Net stablecoin inflow: ~$735 Million
This represents the actual available buying power on Binance.
Conclusion
A clear supply-demand imbalance is forming:
Potential selling pressure: ~$2.8B (Crypto assets)
Available buying power: ~$0.735B (Stablecoins)
This strongly suggests that short-term investors are preparing to sell at the range ceiling.
Without a renewed wave of stablecoin liquidity, a clean breakout above $90K is unlikely.
A rejection from the range high and continuation within the $70K–$90K range appears to be the more probable scenario.