BTCUSD SELL NOW!!!BTCUSD completed +1,800pips from my yesterdays analysis predictions today made made a sharp pull back into my 75% sell zone in my fib level in the premium zone am on a sell from this zone holding till price arrives 80k.....
Trade ideas
Bitcoin Ready to Casually Liquidate $300MLadies and gentlemen, today is November 26. If you’re still alive in the market, let me be the first to congratulate you—because that means you actually use proper capital management and set stop losses.
In this analysis, we’re going to pinpoint Bitcoin’s next triggers together, get a crystal-clear picture of the current structure, conditions, and scenarios, and trade them side by side.
Hey, I’m Skeptic , and this is Skeptic Lab . If you want to level up your trading knowledge through data, psychology, and real strategy and actually become consistently profitable, you’ve come to the right place.
Let’s jump straight to the charts. 📉
In the daily timeframe , after that massive sell-off candle on November 21, Bitcoin immediately went into ranging mode. Volume dropped hard, and RSI bounced back above 30. After breaking 100k—as I’ve been saying for weeks—the MWC has officially turned bearish, so every bounce back to that zone is nothing more than a pullback. If this 4H correction we’ve started continues, it can easily reach 91,213.99 (the 0.5 Fib), so if you’re opening longs, your target should be exactly 91,213.99.
🔍Now let’s drop to the 4H timeframe to hunt for actual triggers.
In the 4H, we have a weak upward channel that’s really just the daily bearish correction. We’re ranging between two key levels:
- Resistance: 88,118.70
- Support: 86,224.62
Breaking either one is our long or short trigger.
But here’s the risk-management difference: 📍
For longs (which are counter-trend to the MWC), we use a very tight stop loss and take profit quickly.
For shorts, we can accept slightly higher risk and scale out with partial profits.
Important note: Throughout this entire range box, volume has been consistently dropping—this means the next move is getting closer and closer. Stay very alert inside this box.
If this analysis helped you, I’d really appreciate a boost—it gives me energy to keep going.🩵
Now get outta here.

Bitcoin - Tue - 11/25/2025 - LongBitcoin could go up today and tomorrow.
Tue
11/25/2025
Lev: 37x
TP:88930
En:87047
Sl: 85133
This is a trading setup for myself. Please follow money management. This is not an offer to buy or sell.

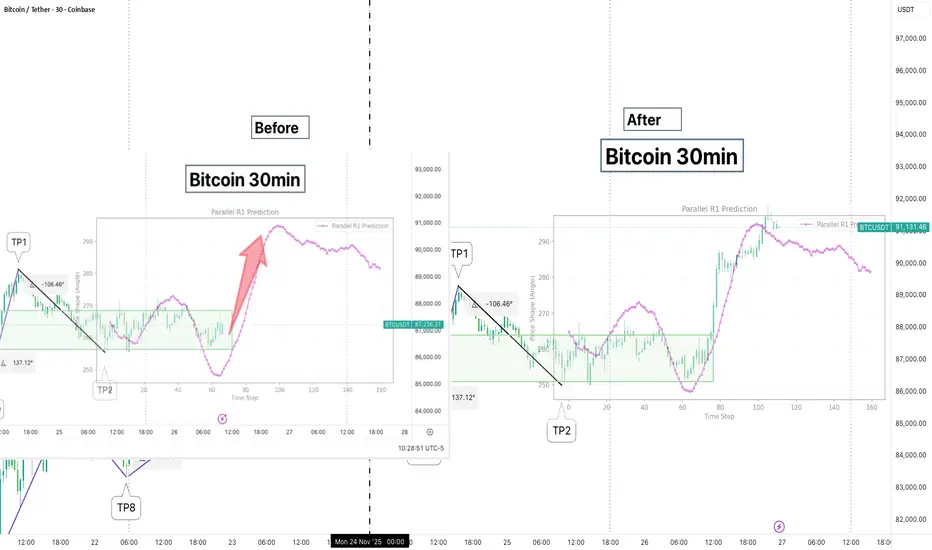
An update from yesterday. AI prediction did it againThe left is the ‘before’, what we are looking at yesterday
And the right is the ‘after’, which is what happened thereafter
The focus point is the AI prediction said it was going to go up, and it did exactly as it said it would
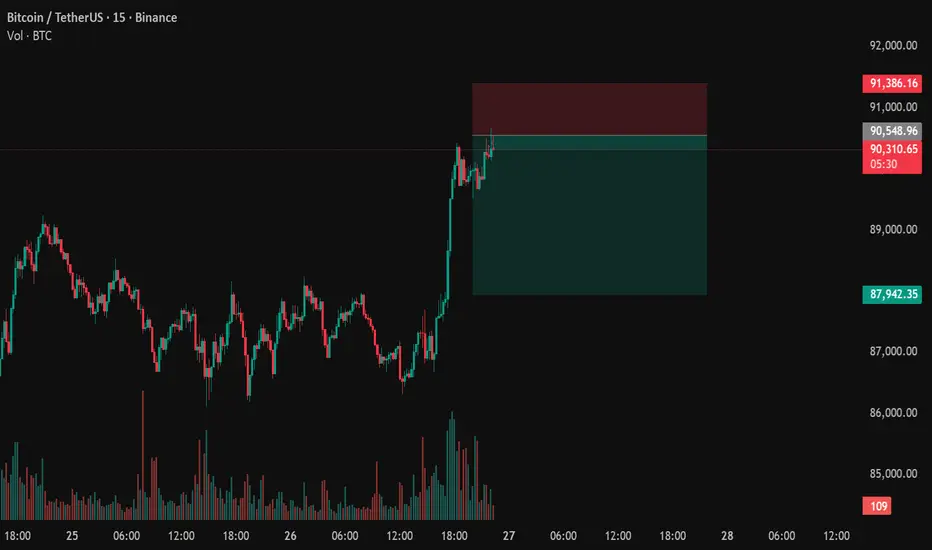
BTCUSDT.P - November 27, 2025On the 15-minute chart for Bitcoin, price is in a strong short-term uptrend, marked by a steep series of higher highs and higher lows culminating in a parabolic push into local resistance around 91,800–92,300. The latest candles show upper wicks and a loss of follow-through, indicating fading bullish momentum and the risk of a pullback. A corrective move toward the nearest intraday support band around 89,700–90,100 would be a normal retracement within the broader advance, and aggressive longs may look to reduce risk while conservative traders wait for a reaction at that support zone before re-entering.

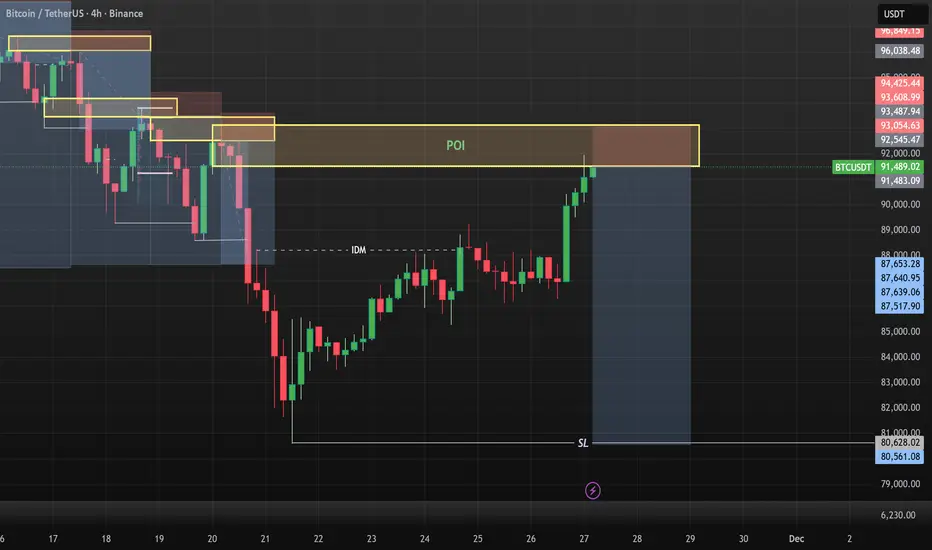
$BTC: Red zone tapped staying defensive.Red zone has been hit, so we need to stay cautious. BTC and alts will remain risky until this level is reclaimed.

BTCUSD — Bullish Above 82,725 With Long-Term Target at 141,300BTC remains bullish as long as price holds above the key support at 82,725. This zone is the base of the current structure, and maintaining it keeps the long-term target at 141,300 in play. In a bearish scenario, price cannot break above the key support zone; any move toward it while trading below is only a corrective bounce. Holding above 82,725 supports continuation toward 93,723, 103,830, and ultimately 141,300,

BTC what is nextBTC is currently trading within a falling expanding wedge, a structure characterised by widening swings and increasing volatility. This pattern commonly develops during the later stages of a corrective trend, when the market begins repeatedly testing both extremes while gradually exhausting selling pressure.
The recent decline pushed price deep into the major demand zone, swept liquidity beneath the previous lows, and then produced a sharp reversal. This sequence aligns with typical expanding wedge behaviour, where the market often triggers stop-runs before stabilising or shifting direction.
At the moment, BTC is retracing toward the mid-region of the wedge. As long as price stays within the expanding boundaries, the structure continues to support the idea of a potential lower-high forming near the upper trendline. Despite short-term volatility, the broader context still reflects controlled bearish pressure until a decisive breakout occurs.
Key Structural Notes:
• Price remains inside the falling expanding wedge formation
• The recent bounce originated directly from a high-value demand area
• Liquidity sweep behaviour matches typical wedge characteristics
• The broader trend stays corrective unless the wedge is broken decisively
Invalidation Level:
A break and continuation above 107,550 invalidates this scenario. Such a move would confirm that BTC has exited the wedge to the upside, signalling that the bearish structure is no longer active.
In simple terms:
BTC is moving inside a falling expanding wedge. It swept liquidity, rebounded strongly, and is now heading toward the upper boundary of the structure. The pattern remains valid while price holds below 107,550. A breakout above that level would indicate a shift in favour of the bulls.

BTC/USDT Technical Analysis, 2025-11-25 12:00 UTC🎯 BTC/USDT Technical Analysis, 2025-11-25 12:00 UTC
📊 Market Context
Type: Technical outlook
Potential Entry Zone: 87,300 – 87,450
Potential Upside Level: 91,300
Defined Invalidation Level: 85,600
Approx. R/R Concept: ~1:2.25
📈 Technical Analysis Overview
🔹 Fibonacci Structure
Price interacting with the 0.382–0.500 retracement zone
Historically acted as a reaction area
Current structure suggests prior buyer interest
🔹 Order Flow & Liquidity Context
Higher bid activity relative to recent sessions
Liquidity concentration forming under 87,400
Order book imbalance suggests buyers currently more active
🔹 Momentum Indicators
RSI rebounding in 35–45 zone
Stochastic showing bullish cross in lower band
MACD histogram trending upward toward zero line
Volume profile showing active participation around current range
📊 Volume & Trend Context
OBV trending upward over recent candles
Volume spikes near local support
Overall volume structure supportive of continuation if follow-through occurs
🎯 Key Market Levels
Immediate Support: 86,800
Major Support / Invalidation: 85,600
Zone of Interest 1: 89,200
Zone of Interest 2: 91,300
Extended Area (if momentum holds): 93,500
⚡ Structural Notes
Market forming tight consolidation after prior downside
Sellers showing reduced follow-through at support
Multi-timeframe momentum gradually aligning to upside
📘 Trade Planning Concepts (Analysis Only)
Confirmation above 87,400 may indicate stronger buyer intent
Scaling entries can be considered in volatile environments
Break-even adjustment often considered after 89,200
Partial profit-taking at predefined levels can help manage volatility
⚠️ Risk Framework
Maintain position sizing according to personal rules
Predefine invalidation at 85,600
Monitor volume for continuation; low volume may invalidate the structure
Avoid late entries after breakout without pullback
📱 Checklist
Fibonacci zone interaction
Increasing buyer participation
Strengthening momentum indicators
Volume supportive of upward attempts
Favorable risk/reward structure
🧭 Timeframe & Method
Approach: Short-term & Scalping technical analysis

BTC Short - Structured ScalpingJoin me on the short side.
My trades are based on a personal setup focused on liquidity and supply–demand dynamics
$BTC: Always think beyond the crowd. CRYPTOCAP:BTC is playing out exactly as expected. Fresh demand and supply zones are marked on chart.
When everyone turns bearish, that’s usually the hint that insiders start getting bullish and when everyone gets bullish, insiders flip bearish.

Bull Trap is forming - Target $115kThere will be positive news soon to trap bulls. Target $115k.
Then we nuking either before Christmas or after 20th Jan 2026.

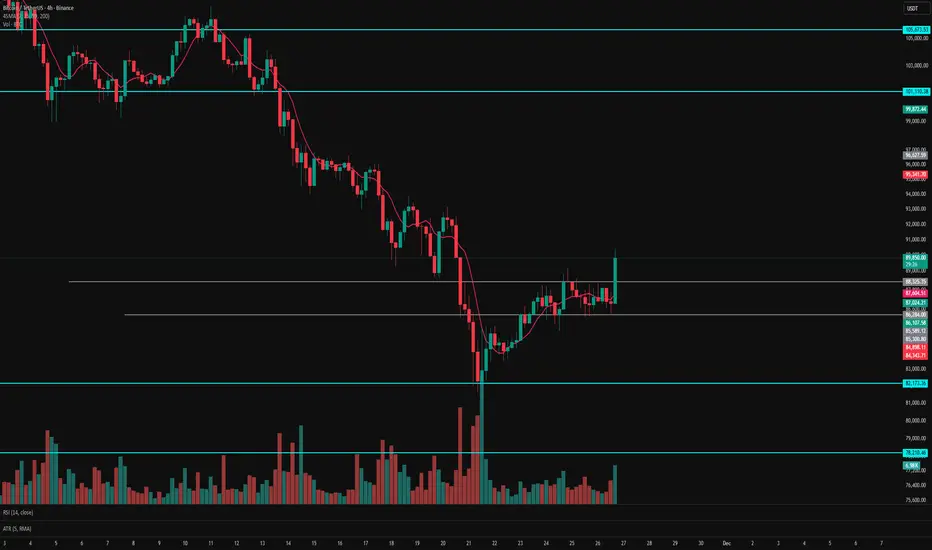
QUICK ANALYSIS (1H) — BTC BOUNCED FROM RESISTANCE✅ 1. Breakout from the downward trendline
On the chart, I see:
a yellow downward trendline—it has been broken,
the candlestick dynamically breaks through it and closes above it.
➡️ This is the first signal of a shift in momentum to upward.
✅ 2. Price is testing the 200 SMA (blue)
BTC is currently:
touching the 200 SMA,
bounces slightly downward—a classic reaction to strong resistance.
➡️ Until we break through the 200 SMA, the market remains in a downtrend.
🟩 3. Nearest resistance levels (green levels on your chart):
90,400 USDT – current resistance (reaction already visible)
92,500 USDT – next important level
93,200–94,000 USDT – strong supply zone
94,900 USDT – strong level from previous bounces
➡️ The closer the price gets to 94–95k, the greater the chance of a downward rebound.
🟥 4. Nearest support levels
From your red levels:
88,700 USDT – first level of defense
87,500 USDT – key support
85,500 USDT – major local bottom
84,150 USDT – extreme support
➡️ If BTC returns below 87.5k, the correction will deepen.
📊 5. RSI — Neutral-Bullet
RSI ~ 55,
Not yet overbought,
RSI trend is increasing.
➡️ There is room for further upward movement.
📉 6. MACD — Bullish Signal
MACD has crossed the signal line upward,
the histogram is rising.
➡️ Upward momentum, shorting here is risky.

Bitcoin short term.Think simple. Basic 5 waves Elliot.
* The purpose of my graphic drawings is purely educational.
* What i write here is not an investment advice. Please do your own research before investing in any asset.
* Never take my personal opinions as investment advice, you may lose your money.

Bitcoin Analysis – November 26|First real bounce after the dumpHello traders! Hope you're having an amazing day 🚀
Let’s jump into today’s Bitcoin analysis 👇
The Fear & Greed Index is still sitting at 15 today—same as yesterday—and the market is moving exactly in line with yesterday’s scenario.
If you already have an open position, it’s a good idea to secure some profits here 💰.
Now, let’s focus on the current trend. This is the first real bullish leg after the sharp dump we experienced in recent weeks, so keep a close eye on buyer behavior.
Buyers must hold the $88K level they broke above. Dropping back below it would be a strong warning sign of a possible trend reversal ⚠️.
If your strategy gives you a valid trigger, you can look for entries — just stick to proper risk management 📉📈.
Volume is still supporting the bullish move, but after breaking 88K, price is stuck around the 90K level.
A correction could give a cleaner opportunity for a long entry, but remember:
We just printed a strong Marubozu candle — and entering right after a Marubozu usually isn’t ideal because the stop-loss becomes too wide and you lose your 2:1 R/R setup❗
So my suggestion: wait for a pullback before entering a new trade ⏳
And whatever position you take — always secure profits! 🔐
Hope you enjoyed today’s analysis.
Share your thoughts in the comments — I’d love to hear your view! 💬✨
Difficult and imperfect swing trade setup on BTCUSD dailyCOINBASE:BTCUSD has broken below its rising channel and is now exhibiting a downward trajectory. This shift creates a potential swing-trading opportunity arising from two distinct scenarios:
A reversal of the current downward trend, leading to a renewed bullish movement, or
A temporary pullback within the continuation of a broader bearish trend.
On the weekly timeframe, the first major traditional moving average above the current price is the 50-week moving average, positioned at approximately 100,000 USD. The daily chart reflects a similar structure: the nearest significant moving average above is again the 50-day moving average, also situated near 100,000 USD. This alignment establishes a notable—albeit high-risk—swing-trade setup. Should the price initiate even a micro bullish trend within a larger bearish context, the most probable target for such a move would be a reversion toward the 50 DMA at around 100,000 USD.
Supporting this thesis, several momentum indicators—specifically the RSI, Rate of Change (ROC), and MACD—are beginning to turn upward from recent troughs. This emerging positive momentum suggests that underlying buying strength may be forming, which would be consistent with the early stages of a bullish swing within a broader bearish structure.
A potential entry trigger on the daily chart would occur once price breaks above and remains above the 10 DMA for a sustained period (e.g., a 1- to 3-day confirmation filter, depending on risk tolerance). Historically, such moves have provided reliable signals on at least four consecutive prior occasions as depicted in the chart.
However, caution is warranted: daily closes above the 10 DMA are common, and many such moves fail to persist. This is why a multi-day filter is proposed—to increase the probability that the breakout represents a genuine shift rather than short-lived noise.
Proposed Trade Parameters
Entry: Break and sustained hold above the 10 DMA (estimated near 90,000 USD).
Take Profit (TP): Reversion to the 50 DMA (approximately 100,000 USD).
Stop Loss (SL): A daily close back below the 10 DMA (likely around 95,000 USD).
Risk–Reward Ratio: ~1:2.
Important Caveats: This setup is inherently imperfect, as both the entry and stop-loss levels are determined by moving averages and the trade itself yields a relatively modest risk–reward profile. Moreover, the rationale for a bullish retracement is based solely on technical patterns—specifically, the observation that counter-trend rallies frequently occur even within pronounced bearish phases. There is, at this point, no anticipated fundamental catalyst or macro-level justification supporting an imminent bullish move; the thesis is grounded entirely in probabilistic technical behaviour.

AI on the markets is the answerIts been many years of hardship trying to figure this damn market thing out
AI taught to do MTOPS gave it super human abilities
2026 is where it all turns around
Welcome to a preview of your future

How to use EMA+ATR scalping - Performance Breakdown📌 EMA + ATR Scalping Indicator – Performance Breakdown (Based on Chart)
This was my first indicator ever (built last year), and seeing its performance on the chart today again reminds me why it worked so well for both scalping and swing-style trend capture.
🔹 What the Indicator Is Doing on This Chart
1. Capturing Trend Direction Early
The combination of the EMA (trend filter) and ATR-based trailing stop (volatility filter) helps the indicator catch directional moves very cleanly.
• During strong directional phases (uptrends or downtrends), the signals appear right as momentum shifts.
• In the first half of the chart, every bearish impulse is detected quickly, and the EMA+ATR cross confirms continuation.
You can clearly see how:
✔ The SELL signals appear early on sustained drops
✔ The BUY signals appear early when bullish momentum kicks in
✔ There are hardly any “late” entries due to ATR’s responsiveness
⸻
2. Reversal Detection Is Smooth & Immediate
One of the strongest parts of this indicator is how it flips direction without delay.
Whenever price breaks the ATR trailing stop from the opposite side:
➡ A reversal signal is generated
➡ The previous directional bias is cancelled
This prevents holding a wrong-bias trade for too long.
Even in sideways phases, reversals are caught fast—helping scalpers avoid getting stuck.
⸻
3. Handles False Breakouts Surprisingly Well
This chart shows multiple places where price tries to break in one direction but gets rejected immediately.
The indicator reacts quickly because:
• EMA confirms the micro-trend
• ATR trailing stop invalidates fake moves
• The system flips signal as soon as true momentum appears
This “two-layer confirmation” makes the signals tighter and reduces whipsaws.
So yes—capturing false breakouts and flipping instantly is one of the biggest USPs of this script.
⸻
4. Consecutive Candle Momentum Logic
The script includes a 5-bar consecutive breakout filter, which increases the probability that a breakout is real.
This further improves:
✔ Trend continuation entries
✔ Avoidance of weak or random breakouts
✔ Early detection of strong impulses
You can see how this filter helps catch those clean legs in the chart’s mid-section.
⸻
🔹 The Grey “No-Trading Zone” — A Very Useful Filter
The grey highlighted vertical bands represent periods when the ATR stays too flat.
Flat ATR = low volatility = trap zone.
The indicator marks these with:
• Grey background shading
• “No Trading Zone” label on the candle
These filtered areas clearly show:
❌ Avoid entering — market is undecisive
❌ Signals here are often fake
✔ Wait until volatility expands again
This simple visual filter improves discipline and prevents unnecessary losses.
⸻
🔹 Overall Performance on the Chart
✔ Strong Trends → Clean Signals
The indicator rides the trend well (both up and down), capturing the majority of each move.
✔ Reversals → Early Detection
Quick flips keep you aligned with the new direction without holding drawdowns.
✔ Sideways Market → Controlled Exposure
ATR-flat grey zones protect you from chop.
✔ False Breakouts → Immediate Recovery
When the initial direction fails, the indicator immediately prints the opposite signal.
✔ Scalping & Swing Both Supported
The fast ATR logic supports scalpers,
the EMA confirmation supports swing traders.
⸻
🔹 Why This Indicator Still Feels Powerful (Even Today)
Because it is built on three timeless trading foundations:
1. Trend logic (EMA)
2. Volatility logic (ATR)
3. Breakout momentum (5-bar filter)
These three combine in a very natural way—hence the clean signals you see on the chart.

Candlesticks & Apprenticeships Terry had already made it — the once‑green trading apprentice who used to confuse candlesticks with birthday candles was now retired, sipping coffee while his charts practically traded themselves.
But the young mechanic‑turned‑mentor who had taught Terry felt restless. Without a student, life was just torque specs and empty charts. Then he spotted one of his own apprentices, a kid with grease under his nails and ambition in his eyes, about to strike out on his own.
“Forget the socket set,” he said, pulling him aside. “Let me show you the kind of tools that don’t rust — candlesticks, Fibonacci, and a little thing called risk management.”
The apprentice squinted at the screen. “So green means money, red means panic?”
“Close enough,” the mentor laughed. “You’ll be calling support and resistance before you finish your first week.”
And sure enough, by the end of that week, the kid was charting faster than Terry ever had. Where Terry once thought RSI was a brand of ratchet set, this apprentice was spotting breakouts like he was reading torque specs.
The mentor shook his head. “I spent months teaching Terry not to panic when a chart dipped. You? You’re already talking risk management like it’s a lug nut torque spec.”
The apprentice grinned. “Guess I’m just built different.”
And so the cycle continued: Terry, the retired trading apprentice, had proven the path. The mentor had found new purpose. And the new kid was showing promise ten times faster — proving that sometimes the best trades aren’t made with wrenches, but with wit, patience, and a chart that finally makes sense.

CRYPTOCHECK Throwback - BEST POSTS 2025New Year loading 🥳🥂
Setting up your trading technique and sticking to it
The Dunning Kruger Effect
How to trade Bollinger Bands
How to Dollar-Cost-Average
Spotting reliable Bottom Patterns
These ideas may help you improve your strategy and become a more profitable trader. Happy Trading!

BTC: Waiting for 120KBTC is currently below 90K, which is a great buying opportunity. Hold patiently and wait for it to reach 120K.
I'll send out accurate signals right at the opening every day, don't miss out.

The end of crypto being an alt investment?If ever there was evidence that crypto has become normalized and absorbed into mainstream institutional behaviour—moving more like a unified asset class and less like a collection of wild outliers—this is it.
Across four randomly selected coins with very different purposes and market caps ( COINBASE:BTCUSD - top left, COINBASE:XRPUSD - top right, COINBASE:SOLUSD - bottom left and BINANCE:TRXUSD - bottom right):
2 out of 4 ranged 35–40% in an almost identical pattern over the same period
3 out of 4 ranged 35–48% in an almost identical pattern over the same period
4 out of 4 ranged 20–48% in an almost identical pattern over the same period
These similarities raise the question: are we now past the era of:
Huge, isolated crypto swings?
Crypto consistently moving counter to the S&P, FTSE and other indices?
Crypto acting as a true alternative asset class?
Not quite.
Yes, institutional capital is now clearly in the market, but how crypto behaves still depends heavily on how those institutions manage their allocations.
Crypto remains capable of sharp, counter-intuitive moves—but with less of the explosive upside (or catastrophic downside) that defined the early years. Crypto volatility is likely to be lower than before—but still far above that of major indices or mega-cap equities (the “Apple/Google/Amazon equivalents” of traditional markets). And crucially, crypto can still move counter to the stock market, as shown in the second image where BTC (and most major coins) fell while equities rallied.
This also leads us to the following - the three investor archetypes now dominating crypto:
The Whales – Formerly wealthy early adopters, but now overwhelmingly institutional players. Their capital, risk management structure and access to liquidity eclipse everyone beneath them.
The Sharks – Yesterday’s whales. Powerful enough to cause volatility and trigger widespread stop-loss cascades, but no longer able to dictate the market the way they once could.
The Nemos – Retail investors, small and scattered, swimming in the wake of the larger fishes while trying (often desperately) to “find Dory*.”
At the same time, crypto has shown increasing correlation with stock market trends—particularly between April and October—further evidence of institutional influence and a sign that crypto is becoming mainstream, integrated, and less viable as a true alternative asset class capable of life-changing returns (or losses).
Notes:
* Dory: Alpha – mythical, elusive, and mostly found in pixel form (cinemas, and charts on social media trading apps :-) ).

BTCUSDT Liquidity Grab at Resistance – Bearish Reversal SetupBitcoin is currently ranging between a well-defined resistance zone near 88,000–88,400 and a support zone around 86,700–86,300. Price action shows repeated rejections at the top of the range, suggesting strong selling interest.
🔵 Resistance Zone (88,000–88,400)
This blue block has acted as a major supply area. Each time price taps into this zone, sellers quickly push the market back down.
The circle on the chart highlights a potential final liquidity grab before a move lower.
• Expectation: Price may spike back into the resistance block to collect liquidity before reversing.
🟡 Support Zone (86,700–86,300)
This area has held multiple times and remains the primary demand zone of the range.
However, the reactions here are becoming weaker, suggesting buyers are losing strength with each test.
📉 Bearish Scenario (Most Probable)
• Price likely moves back into the 88,000–88,400 resistance to fill liquidity.
• From there, a rejection is expected as sellers dominate.
• A break below the support zone opens the path toward your target area around 86,400.
This aligns perfectly with the downward arrow drawn on your chart.
📌 What Confirms Bearish Continuation?
• Bearish rejection candles inside the resistance zone
• Break of structure below 86,700
• Increased sell volume on the push down
❌ Bullish Invalidations
The bearish outlook is invalidated only if price:
• Breaks and closes above 88,400,
• Sustains new higher highs on the 15m.
Until then, the setup remains bearish within a range-bound market.
